XGMI, PCIe, and SDMA metrics sampling and monitoring#
ROCm Systems Profiler supports sampling of XGMI and PCIe interconnect metrics, as well as SDMA engine utilization, via AMD SMI.
It allows you to gather key performance metrics for GPU-to-GPU communication via XGMI links, CPU-to-GPU communication via PCIe links, and asynchronous copy activity handled by the SDMA engines. Use this information to optimize multi-GPU workloads, identify communication bottlenecks, and analyze data transfer efficiency in high-performance computing applications.
Sampling support#
Sampling of XGMI, PCIe, and SDMA metrics is supported by leveraging AMD SMI which provides the interface for GPU metric collection. To enable sampling, follow these steps:
Set the
ROCPROFSYS_USE_AMD_SMIenvironment variable to enable GPU metric collection:
export ROCPROFSYS_USE_AMD_SMI=true
Update the
ROCPROFSYS_AMD_SMI_METRICSvariable to collect the XGMI, PCIe, and/or SDMA metrics. The default value is:
ROCPROFSYS_AMD_SMI_METRICS=busy,temp,power,mem_usage
To include XGMI, PCIe, and SDMA usage metrics, update it to:
ROCPROFSYS_AMD_SMI_METRICS=busy,temp,power,mem_usage,xgmi,pcie,sdma_usage
Alternatively, to collect all available GPU metrics, run:
ROCPROFSYS_AMD_SMI_METRICS=all
XGMI metrics#
XGMI (AMD Infinity Fabric™ XGMI) provides high-bandwidth, low-latency GPU-to-GPU interconnects in multi-GPU systems. The following XGMI metrics are collected:
XGMI Link Width: The number of active XGMI links between GPUs.
XGMI Link Speed: The speed of XGMI links (in GT/s).
XGMI Read Data: Accumulated data read through each XGMI link (in KB).
XGMI Write Data: Accumulated data written through each XGMI link (in KB).
These metrics help identify GPU-to-GPU communication patterns and bandwidth utilization in multi-GPU workloads.
Note
XGMI metrics are only available on systems with multiple GPUs connected via XGMI links. The availability depends on the system topology and GPU architecture. If unsupported or not available, the values will be reported as N/A in the output.
PCIe metrics#
PCIe (PCI Express) provides the connection between the CPU and GPU. The following PCIe metrics are collected:
PCIe Link Width: The number of PCIe lanes currently active
PCIe Link Speed: The current PCIe link generation and speed (e.g., Gen3, Gen4, Gen5)
PCIe Bandwidth Accumulated: Total bandwidth accumulated over time (in MB)
PCIe Bandwidth Instantaneous: Instantaneous bandwidth at the time of sampling (in MB/s)
These metrics help analyze CPU-to-GPU data transfer efficiency and identify PCIe bottlenecks.
SDMA metrics#
SDMA engines perform asynchronous memory copies and related DMA work on the GPU. When
the sdma_usage metric is enabled, ROCm Systems Profiler samples SDMA usage:
device-level SDMA utilization as a percentage (0-100), aggregated across processes on that
GPU.
These samples help correlate sustained hipMemcpy-style traffic and other SDMA-backed
transfers with engine load in Perfetto or ROCpd output.
For a small workload that exercises H2D, D2D, and D2H copies for benchmarking and
profiling, see sdma-test on GitHub and the sdma-test README on GitHub (build steps,
flags, and rocprof-sys-run invocations).
Note
The sdma_usage metric requires AMD GPU Driver (amdgpu) 31.40.0 or later and an AMD Instinct-family GPU.
If the driver or hardware does not expose SDMA usage, values may appear as N/A.
Using TransferBench for testing#
For testing and benchmarking GPU connectivity, you can use TransferBench. TransferBench is a benchmarking utility designed to measure the performance of simultaneous data transfers between user-specified devices, such as CPUs and GPUs.
For this example, TransferBench is used to profile XGMI and PCIe traffic for analysis. For SDMA-focused runs, use the Using the sdma-test example for testing workflow instead.
Source the ROCm Systems Profiler Environment using:
source /opt/rocprofiler-systems/share/rocprofiler-systems/setup-env.sh
Alternatively, if you are using modules, use:
module use /opt/rocprofiler-systems/share/modulefiles
Generate and configure the profiler config file.
rocprof-sys-avail -G $HOME/.rocprofsys.cfg -F txt
export ROCPROFSYS_CONFIG_FILE=$HOME/.rocprofsys.cfg
Edit .rocprofsys.cfg with the following settings:
ROCPROFSYS_USE_AMD_SMI     = true
ROCPROFSYS_AMD_SMI_METRICS = busy,temp,power,mem_usage,xgmi,pcie
ROCPROFSYS_ROCM_DOMAINS    = hip_runtime_api,memory_copy,hsa_api
Profile the TransferBench application.
rocprof-sys-sample -PTHD -- ./TransferBench a2a
Note
For information on installing TransferBench, refer to Building TransferBench from source.
At the end of the run, a similar message appears:
[rocprofiler-systems][964294][perfetto]> Outputting '/home/demo/rocprofsys-transferBench-output/2025-04-25_15.52/perfetto-trace-964294.pftrace'
(3124.52 KB / 3.12 MB / 0.00 GB)... Done
To view the generated .pftrace file in the browser, open the Perfetto UI page.
Then, click on Open trace file and select the .pftrace file. In the browser, you can
visualize the XGMI and PCIe metrics.
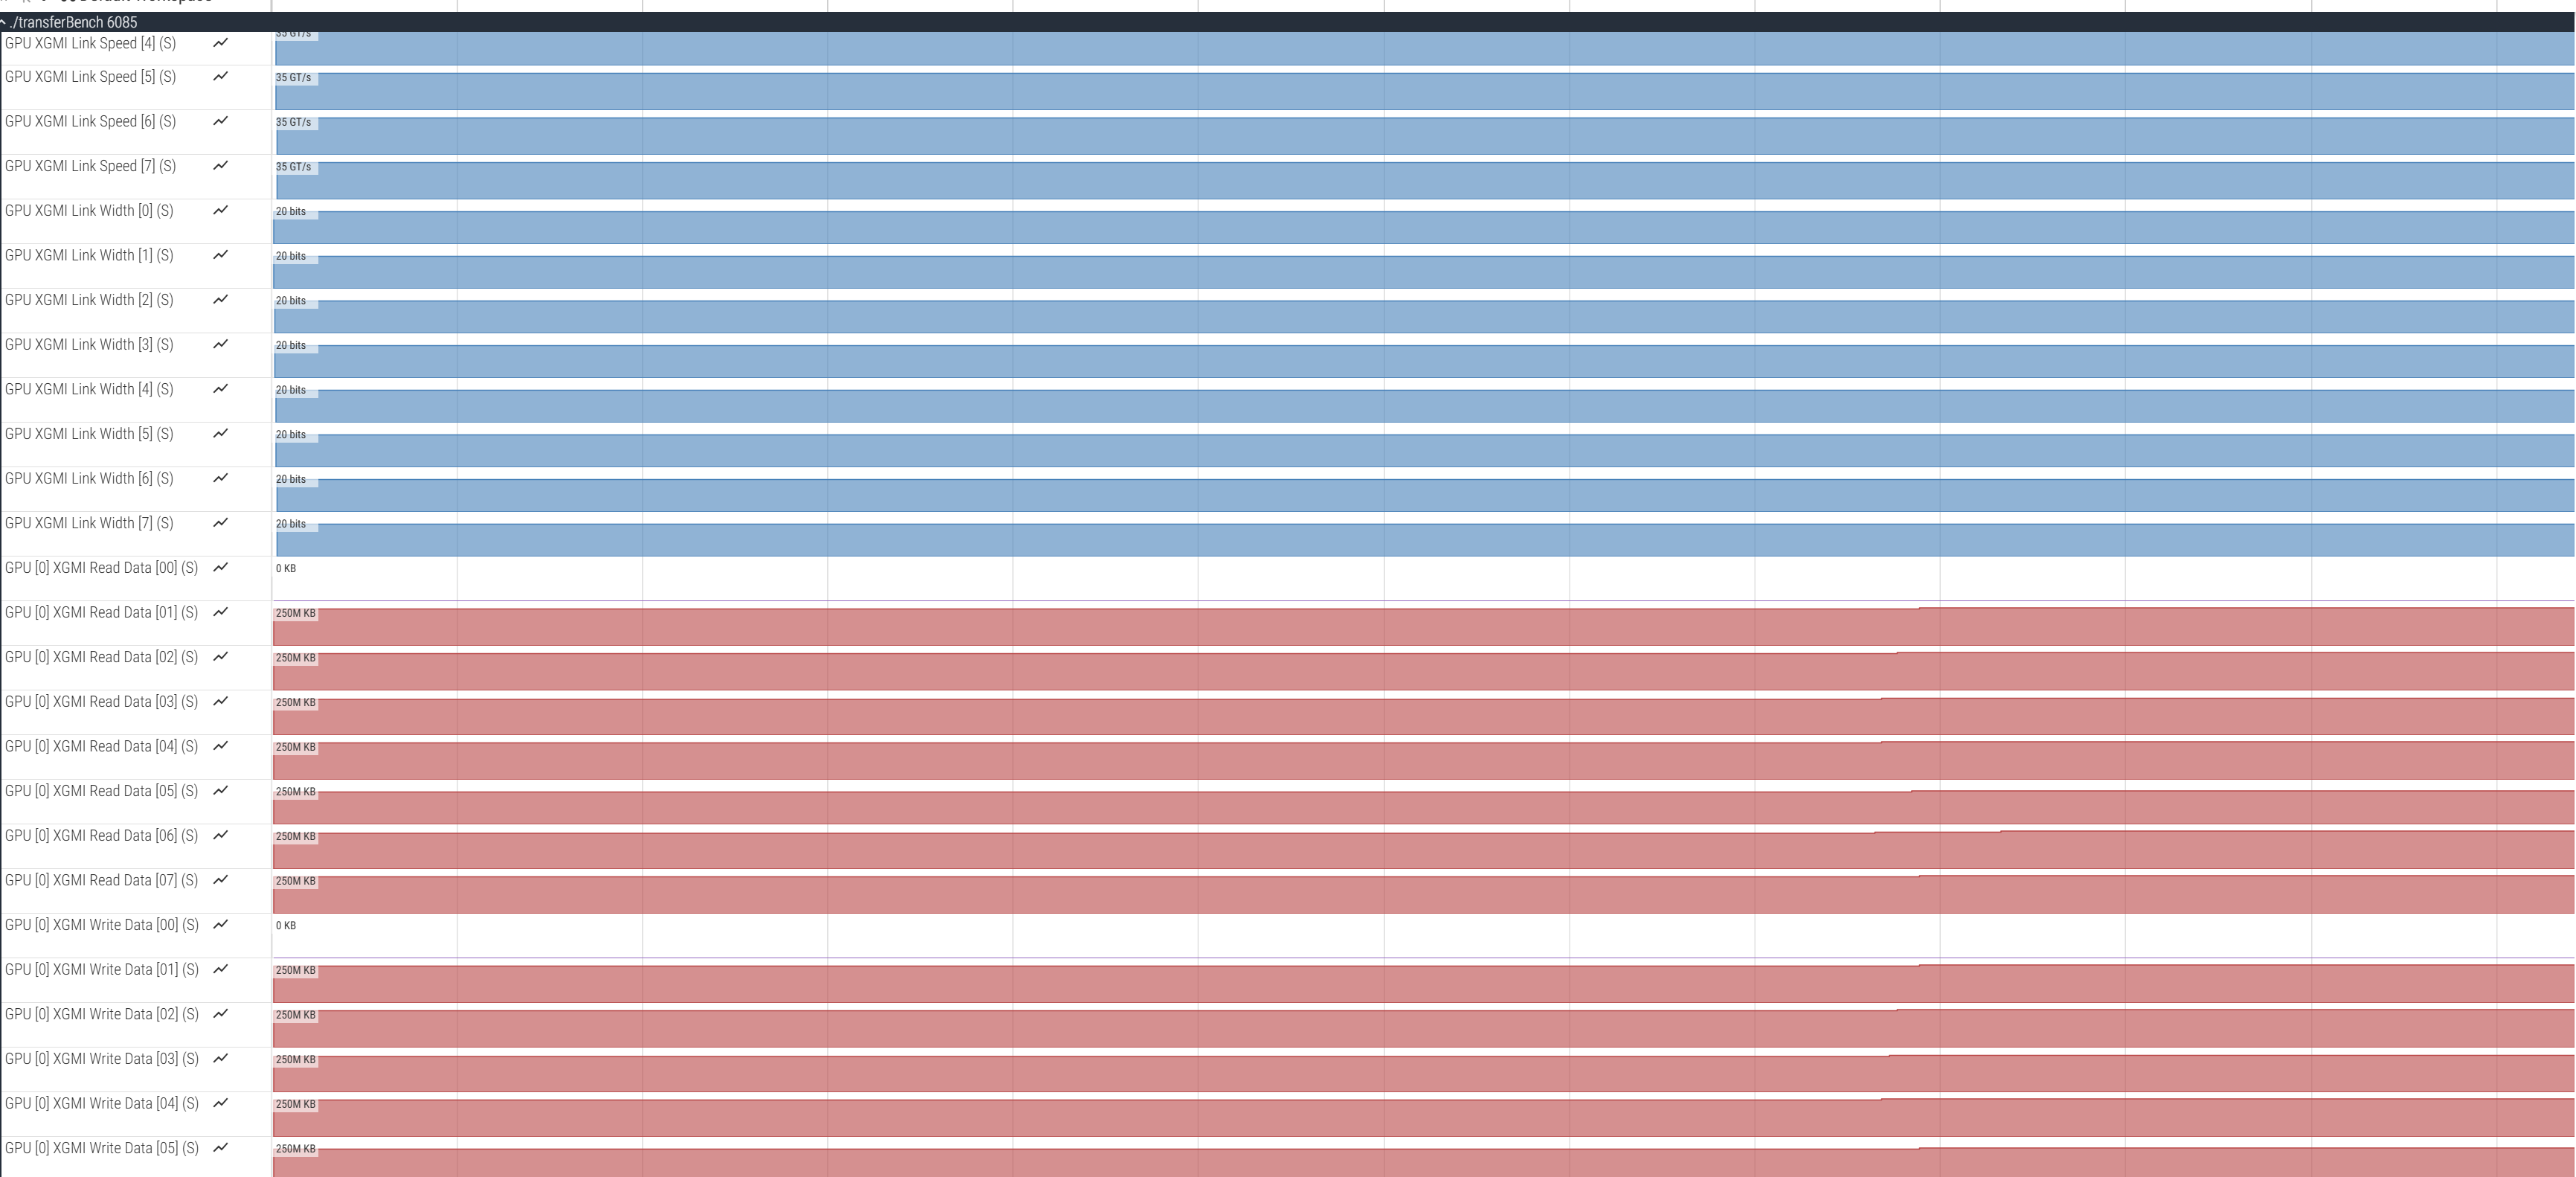
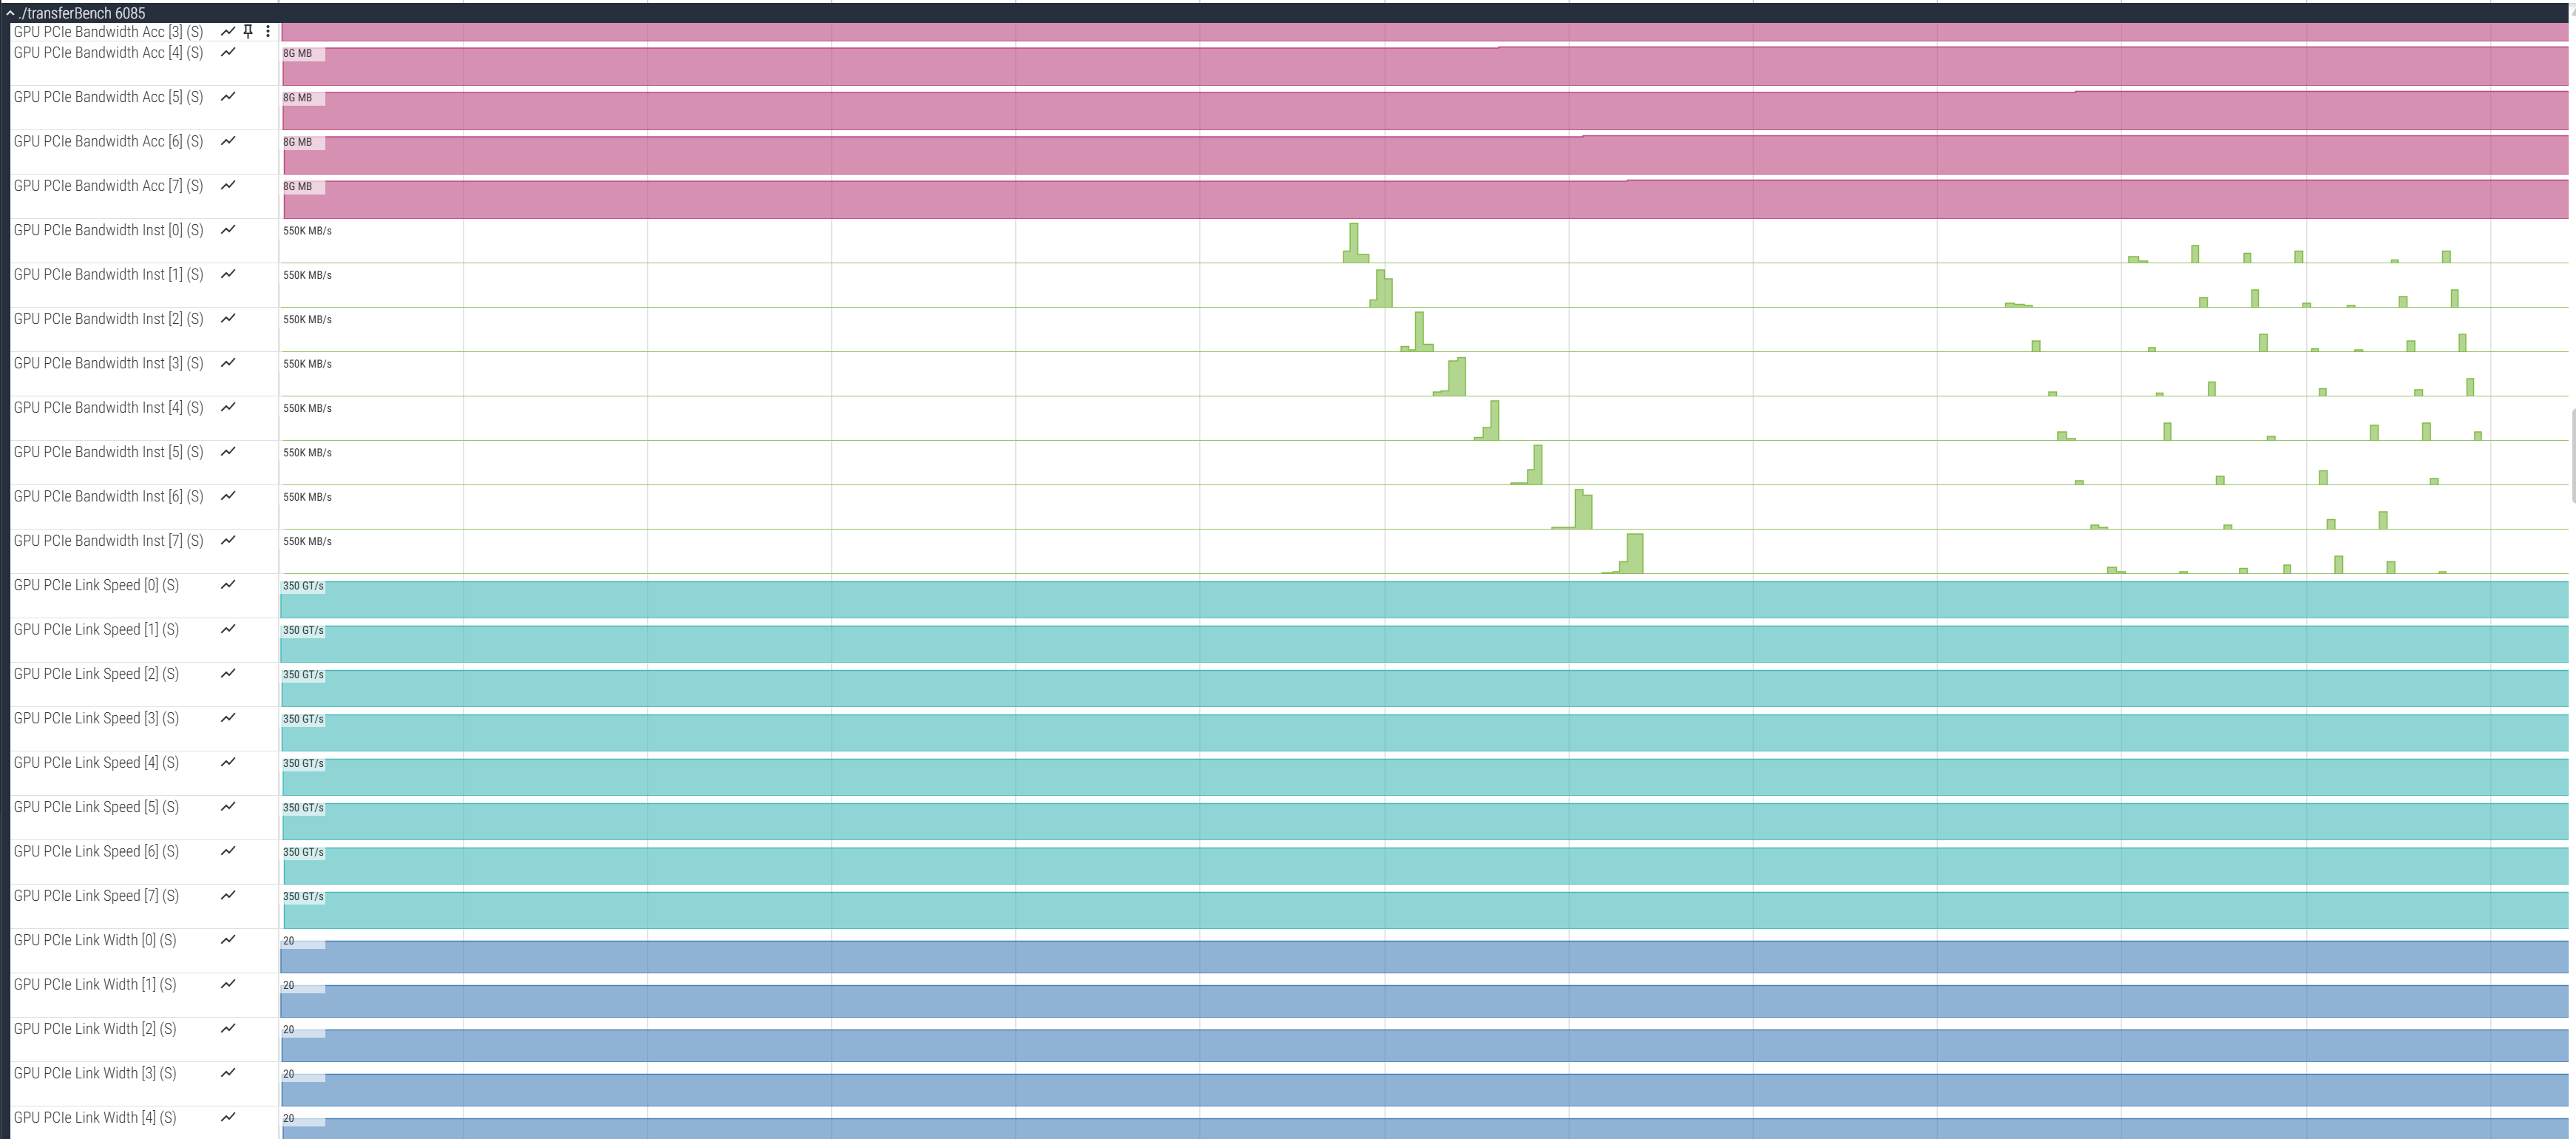
The visualization will show:
XGMI Read Data and XGMI Write Data tracks showing data transfer through XGMI links over time
XGMI Link Width and XGMI Link Speed tracks showing link configuration
PCIe Bandwidth tracks showing CPU-to-GPU data transfer rates
PCIe Link Width and PCIe Link Speed tracks showing PCIe link configuration
Using the sdma-test example for testing#
The sdma-test on GitHub tree contains the example that drives Host-to-Device, Device-to-Device, and Device-to-Host async copies so you can observe SDMA utilization alongside HIP memory-copy tracing. Build instructions, CLI flags (transfer size, iterations, infinite mode), and additional environment options are documented in the sdma-test README on GitHub.
Source the ROCm Systems Profiler environment:
source /opt/rocprofiler-systems/share/rocprofiler-systems/setup-env.sh
Alternatively, if you are using modules, use:
module use /opt/rocprofiler-systems/share/modulefiles
Generate and point to a config file, then edit
.rocprofsys.cfgwith settings such as:
rocprof-sys-avail -G $HOME/.rocprofsys.cfg -F txt
export ROCPROFSYS_CONFIG_FILE=$HOME/.rocprofsys.cfg
ROCPROFSYS_USE_AMD_SMI     = true
ROCPROFSYS_AMD_SMI_METRICS = busy,temp,power,mem_usage,sdma_usage
ROCPROFSYS_ROCM_DOMAINS    = hip_runtime_api,memory_copy
Build
sdma-test(see the sdma-test README on GitHub), then profile it, for example:
rocprof-sys-run -- ./sdma-test -s 512 -n 5
Open the resulting Perfetto trace as described above; when sdma_usage is supported on
your system, look for SDMA usage / device SDMA utilization tracks in addition to HIP
memory-copy activity.

Tips for effective profiling#
Multi-GPU workloads: XGMI metrics are most useful when profiling applications that use multiple GPUs and transfer data between them.
Sampling frequency: Adjust the sampling frequency using
ROCPROFSYS_PROCESS_SAMPLING_FREQ(default is 50Hz) to capture more or fewer samples based on your analysis needs.Focus on specific metrics: If you only need XGMI, PCIe, or SDMA metrics, you can specify just those:
ROCPROFSYS_AMD_SMI_METRICS=xgmi  # Only XGMI metrics
ROCPROFSYS_AMD_SMI_METRICS=pcie  # Only PCIe metrics
ROCPROFSYS_AMD_SMI_METRICS=sdma_usage  # Only SDMA usage
Combine with API tracing: For detailed analysis, combine XGMI, PCIe, or SDMA metrics with HIP/HSA API tracing to correlate data transfers with application behavior:
ROCPROFSYS_ROCM_DOMAINS=hip_runtime_api,memory_copy,kernel_dispatch,hsa_api
Exploring available metrics#
To explore all supported metrics and domains, use the following commands:
rocprof-sys-avail --all                    # Show all available options
rocprof-sys-avail -bd -r AMD_SMI_METRICS   # Show AMD SMI metrics
rocprof-sys-avail -bd -r ROCM_DOMAINS      # Show ROCm tracing domains
For more details on ROCm Systems Profiler configuration, refer to the configuration guide.