What is ROCm Systems Profiler?#
ROCm Systems Profiler (rocprofiler-systems) is a system-level profiler for applications running on the CPU or the CPU and GPU. Using dynamic binary instrumentation, call-stack sampling, and other techniques, it captures HIP/HSA APIs, kernel dispatches, memory copies, RCCL, and GPU telemetry (temperature, power, utilization, interconnect) on one timeline, down to the function and line number currently executing. It also correlates this GPU-side data with host call stacks, MPI, OpenMP, and Python activity, so you can see why the device is busy, stalled, or waiting.
For example, in a distributed training job, the GPU can appear idle not because its kernels are slow, but because a data loader is starved, an MPI collective is blocking, or Python’s GIL is stalling the dispatch queue.
This topic orients you to how ROCm Systems Profiler is put together and how to invoke it. For the full, categorized feature catalog and use cases, see ROCm Systems Profiler features and use cases.
How it works#
ROCm Systems Profiler couples GPU kernel dispatches, memory copies, and device telemetry with the host-side activity around them. GPU data is captured via ROCprofiler-SDK callbacks and amd-smi polling; host call stacks, MPI, OpenMP, and Python frames are captured via binary instrumentation, statistical sampling, callback APIs, or symbol interception. Everything is merged into a single trace/profile output, correlated on the GPU timeline.
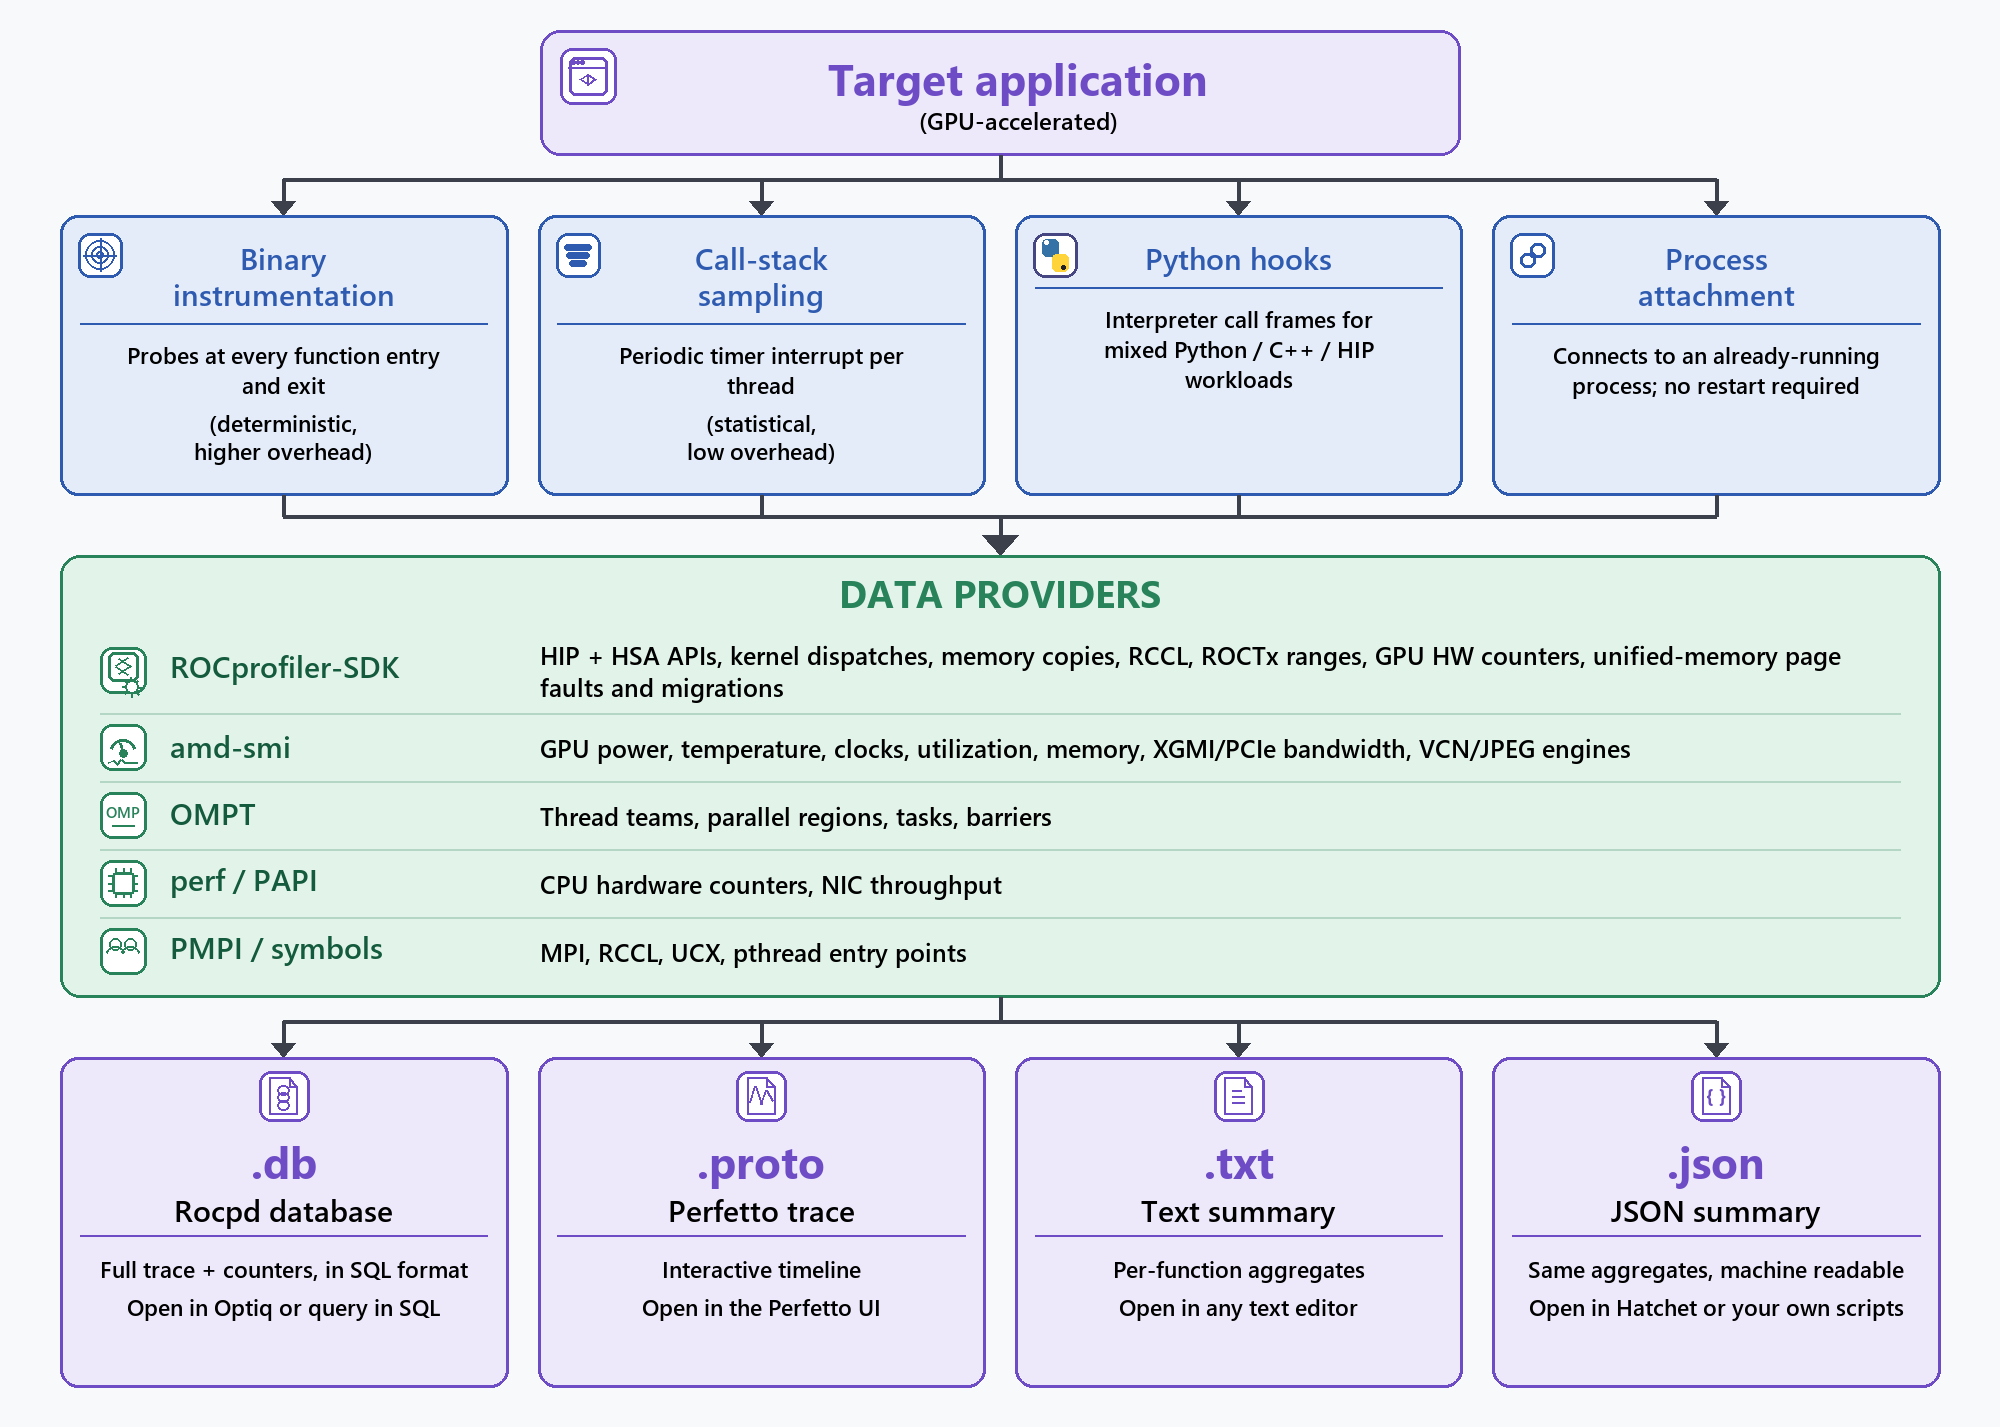
For the full explanation of each collection mode, including overhead trade-offs and a worked instrumentation-vs-sampling example, see Data collection modes.
Capabilities#
The feature set is spread across several how-to and conceptual pages; the following tables are a quick index into them:
Tracing#
Feature |
Description |
See also |
|---|---|---|
ROCm API tracing |
Traces ROCm API and runtime domains via ROCprofiler-SDK, including HIP, HSA, ROCTx, RCCL, kernel dispatches, memory events, rocDecode, and rocJPEG. List available domains with |
|
MPI and communication tracing |
Records collective and point-to-point operation timing with per-rank attribution across MPI (via standard PMPI wrappers), RCCL, UCX, and OpenSHMEM/rocSHMEM. |
|
OpenMP tracing |
Captures thread team creation, parallel regions, task execution, and synchronization via the OMPT callback interface. |
|
Unified memory |
Tracks page faults and host/device migrations for HIP managed memory (KFD). |
Metrics#
Feature |
Description |
See also |
|---|---|---|
GPU telemetry |
Samples GPU temperature, power, utilization, clocks, memory, XGMI/PCIe bandwidth, and VCN/JPEG engine activity via |
GPU metrics, XGMI, PCIe, and SDMA metrics sampling and monitoring, VCN and JPEG activity sampling and tracing |
GPU hardware counters |
Collects GPU hardware counters (occupancy, VALU utilization, wavefront counts, etc.) via |
|
CPU hardware counters |
Reads IPC, cache misses, branch mispredictions, and other CPU PMU events via the Linux |
|
Network (NIC) metrics |
Samples NIC throughput and errors (PAPI); AINIC where supported. |
Collection mechanism (host-side correlation)#
Feature |
Description |
See also |
|---|---|---|
Binary instrumentation |
Inserts probes at selected function entry/exit with no source changes (runtime instrumentation or binary rewrite). Complete, deterministic host call-stack data. |
|
Call-stack sampling |
Periodically interrupts the application and records the host call stack (and related metrics). Lower-overhead statistical data to correlate with the GPU timeline. |
|
Python hooks |
Instruments Python interpreter call frames for mixed Python/C++/HIP workload analysis. |
|
Process attachment |
Attaches to an already-running process without restarting it. |
Analysis#
Feature |
Description |
See also |
|---|---|---|
Trace |
Event timeline of GPU APIs, kernels, copies, and correlated host activity. Default analysis mode. |
Data collection modes, Understanding the Systems Profiler output |
Profile |
High-level summary profiles with statistical aggregations (mean, min, max, stddev) per function. Lower overhead than a full timeline; JSON and text outputs are generated. |
|
Causal profiling |
Estimates the end-to-end speedup from optimizing a given function or line by selectively slowing other code regions. |
Binary instrumentation vs. call-stack sampling#
Binary instrumentation and call-stack sampling can be used independently or together, trading overhead against completeness:
Mode |
Overhead |
Best for |
|---|---|---|
Binary instrumentation |
Higher |
Function-level profiling of selected functions when complete, deterministic call data is needed and the added overhead is acceptable. |
Call-stack sampling |
Low |
Whole application context at low overhead. For example, long-running jobs, MPI workloads, etc. |
Combined (both enabled) |
Higher than sampling alone |
Enable statistical sampling after binary instrumentation to help “fill in the gaps” between instrumented regions. |
To use ROCm Systems Profiler for instrumentation, follow these two configuration steps:
Indicate the functions and modules to instrument in the target binaries, including the executable and any libraries.
Specify the instrumentation parameters to use when the instrumented binaries are launched.
Command-line tools#
ROCm Systems Profiler ships as a set of standalone executables, each oriented toward a different profiling workflow.
rocsys is the unified entry point that dispatches to these tools. See Using the rocsys command.
Tool |
Purpose |
Example |
See also |
|---|---|---|---|
|
Dispatches a subcommand to the tool for that workflow. |
|
|
|
Lists what is available to configure and collect on your system (settings, domains, counters, components). |
|
|
|
Performs dynamic binary instrumentation, including binary rewriting. |
|
|
|
Launches a binary-rewritten executable, or profiles an application directly using preset/domain flags. |
|
Instrumenting and rewriting a binary application, Quick start |
|
Performs call-stack sampling without instrumentation. |
|
|
|
Attaches to an already-running process. |
|
|
|
Performs causal profiling to estimate optimization impact. |
|
Preset profiles#
Presets replace manually setting numerous environment variables with a single --preset flag available on rocprof-sys-run and rocprof-sys-sample. Presets were introduced in ROCm 7.12 and expanded into an extensible JSON-based system in ROCm 7.13.
Discover, inspect, and apply a preset as follows:
List available presets:
rocprof-sys-run --list-presetsSee what a preset configures:
rocprof-sys-run --explain=balanced
Run with the preset (
balancedis a good starting point):rocprof-sys-run --preset=balanced -- ./my_app
Optionally, combine the preset with domain flags for finer control:
rocprof-sys-run --preset=balanced --gpu=temp,power -- ./my_app
Each built-in preset enables a different combination of tracing, profiling, sampling, and domains, tuned for a specific workload scenario:
Category |
Presets |
Best for |
See also |
|---|---|---|---|
General |
|
Most profiling scenarios; minimal-overhead production profiling; in-depth full-system analysis |
|
GPU and workload |
|
GPU device activity; AI/ML, HPC, and GPU-accelerated training; hardware counter collection |
|
HPC |
|
MPI/OpenMP/Kokkos applications; OpenMP target offload; MPI communication latency analysis |
|
API tracing |
|
Full system API visibility; runtime-only API tracing |
For the exact configuration behind a preset, run rocprof-sys-run --explain=<name>. For domain flags, configuration export, and custom presets, see Using preset profiles and domain flags.
Output formats#
ROCm Systems Profiler supports several output formats, each suited to a different analysis or visualization workflow. rocpd is the default output format.
Format |
File extension |
Description |
Viewer |
|---|---|---|---|
ROCm Profiling Data (rocpd) |
|
Detailed trace and counter data stored as a SQLite3 database; queryable with SQL or convertible to other formats via |
|
Perfetto (pftrace) |
|
Detailed trace stored as a protocol buffer for interactive timeline visualization |
|
Text |
|
Aggregated results (mean, min, max, stddev per function) as human-readable text |
Text editor |
JSON |
|
Aggregated high-level results for programmatic analysis; hatchet-compatible |
Any JSON viewer, hatchet, custom scripts |
Output-format selection differs by tool:
When no
--output-formatis specified,rocprof-sys-runandrocprof-sys-sampleproduce a rocpd (SQLite3 database) trace:rocprof-sys-run -- ./my_app
--output-format(introduced in ROCm 7.14) selects one or more formats explicitly:rocprof-sys-run --output-format pftrace rocpd json text -- ./my_app
rocprof-sys-attachuses its own-Fflag with different token names for the same formats (perfettoinstead ofproto):rocprof-sys-attach -p 12345 -F perfetto,rocpd
For the legacy flags and the environment variables each --output-format token maps to, see Selecting output formats. For output path conventions, metadata, and per-format details, see Understanding the Systems Profiler output.