Network performance profiling#
ROCm Systems Profiler supports network performance profiling. It can be performed using two methods:
Sampling conventional NIC metrics using PAPI#
Network performance profiling for conventional network interfaces that support TCP/IP is done using Performance Application Programming Interface (PAPI). This method profiles standard network events. You can sample the events based on standard network interface counters. Follow the steps to list all the network events, sample them using configuration parameters, instrument and run the generated binary, and visualize the Perfetto trace.
List available network events#
List all the network events that can be traced on the system by running the command:
rocprof-sys-avail -H -r net
For example, if the name of system’s NIC is enp7s0, the output is:
|-------------------------------|---------|-----------|-------------------------------|
|       HARDWARE COUNTER        | DEVICE  | AVAILABLE |            SUMMARY            |
|-------------------------------|---------|-----------|-------------------------------|
| net:::enp7s0:rx:byte          |   CPU   |   true    | enp7s0 receive byte           |
| net:::enp7s0:rx:packet        |   CPU   |   true    | enp7s0 receive packet         |
| net:::enp7s0:rx:error         |   CPU   |   true    | enp7s0 receive error          |
| net:::enp7s0:rx:droppe        |   CPU   |   true    | enp7s0 receive droppe         |
| net:::enp7s0:rx:fif           |   CPU   |   true    | enp7s0 receive fif            |
| net:::enp7s0:rx:fram          |   CPU   |   true    | enp7s0 receive fram           |
| net:::enp7s0:rx:compresse     |   CPU   |   true    | enp7s0 receive compresse      |
| net:::enp7s0:rx:multicas      |   CPU   |   true    | enp7s0 receive multicas       |
| net:::enp7s0:tx:byte          |   CPU   |   true    | enp7s0 transmit byte          |
| net:::enp7s0:tx:packet        |   CPU   |   true    | enp7s0 transmit packet        |
| net:::enp7s0:tx:error         |   CPU   |   true    | enp7s0 transmit error         |
| net:::enp7s0:tx:droppe        |   CPU   |   true    | enp7s0 transmit droppe        |
| net:::enp7s0:tx:fif           |   CPU   |   true    | enp7s0 transmit fif           |
| net:::enp7s0:tx:coll          |   CPU   |   true    | enp7s0 transmit coll          |
| net:::enp7s0:tx:carrie        |   CPU   |   true    | enp7s0 transmit carrie        |
| net:::enp7s0:tx:compresse     |   CPU   |   true    | enp7s0 transmit compresse     |
|-------------------------------|---------|-----------|-------------------------------|
Configure the parameters#
To track bytes and packets sent and received by NIC enp7s0, configure the parameters as follows:
ROCPROFSYS_PAPI_EVENTS = net:::enp7s0:tx:byte net:::enp7s0:rx:byte net:::enp7s0:tx:packet net:::enp7s0:rx:packet
Sample configuration parameter settings look like:
ROCPROFSYS_SAMPLING_FREQ=10
ROCPROFSYS_USE_SAMPLING=ON
ROCPROFSYS_TIMEMORY_COMPONENTS=wall_clock papi_array network_stats
ROCPROFSYS_NETWORK_INTERFACE=enp7s0
ROCPROFSYS_PAPI_EVENTS=net:::enp7s0:tx:byte net:::enp7s0:rx:byte net:::enp7s0:rx:packet net:::enp7s0:tx:packet
PAPI_NET_REFRESH_LATENCY=100000
Details of the configuration parameter settings configured in the example are:
Sampling Frequency: 10 samples per second
TIMEMORY: Outputs the summaries for the
wall_clock,papi_array, andnetwork_statscomponents.Network Interface:
enp7s0is the predictable network interface device name.Events for the network device to be sampled: Bytes transmitted, bytes received, packets transmitted, and packets received.
PAPI_NET_REFRESH_LATENCY: The shortest latency (in microseconds) with which PAPI updates network statistics. The default value is 1000000 (1s).
You can save the configuration parameter settings in a configuration file. For example, rocprofsys.cfg:
ROCPROFSYS_VERBOSE=1
ROCPROFSYS_DL_VERBOSE=1
ROCPROFSYS_SAMPLING_FREQ=10
ROCPROFSYS_SAMPLING_DELAY=0.05
ROCPROFSYS_SAMPLING_CPUS=0-9
ROCPROFSYS_SAMPLING_GPUS=$env:HIP_VISIBLE_DEVICES
ROCPROFSYS_TRACE=ON
ROCPROFSYS_PROFILE=ON
ROCPROFSYS_USE_SAMPLING=ON
ROCPROFSYS_USE_PROCESS_SAMPLING=OFF
ROCPROFSYS_TIME_OUTPUT=OFF
ROCPROFSYS_FILE_OUTPUT=ON
ROCPROFSYS_TIMEMORY_COMPONENTS=wall_clock papi_array network_stats
ROCPROFSYS_USE_PID=OFF
ROCPROFSYS_OUTPUT_PREFIX=foo/
ROCPROFSYS_NETWORK_INTERFACE=enp7s0
ROCPROFSYS_PAPI_EVENTS=net:::enp7s0:tx:byte net:::enp7s0:rx:byte net:::enp7s0:rx:packet net:::enp7s0:tx:packet
PAPI_NET_REFRESH_LATENCY=100000
To specify the configuration file, use the ROCPROFSYS_CONFIG_FILE setting:
ROCPROFSYS_CONFIG_FILE=/path/to/rocprofsys.cfg
This setting defines the location of the ROCm Systems Profiler configuration file.
Note
To collect network counters using Performance Application Programming Interface (PAPI), ensure that
/proc/sys/kernel/perf_event_paranoid has a value <= 2. See
ROCPROFSYS_PAPI_EVENTS for details.
Instrument and run the binary#
Instrument the binary file using the
rocprof-sys-instrumentcommand:
rocprof-sys-instrument -o foo.inst  \
  --log-file mylog.log --verbose --debug \
  "--print-instrumented" "functions" "-e" "-v" "2" "--caller-include" \
  "inner" "-i" "4096" "--" ./foo
This command generates an instrumented binary foo.inst.
Run the instrumented binary using the following command:
rocprof-sys-sample -- ./foo.inst
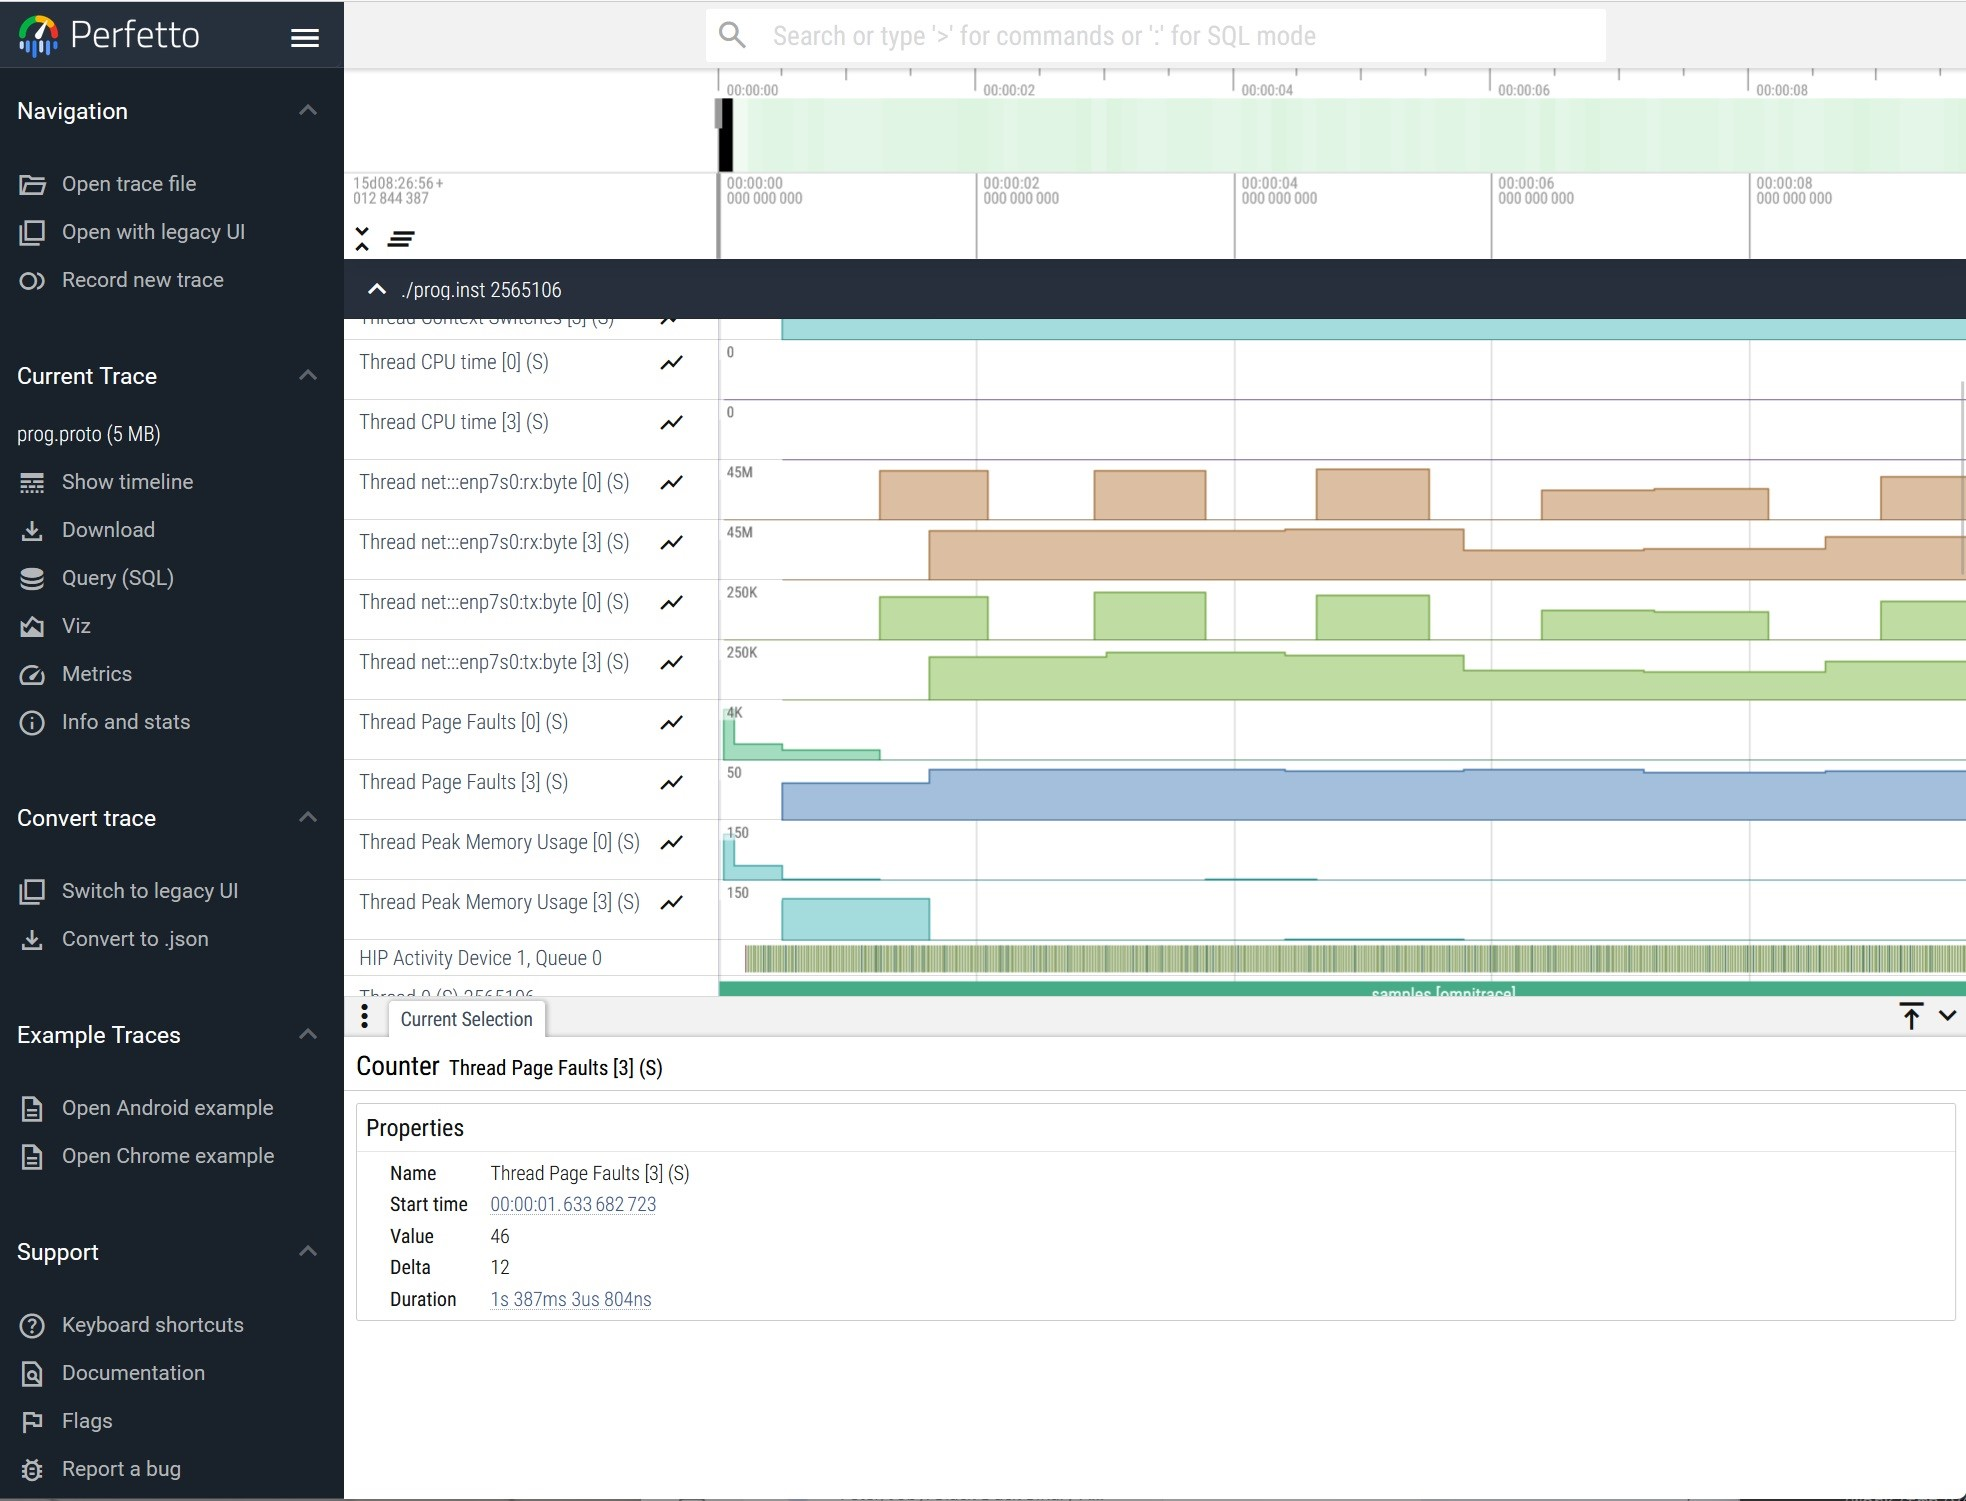
Visualize the event-based profiling results#
To view the generated .proto file in the browser, follow the steps:
Open the Perfetto UI page.
Click
Open trace fileand select the.protofile. In the browser, it looks like:
Sampling AI NIC metrics using amd-smi#
On a host system that has AI network interface cards, ROCm Systems Profiler can track the following metrics:
RX congestion notification packets
TX congestion notification packets
RX unicast bytes
TX unicast bytes
RX unicast packets
TX unicast packets
TX ACK timeout (the count of local ACK timeout errors)
RESP TX PKT SEQ ERROR (the count of packet sequence errors detected by responder)
REQ RX PKT SEQ ERROR (the count of packet sequence errors detected by requester)
REQ RX IMPL NAK SEQ ERROR (the count of ACK packets with invalid PSN detected by requester)
AI NIC support in ROCm Systems Profiler#
AI NIC interfaces support the Remote Direct Memory Access (RDMA) standard. RDMA enables one computer to access another computer’s memory directly, without operating-system involvement. This capability provides high-throughput, low‑latency data transfer, which is needed for large-scale clusters and high-performance networking. You can measure AI NIC network performance by using amd-smi. By default, AI NIC support is enabled in ROCm Systems Profiler. However, you can disable it by setting:
-D ROCPROFSYS_USE_AINIC=OFF
List available AI NICs#
List all the available AI NICs with their unique identifiers by running amd-smi list:
$ sudo amd-smi list
AI_NIC: 0
    BDF: 0000:e2:00.0
    PERMANENT_ADDRESS: 04:90:81:2c:77:b0
    PRODUCT_NAME: POLLARA 1x400G QSFP112
    PART_NUMBER: POLLARA-1Q400P
    SERIAL_NUMBER: FPL250300A1EC0V2
    VENDOR_NAME: AMD Pensando Systems, Inc.
List the NETDEV name and more details of each available AI NIC by running amd-smi static:
$ sudo amd-smi static
AI_NIC: 0
    NIC:
...
        RDMA_DEVICES:
            RDMA_DEVICE_0:
                NAME: rocep229s0
                NODE_GUID: 0690:81ff:fe2c:77b0
                NODE_TYPE: CA
                SYS_IMAGE_GUID: 0690:81ff:fe2c:77b0
                FW_VER: 1.110.1-a-1
                PORT_0:
                    NETDEV: enp229s0
                    PORT_NUM: 1
                    STATE: DOWN
                    MAX_MTU: N/A
                    ACTIVE_MTU: N/A
From this output, use the NETDEV value (here, enp229s0) as the name of
the AI NIC.
Sampling the AI NICs#
After the AI NIC support is enabled, specify the names of the AI NICs for which you want
to track the values. For example, if the host has an AI NIC named enp229s0 there are multiple options to track its performance:
Option 1: Set
ROCPROFSYS_SAMPLING_AINICSin the configuration file.Example:
ROCPROFSYS_SAMPLING_AINICS=enp229s0
Option 2: Set
ROCPROFSYS_SAMPLING_AINICSas an environment variable.Example:
export ROCPROFSYS_SAMPLING_AINICS=enp229s0
Option 3: Pass
--ai-nicstorocprof-sys-sampleon the command line. (Preferred)Example:
rocprof-sys-sample --ai-nics=enp229s0 -- <your command>
If you use
rocprof-sys-sampleto profile the AI NIC interfaceenp229s0while running the commandwget -O /dev/null --no-check-certificate https://example.com, the full command is:rocprof-sys-sample --ai-nics=enp229s0 --device -- \ wget -O /dev/null --no-check-certificate https://example.com
If you want to track multiple NICs on the host, provide them as a comma-separated list:
rocprof-sys-sample --ai-nics=enp229s0,enp229s1 --device -- \ wget -O /dev/null --no-check-certificate https://example.com
The value of the
--ai-nicsparameter can also be:all: tracking all NICs available on the host.
none: not tracking any NICs.
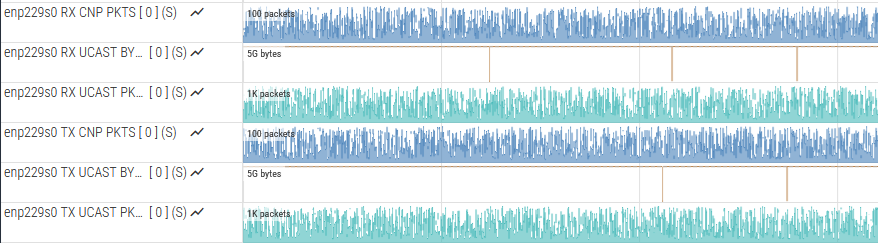
Visualize the AI NIC profiling results#
To view the .proto file generated by rocprof-sys-sample in the browser, follow the steps :
Open the Perfetto UI page.
Click
Open trace fileand select the.protofile. The tracks for AI NIC in the generated.protofile look like:
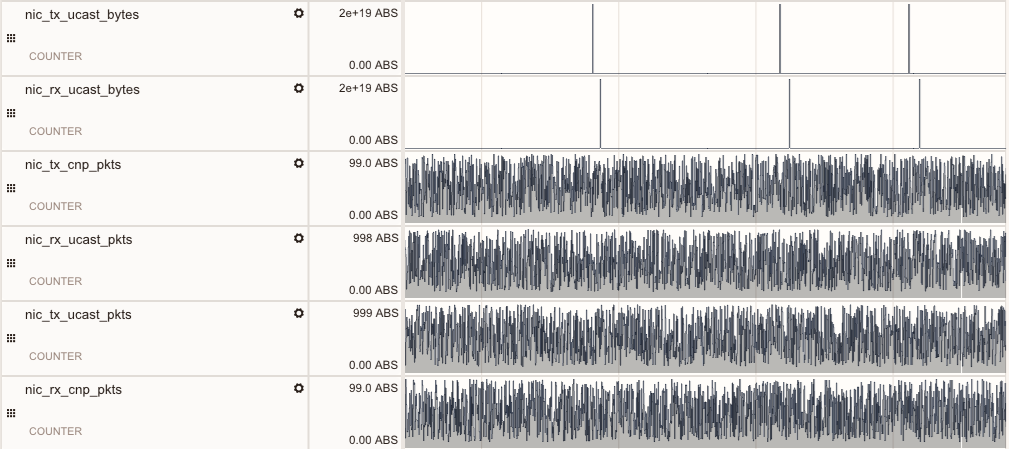
Save the profiling output to rocpd#
To save the output to rocpd, follow the steps:
Set the environment variable
ROCPROFSYS_USE_ROCPDtoON.export ROCPROFSYS_USE_ROCPD=ON
Run
rocprof-sys-sampleas described above in Option 3. This generates a.dbfile, for examplerocpd-2594634.db.
You can view the generated file in ROCm Optiq. The AI NIC tracks look like this: