OpenMP performance profiling#
ROCm Systems Profiler supports profiling OpenMP programs starting with ROCm 6.4.0.
It captures OpenMP performance data by intercepting callbacks from the OpenMP Tools Interface (OMPT). It uses ROCprofiler-SDK to perform this interception. ROCm 6.4.0 is the minimum required version, as this release introduced OMPT support in ROCprofiler-SDK.
ROCm Systems Profiler processes only a subset of OMPT callbacks. The list of supported callbacks can be viewed by running the following command:
rocprof-sys-avail --list-operations ompt
Note
On versions prior to ROCm 7.14, --list-operations ompt is not available.
The list of supported callbacks can instead be obtained by generating a
configuration file with:
rocprof-sys-avail -G config.cfg --categories settings::rocprofiler-sdk --all --advanced
After the configuration file config.cfg is generated, inspect the ROCPROFSYS_ROCM_OMPT_OPERATIONS entry.
Profiling a Fortran program that uses GPU offloading#
Tip
These steps also apply to C and C++ programs.
This sample steps uses the jacobi-fortran-targetdata-markers example.
Building the example#
This example uses the amdflang Fortran compiler.
Clone the
rocm-systemsrepository and sparse checkout the necessary examples:git clone --no-checkout --filter=blob:none --depth=1 --branch develop https://github.com/ROCm/rocm-systems.git cd rocm-systems git sparse-checkout init --cone git sparse-checkout set projects/rocprofiler-systems/examples git checkout develop
Build only the
jacobi-fortran-targetdata-markersexample:rm -rf build-hpc cmake -S projects/rocprofiler-systems/examples/hpc \ -B build-hpc \ -DCMAKE_PREFIX_PATH=/opt/rocm cmake --build build-hpc --target jacobi-fortran-targetdata-markers export JACOBI_FORTRAN_BIN=$PWD/build-hpc/jacobi-fortran-targetdata-markers/jacobi-fortran-targetdata-markers cd ..
The resulting binary is at rocm-systems/build-hpc/jacobi-fortran-targetdata-markers/jacobi-fortran-targetdata-markers.
Note
This example requires the hipfort Fortran module file
(hipfort.mod). Install it through the hipfort-dev package on
Debian/Ubuntu or the hipfort-devel package on RHEL/Rocky/SLES.
Collecting a trace with rocprof-sys-run#
Callback APIs, such as OMPT, can be traced using rocprof-sys-run with the --preset=trace-openmp option.
To collect a trace for the Jacobi example, run the following command:
rocprof-sys-run --preset=trace-openmp -- "$JACOBI_FORTRAN_BIN"
Note
--preset=trace-openmprequires ROCm 7.13.0 or later. On earlier versions, use the Environment variable configuration.Once the command completes, an output directory will be generated:
rocprofsys-jacobi-fortran-targetdata-markers-output/<timestamp>/
By default, a
.prototrace file containing all captured traces from the profiling session is written under this directory.
For more information about presets, see Using preset profiles.
Understanding the proto file output#
To view the generated .proto file in a browser, open the Perfetto UI page. Then, click on Open trace file and select the .proto file.
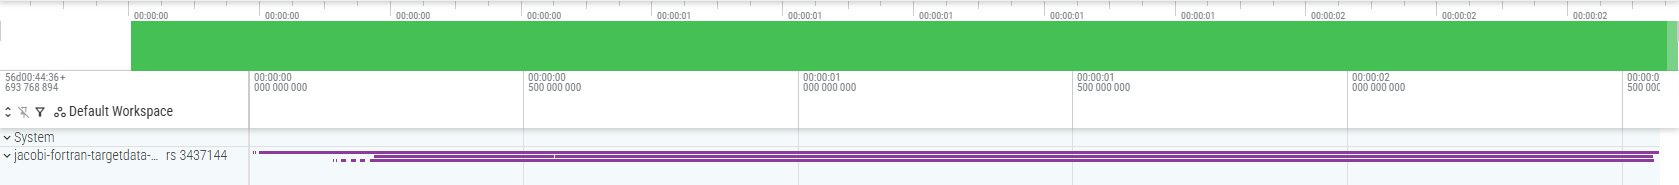
The output trace should resemble the following image:
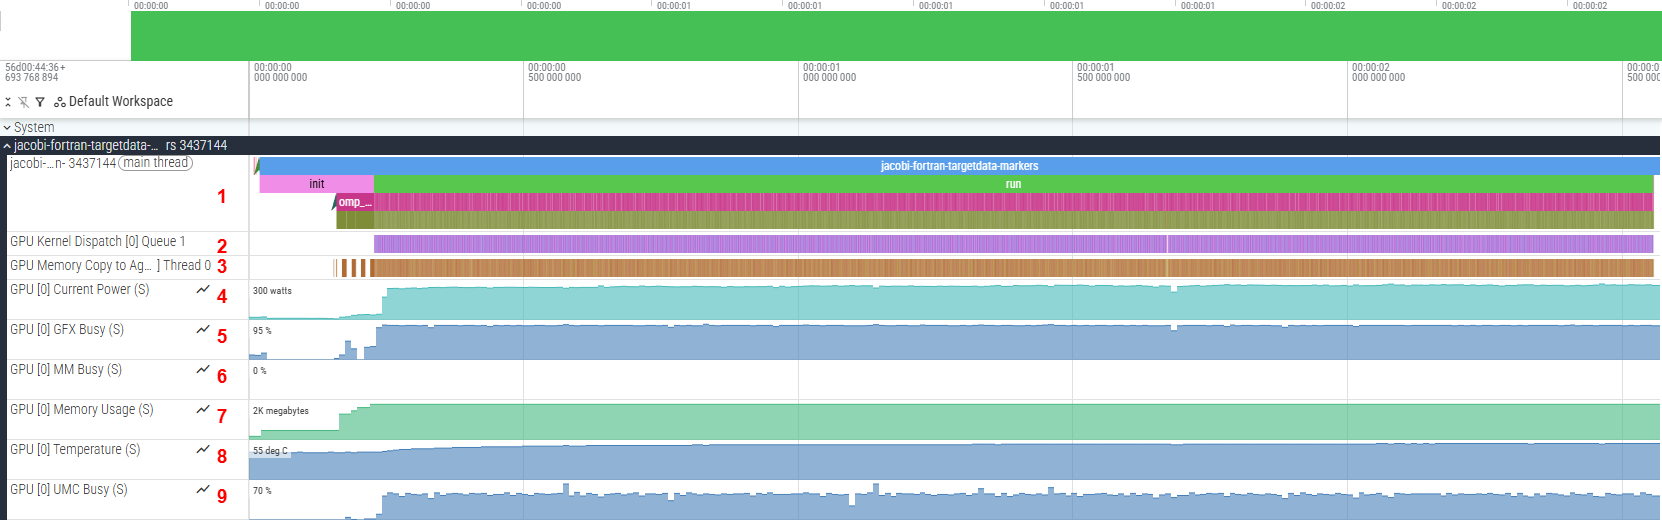
To view the collected traces, click on the drop-down arrow in the jacobi-fortran-targetdata-markers track. You will then be able to see the full trace, which should resemble:
Tip
You can pin important tracks in Perfetto by hovering over the track name and clicking the pin icon.
Multiple tracks are displayed, each representing different information, such as (in the numbering order from the screenshot):
Events captured on the main thread. The main program is executed here (represented by the trace labelled
jacobi-fortran-targetdata-markers).GPU kernel executions.
Memory copy operations between agents (CPU/GPU).
Power being used by the GPU.
Graphics engine utilization (in percentage).
Multimedia engine activity (in percentage).
VRAM consumption.
GPU temperature (in Celsius).
Memory controller utilization (in percentage).
For this example, the important tracks are jacobi-fortran-targetdata-markers (1), GPU Kernel Dispatch (2), and GPU Memory Copy to Agent (3).
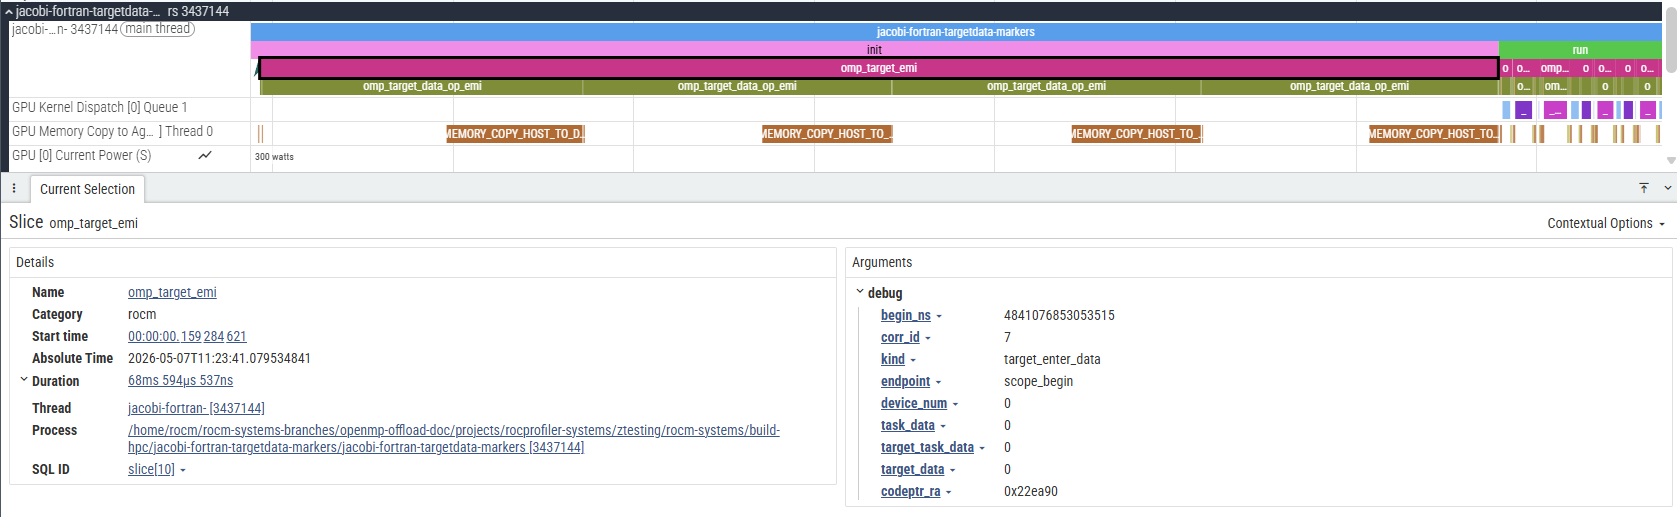
Tip
Certain events have extra information attached to them which can be viewed by selecting the event and looking at its details and argument fields:
Visualizing data transfer and kernel execution on the GPU#
In this program, there are specific OpenMP constructs that offload compute to the GPU. As an example, consider the laplacian subroutine
in laplacian.f90 which contains the following OpenMP code block:
!$omp target teams distribute parallel do collapse(2)
do j = 2,mesh%n_y-1
    do i = 2,mesh%n_x-1
    au(i,j) = (-u(i-1,j)+2._RK*u(i,j)-u(i+1,j))*invdx2 &
            + (-u(i,j-1)+2._RK*u(i,j)-u(i,j+1))*invdy2
    end do
end do
This OpenMP construct offloads the loop to the GPU. Due to the nature of the program, this specific kernel code is executed many times.
The easiest way to locate the events linked to the execution of this code is to find the corresponding kernel dispatch in the GPU Kernel Dispatch track.
For flang based compilers (which includes amdflang), the kernel has the following name:
__omp_offloading_<Device-ID>_<File-ID>_QMlaplacian_modPlaplacian_l22.kd
Device-ID and File-ID are unique for each system. You can ignore these values for this instruction.
In general, for flang compiled code containing modules with subroutines using OpenMP to perform GPU offloading, the kernel’s name will be of the following form:
__omp_offloading_<Device-ID>_<File-ID>_QM<module-Name>P<subroutine-Name>_l<OpenMP-Pragma-Source-Line>[_<Count-ID>].kd
Note
The
<OpenMP-Pragma-Source-Line>is the line number corresponding to the OpenMP pragma in the source code.Count-IDis appended when multiple OpenMP offload constructs exist on the same source line. Since the Jacobi example has only one construct per line,Count-IDis omitted.
The image below shows a group of events that correspond to the execution of the block above:

The general sequence of events for this code block is as follows (in the numbering order from the screenshot):
An
omp_target_emicallback is generated and spans the entire duration of the OpenMPtarget teamsconstruct.Memory is allocated on the GPU for variables. This is represented by an
omp_target_data_op_emievent withoptype = target_data_alloc.The variables are then transferred to the GPU. This is represented by an
omp_target_data_op_emievent withoptype = target_data_transfer_to_device.A corresponding
MEMORY_COPY_HOST_TO_DEVICEis generated in theGPU Memory Copy to Agenttrack for each occurrence of (3).Once the necessary data transfers are complete, the kernel can be launched. An
omp_target_submit_emievent is generated and points to the kernel being executed on the GPU.A corresponding
__omp_offloadingkernel is generated on theGPU Kernel Dispatchtrack for each occurrence of (5), representing the GPU code being executed.Once complete, the data is transferred back to the host. This is represented by an
omp_target_data_op_emievent withoptype = target_data_transfer_from_device.A corresponding
MEMORY_COPY_DEVICE_TO_HOSTis generated in theGPU Memory Copy to Agenttrack for each occurrence of (7).The previously allocated memory is deallocated from the GPU. This is represented by an
omp_target_data_op_emievent withoptype = target_data_delete.
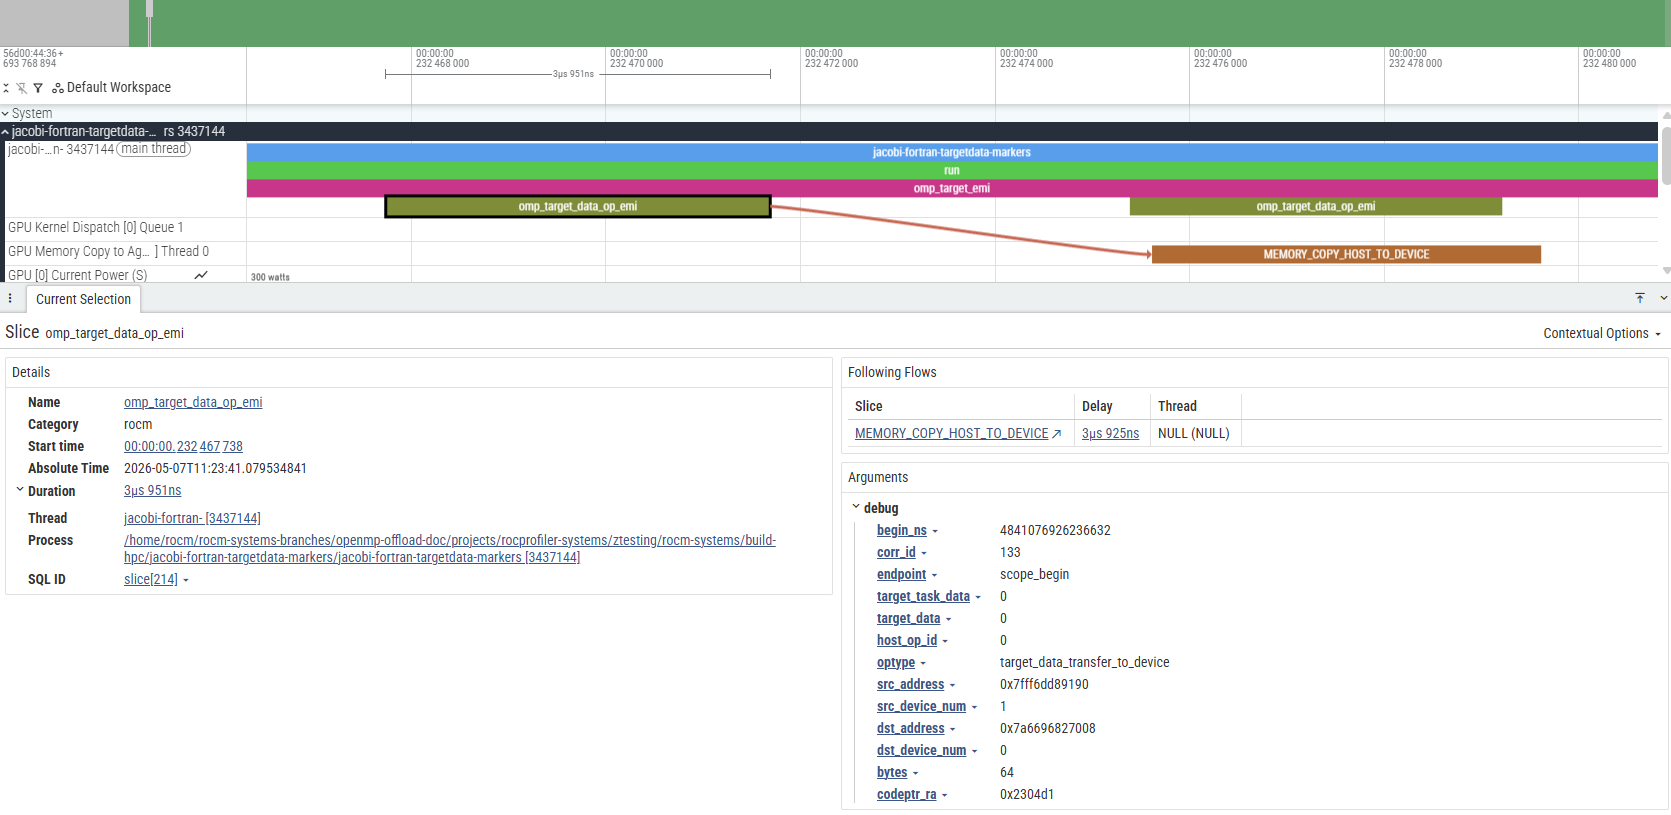
In general, if an event directly relates to another event, an arrow will be generated between the two. These arrows are called “flow events”. A flow event is visible only when an event on a track is selected. For the sake of showing all relations at once, black arrows were inserted in the image above.
The image below shows the standard way that flow events are displayed in Perfetto.
Instrumenting the application with rocprof-sys-instrument#
The application can be instrumented with rocprof-sys-instrument to also capture user-defined functions alongside the OMPT events. Expand for step-by-step instructions:
Optional: Steps for instrumenting the application with rocprof-sys-instrument
Instrument the application to generate an instrumented binary,
jacobi.inst:
rocprof-sys-instrument -o jacobi.inst -- "$JACOBI_FORTRAN_BIN"
Profile the instrumented binary with OMPT tracing enabled:
rocprof-sys-run --preset=trace-openmp -- ./jacobi.inst
Once profiling completes, an output directory will be generated:
rocprofsys-jacobi-inst-output/<timestamp>/
A .proto trace file is written under this directory, and can be viewed using the same method described in the previous section.
Compared to the trace from the preset-only run, the instrumented trace additionally surfaces user-defined functions in the jacobi-fortran-targetdata-markers track,
allowing application-level call paths to be correlated with OMPT and GPU activity.
Important
With rocprof-sys-instrument, data on user-defined functions can be gathered. However, default values on certain settings
may prevent the expected function from being instrumented. For details, see Selective instrumentation section under the Instrumenting and rewriting a binary application guide.
For more details on rocprof-sys-instrument and the data it gathers, see data collection modes.
Environment variable configuration#
The --preset=trace-openmp option requires ROCm 7.13.0 or later. On earlier
versions, use the equivalent environment variables. The environment variables provides more granular control over profiling settings. It can ease the process of integrating profiling into automated scripts, or need to maintain consistent configurations across multiple profiling sessions. Expand for detailed steps to configure the environment variable:
Optional: Configure environment variable
export ROCPROFSYS_USE_OMPT=true  # enable OMPT callback capture
export ROCPROFSYS_TRACE=true     # enable the Perfetto tracing backend (produces the .proto trace)
export ROCPROFSYS_PROFILE=false  # disable the timemory profiling backend (statistical text/JSON summaries)
export ROCPROFSYS_ROCM_DOMAINS=hip_runtime_api,kernel_dispatch,marker_api,memory_copy  # ROCm API domains to trace
Once these are set, rocprof-sys-run can be invoked without --preset:
rocprof-sys-run -- "$JACOBI_FORTRAN_BIN"
Tip
Creating a default configuration file helps maintain consistent profiling settings across sessions. For details, see the Configuring runtime options guide.
Note
If you are interested in seeing how the compiler translates the OpenMP offload
constructs into hsa function calls, you can use either the more detailed
--preset=trace-hpc preset or add hsa_api to ROCPROFSYS_ROCM_DOMAINS.
Because the variable replaces the active domain list, include it alongside the
domains shown above:
export ROCPROFSYS_ROCM_DOMAINS=hip_runtime_api,kernel_dispatch,marker_api,memory_copy,hsa_api