XGMI and PCIe metrics sampling and monitoring#
ROCm Systems Profiler supports sampling of XGMI and PCIe interconnect metrics. It allows you to gather key performance metrics for GPU-to-GPU communication via XGMI links, and CPU-to-GPU communication via PCIe links. This information can be used to optimize multi-GPU workloads, identify communication bottlenecks, and analyze data transfer efficiency in high-performance computing applications.
Sampling support#
Sampling of XGMI and PCIe interconnect metrics is supported by leveraging AMD SMI which provides the interface for GPU metric collection. Follow the steps:
Set the
ROCPROFSYS_USE_AMD_SMIenvironment variable to enable GPU metric collection:
export ROCPROFSYS_USE_AMD_SMI=true
Update the
ROCPROFSYS_AMD_SMI_METRICSvariable to collect the XGMI and PCIe metrics. The default value is:
ROCPROFSYS_AMD_SMI_METRICS=busy,temp,power,mem_usage
To include XGMI and PCIe metrics, update it to:
ROCPROFSYS_AMD_SMI_METRICS=busy,temp,power,mem_usage,xgmi,pcie
Alternatively, you can use the following to collect all available GPU metrics:
ROCPROFSYS_AMD_SMI_METRICS=all
XGMI metrics#
XGMI (AMD Infinity Fabric™ XGMI) provides high-bandwidth, low-latency GPU-to-GPU interconnects in multi-GPU systems. The following XGMI metrics are collected:
XGMI Link Width: The number of active XGMI links between GPUs
XGMI Link Speed: The speed of XGMI links (in GT/s)
XGMI Read Data: Accumulated data read through each XGMI link (in KB)
XGMI Write Data: Accumulated data written through each XGMI link (in KB)
These metrics help identify GPU-to-GPU communication patterns and bandwidth utilization in multi-GPU workloads.
Note
XGMI metrics are only available on systems with multiple GPUs connected via XGMI links. The availability depends on the system topology and GPU architecture. If unsupported or not available, the values will be reported as N/A in the output.
PCIe metrics#
PCIe (PCI Express) provides the connection between the CPU and GPU. The following PCIe metrics are collected:
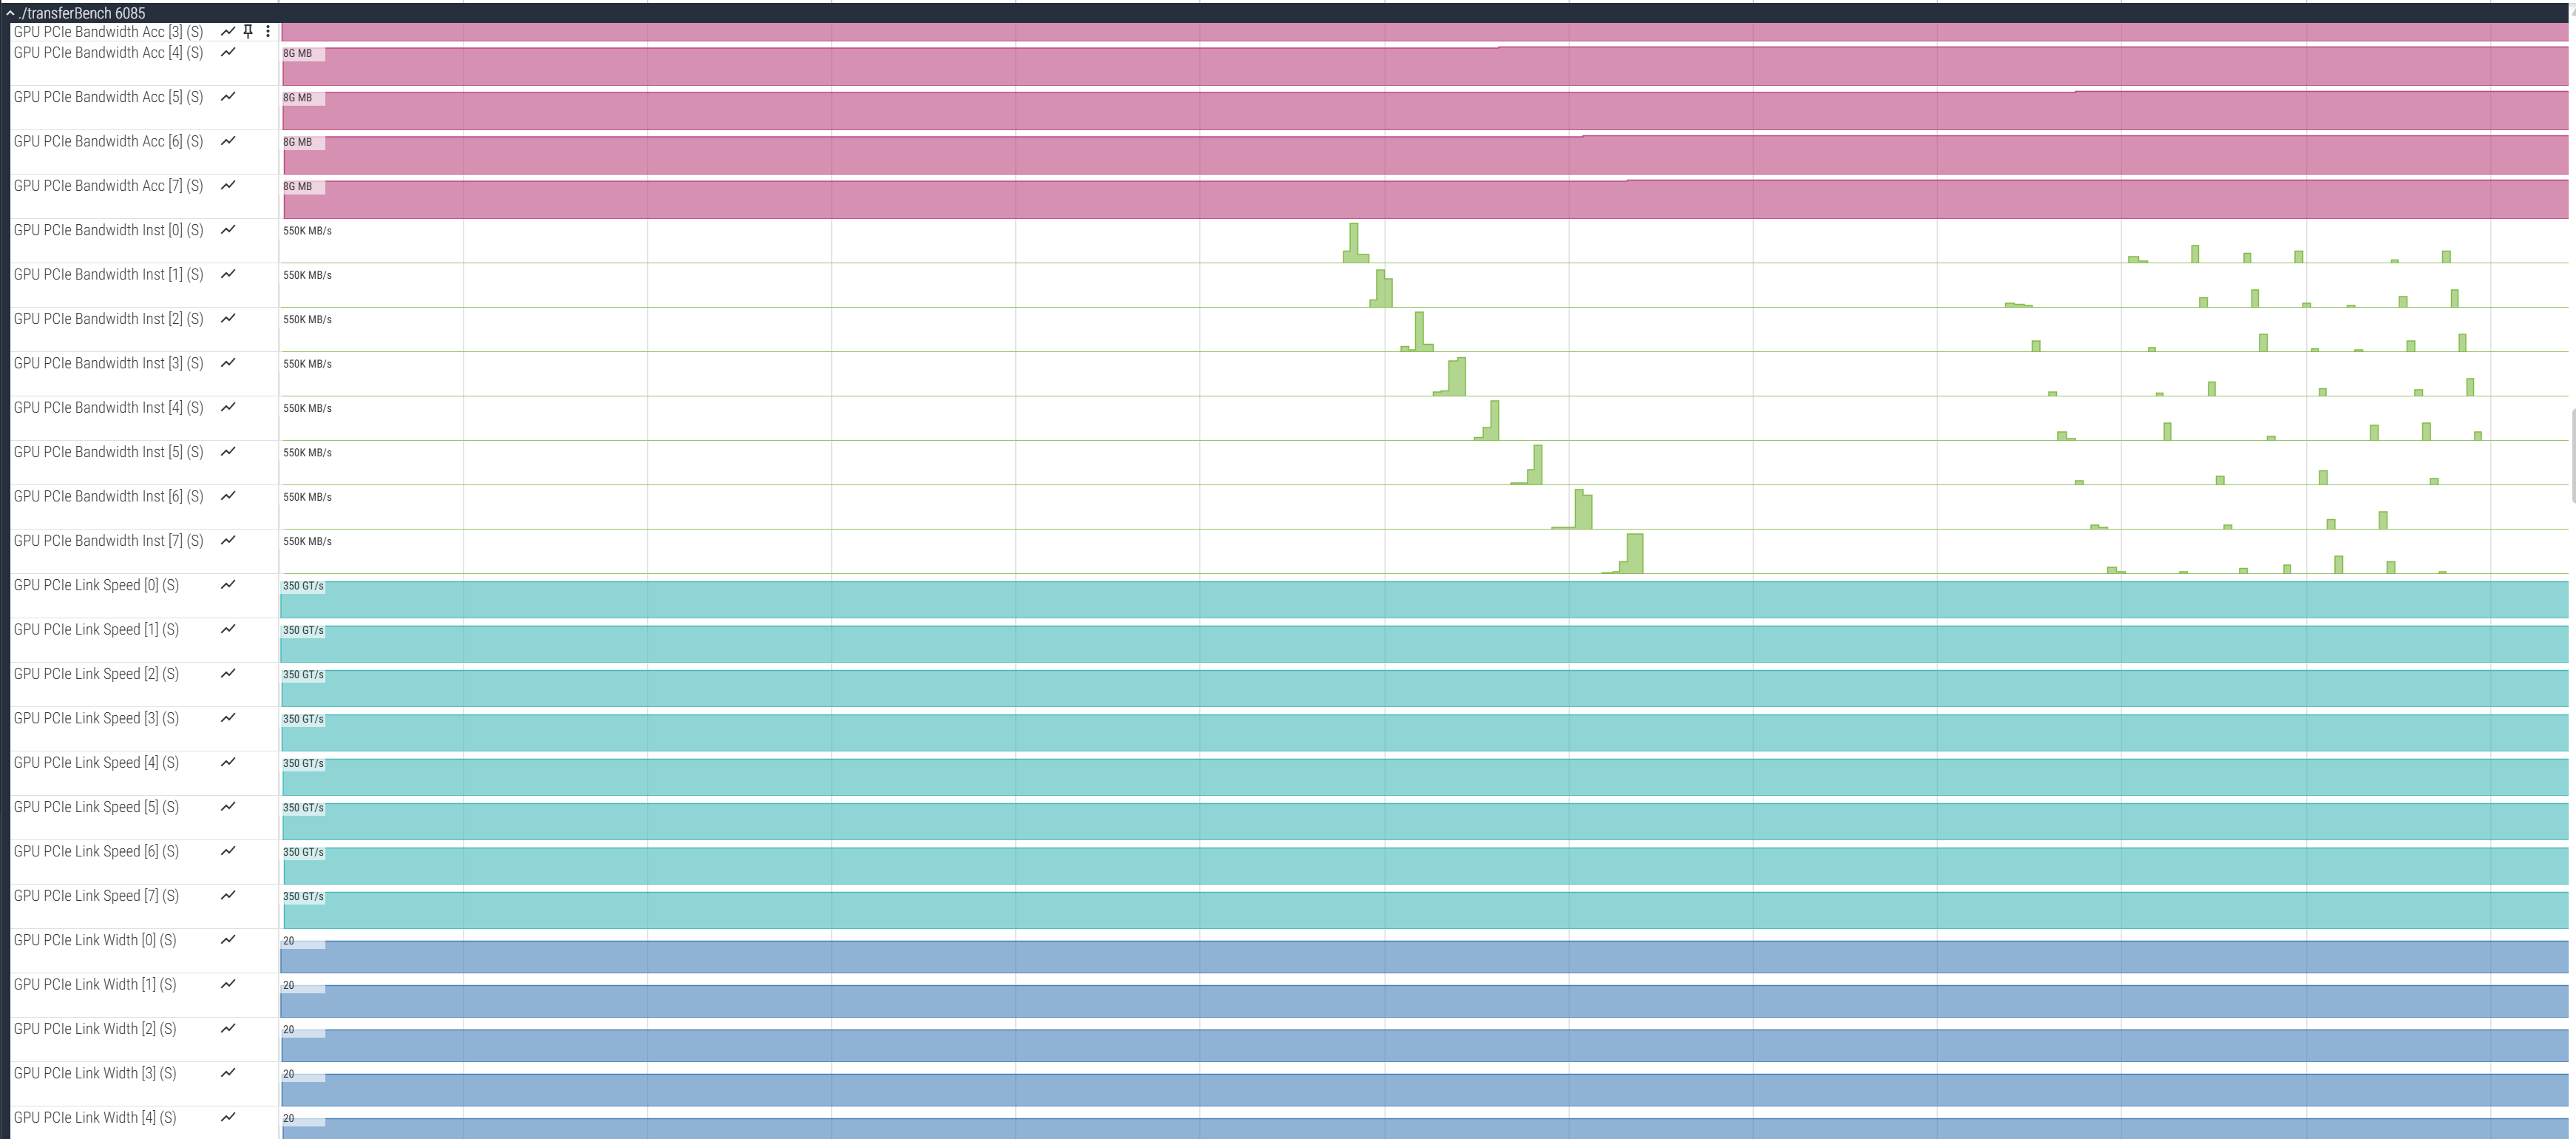
PCIe Link Width: The number of PCIe lanes currently active
PCIe Link Speed: The current PCIe link generation and speed (e.g., Gen3, Gen4, Gen5)
PCIe Bandwidth Accumulated: Total bandwidth accumulated over time (in MB)
PCIe Bandwidth Instantaneous: Instantaneous bandwidth at the time of sampling (in MB/s)
These metrics help analyze CPU-to-GPU data transfer efficiency and identify PCIe bottlenecks.
Using TransferBench for testing#
For testing and benchmarking GPU connectivity, you can use the TransferBench. TransferBench is a benchmarking utility designed to measure the performance of simultaneous data transfers between user-specified devices, such as CPUs and GPUs. For this example, TransferBench is used to profile XGMI and PCIe traffic for analysis.
Source the ROCm Systems Profiler Environment using:
source /opt/rocprofiler-systems/share/rocprofiler-systems/setup-env.sh
Alternatively, if you are using modules, use:
module use /opt/rocprofiler-systems/share/modulefiles
Generate and configure the profiler config file.
rocprof-sys-avail -G $HOME/.rocprofsys.cfg -F txt
export ROCPROFSYS_CONFIG_FILE=$HOME/.rocprofsys.cfg
Edit .rocprofsys.cfg with the following settings:
ROCPROFSYS_USE_AMD_SMI     = true
ROCPROFSYS_AMD_SMI_METRICS = busy,temp,power,mem_usage,xgmi,pcie
ROCPROFSYS_ROCM_DOMAINS    = hip_runtime_api,memory_copy,hsa_api
Profile the TransferBench application.
rocprof-sys-sample -PTHD -- ./TransferBench a2a
Note
Refer to these steps to Install and build TransferBench.
At the end of the run, a similar message appears:
[rocprofiler-systems][964294][perfetto]> Outputting '/home/demo/rocprofsys-transferBench-output/2025-04-25_15.52/perfetto-trace-964294.proto'
(3124.52 KB / 3.12 MB / 0.00 GB)... Done
To view the generated .proto file in the browser, open the
Perfetto UI page. Then, click on
Open trace file and select the .proto file. In the browser, you can visualize the XGMI and PCIe metrics.
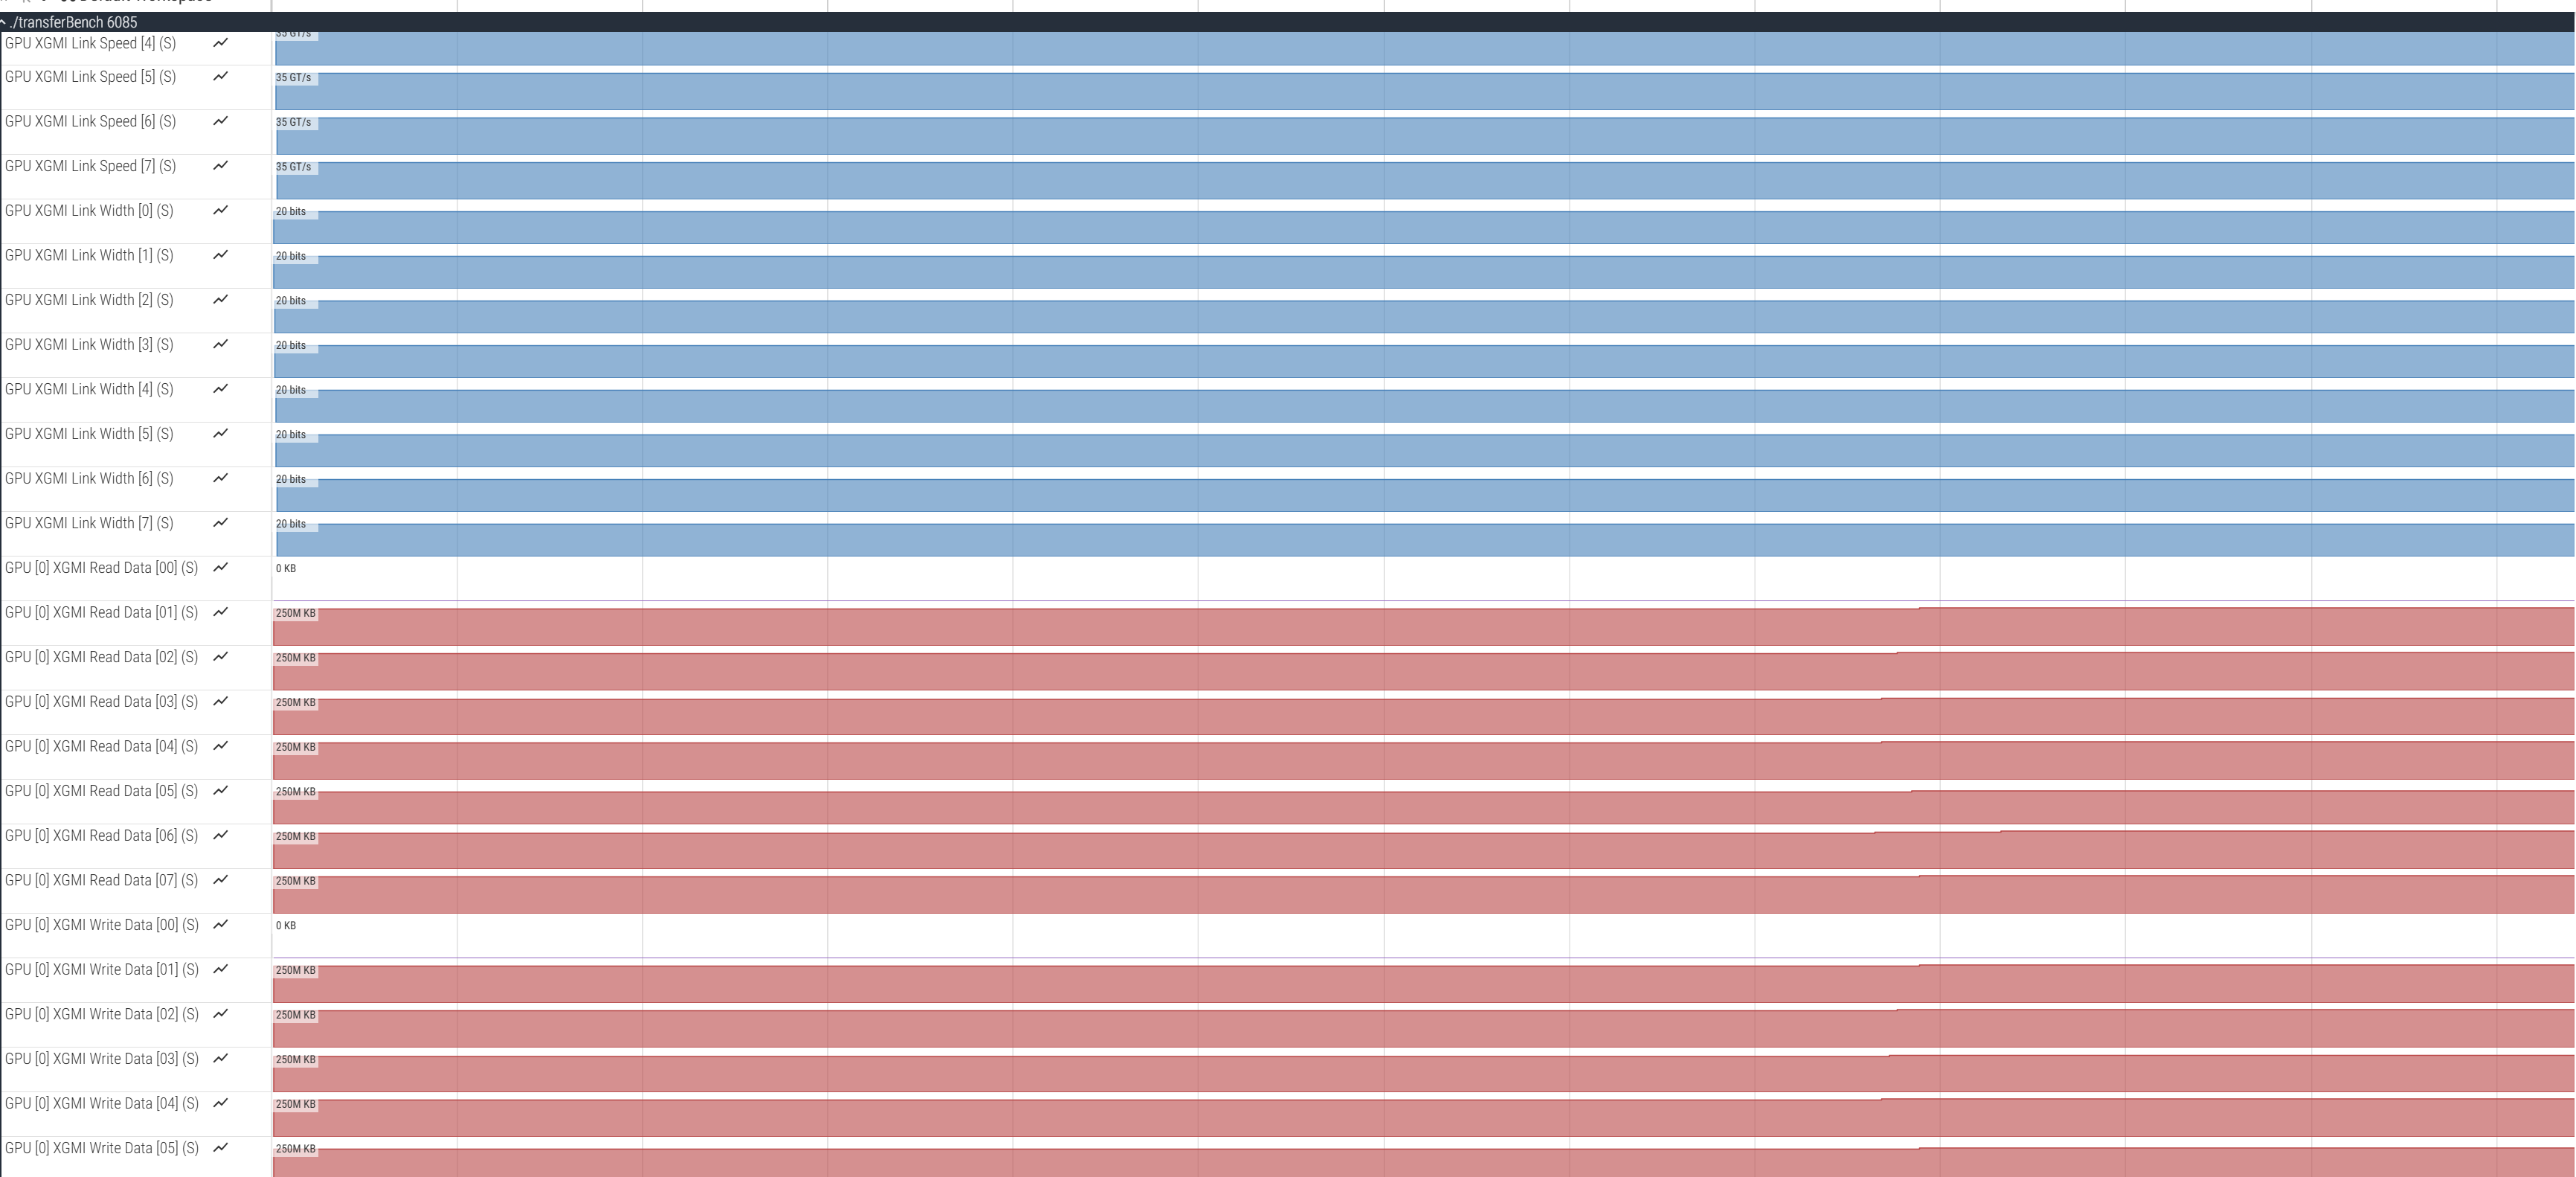
The visualization will show:
XGMI Read Data and XGMI Write Data tracks showing data transfer through XGMI links over time
XGMI Link Width and XGMI Link Speed tracks showing link configuration
PCIe Bandwidth tracks showing CPU-to-GPU data transfer rates
PCIe Link Width and PCIe Link Speed tracks showing PCIe link configuration
Tips for effective profiling#
Multi-GPU workloads: XGMI metrics are most useful when profiling applications that use multiple GPUs and transfer data between them.
Sampling frequency: Adjust the sampling frequency using
ROCPROFSYS_PROCESS_SAMPLING_FREQ(default is 50Hz) to capture more or fewer samples based on your analysis needs.Focus on specific metrics: If you only need XGMI or PCIe metrics, you can specify just those:
ROCPROFSYS_AMD_SMI_METRICS=xgmi  # Only XGMI metrics
ROCPROFSYS_AMD_SMI_METRICS=pcie  # Only PCIe metrics
Combine with API tracing: For detailed analysis, combine XGMI/PCIe metrics with HIP/HSA API tracing to correlate data transfers with application behavior:
ROCPROFSYS_ROCM_DOMAINS=hip_runtime_api,memory_copy,kernel_dispatch,hsa_api
Exploring available metrics#
To explore all supported metrics and domains, use the following commands:
rocprof-sys-avail --all                    # Show all available options
rocprof-sys-avail -bd -r AMD_SMI_METRICS   # Show AMD SMI metrics
rocprof-sys-avail -bd -r ROCM_DOMAINS      # Show ROCm tracing domains
For more details on ROCm Systems Profiler configuration, refer to the configuration guide.