CLI analysis#
This section provides an overview of ROCm Compute Profiler’s CLI analysis features.
Derived metrics: All of ROCm Compute Profiler’s built-in metrics.
Baseline comparison: Compare multiple runs in a side-by-side manner.
Metric customization: Isolate a subset of built-in metrics or build your own profiling configuration.
Filtering: Hone in on a particular kernel, GPU ID, or dispatch ID via post-process filtering.
Per-kernel roofline analysis: Detailed arithmetic intensity and performance analysis for individual kernels.
Roofline HTML generation: Generate interactive HTML roofline charts from profiling data.
Run rocprof-compute analyze -h for more details.
Walkthrough#
To begin, generate a high-level analysis report using ROCm Compute Profiler’s
-b(or--block) flag.
Note
By default, analyze only evaluates the profiled blocks. Analyze-mode
-b overrides this and might produce missing-counter warnings for blocks
whose counters were not collected.
There are three high-level GPU analysis views:
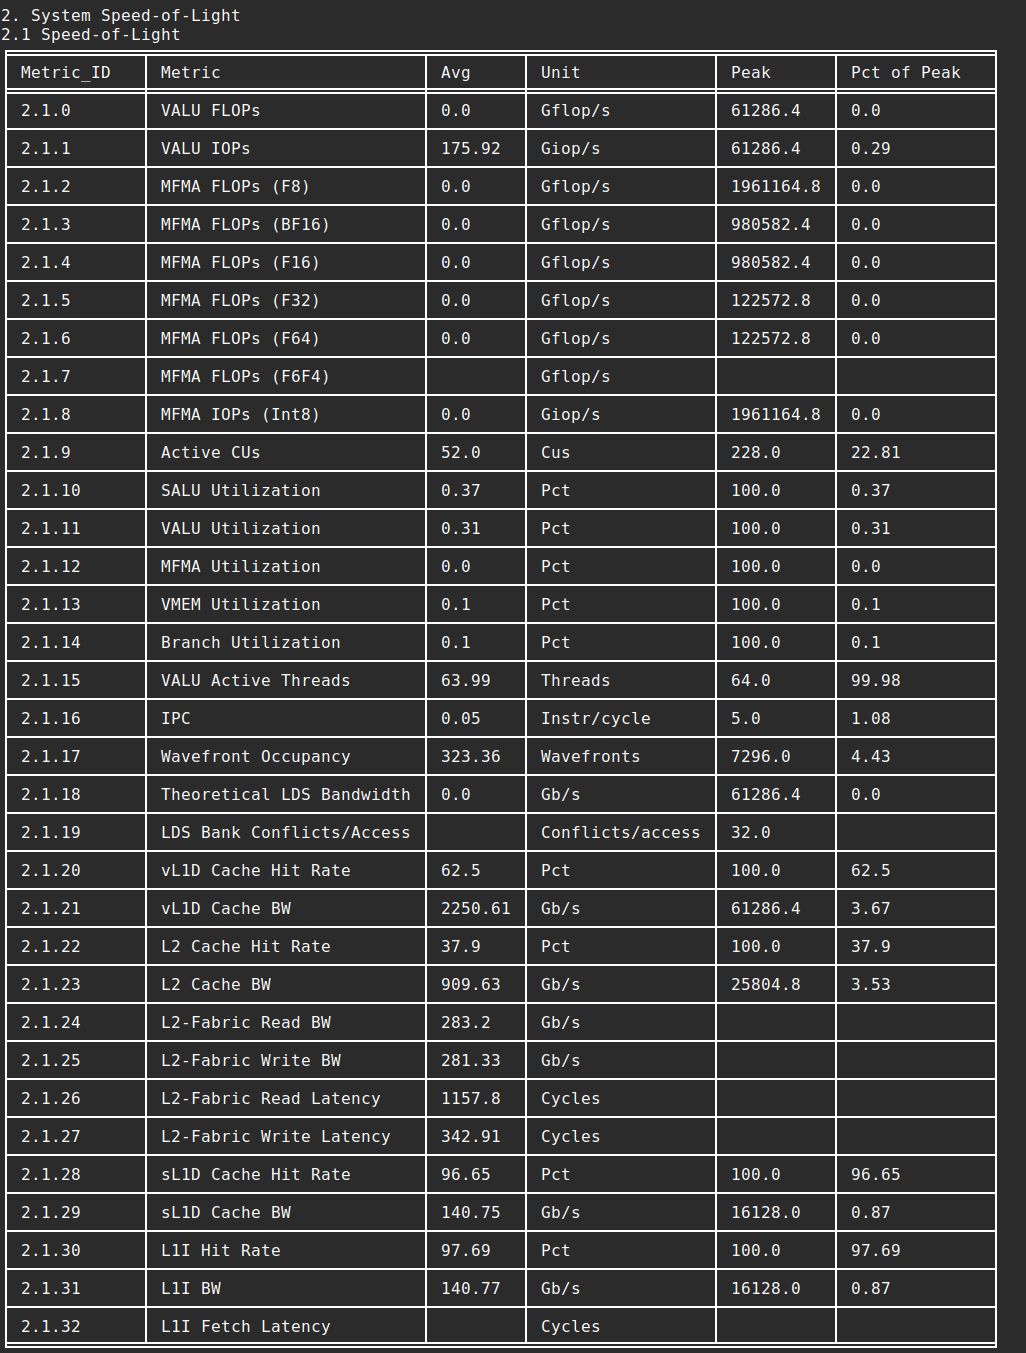
System Speed-of-Light: Key GPU performance metrics to show overall GPU performance and utilization.
Memory chart: Shows memory transactions and throughput on each cache hierarchical level.
Empirical hierarchical roofline: Roofline model that compares achieved throughput with attainable peak hardware limits, more specifically peak compute throughput and memory bandwidth. When combined with kernel filtering, provides detailed per-kernel arithmetic intensity analysis and performance breakdowns.
System Speed-of-Light:
$ rocprof-compute analyze -p workloads/vcopy/MI200/ --speed-of-light
Tip
--speed-of-light, --memory-chart and --roofline show only the System
Speed-of-Light, Memory Chart and Roofline panels, the same as -b 2, -b 3
and -b 4.
Memory chart:
$ rocprof-compute analyze -p workloads/vcopy/MI350/ --memory-chart
3. Memory Chart (Normalization: per_kernel)
╭──────────────────────╮
│ xGMI (to Peer GPU) │
╰──────────────────────╯
|| Read BW 0.000 GB/s
|| Write BW 0.000 GB/s
|| Atomic BW 0.000 GB/s
|-------------------------------------------------- GPU (XCD) --------------------------------------------------|------------------------------------------ Fabric / Memory ------------------------------------------|
╭── Compute Units ───╮Non-buffer Request╭─────── VL1D ───────╮Read BW ╭──────── L2 ────────╮ ╭─── Data Fabric ────╮ ╭─────── MALL ───────╮╭─────── UMC ────────╮╭─────── HBM ────────╮
│ Wave Occ 75.1% │Read : 1.64e+04 │ Hit 62.0% │1513.097 GB/s│ Hit 34.0% │ │ │ │ ││ ││ Read BW │
│ vGPRs 4.0 │<--------------- │ ██████░░░░ │<----------- │ ███░░░░░░░ │ │ │ │ ││ ││ 1513.882 GB/s │
│ sGPRs 16.0 │Write : 1.64e+04 │ │ │ │ │ │ │ ││ ││ │
│ Scratch/Wave │---------------> │ Coalesce 25.0% │Write BW │ │ │ │ │ ││ ││ Write BW │
│ 0.000 KB │Atomic : 0 │ ██░░░░░░░░ │1513.097 GB/s│ │ │ │ │ ││ ││ 1513.097 GB/s │
│ LDS Alloc 0.0 KB │<--------------> │ │-----------> │ │ │ │ │ ││ ││ │
│ Workgroups/CU 62.1 │Buffer Request │ │ │ │ │ │ │ ││ ││ Atomic BW │
│ │Read : 0 │ │Atomic BW │ │ │ │ │ ││ ││ 0.000 GB/s │
│ │<--------------- │ │0.000 GB/s │ │ │ │ │ ││ ││ │
│ │Write : 0 │ │<----------> │ │ │ │ │ ││ ││ │
│ │---------------> │ │ │ │ │ │ │ ││ ││ │
│ │Atomic : 0 │ │ │ │ │ │ │ ││ ││ │
│ │<--------------> │ │ │ │Read BW │ │Read BW │ ││ ││ │
│ │ │ │ │ │1513.882 GB/s │ │1513.882 GB/s │ ││ ││ │
│ │ ╰────────────────────╯ │ │<----------- │ │<----------- │ ││ ││ │
│ │Read : 0 ╭─────── LDS ────────╮ │ │ │ │ │ ││ ││ │
│ │<--------------- │ Util 0.0% │ │ │Write/Atomic BW│ │Write/Atomic BW│ ││ ││ │
│ │Write : 0 │ ░░░░░░░░░░ │ │ │1513.097 GB/s │ │1513.097 GB/s │ ││ ││ │
│ │---------------> │ │ │ │-----------> │ │-----------> │ ││ ││ │
│ │Atomic : 0 │ │ │ │ │ │ │ ││ ││ │
│ │<--------------> │ │ │ │ │ │ │ ││ ││ │
│ │Instr : 0 │ │ │ │ │ │ │ ││ ││ │
│ │<--------------> │ │ │ │ │ │ │ ││ ││ │
│ │ │ │ │ │ │ │ │ ││ ││ │
│ │ ╰────────────────────╯ │ │ │ │ │ ││ ││ │
│ │SMEM ╭─────── sL1D ───────╮Read BW │ │ │ │ │ ││ ││ │
│ │Read : 6.55e+04 │ Hit 93.0% │1.674 GB/s │ │ │ │ │ ││ ││ │
│ │<--------------- │ █████████░ │<----------- │ │ │ │ │ ││ ││ │
│ │ ╰────────────────────╯ │ │ │ │ │ ││ ││ │
│ │ICACHE ╭─────── L1I ────────╮Read BW │ │ │ │ │ ││ ││ │
│ │Read : 6.55e+04 │ Hit 93.0% │6.696 GB/s │ │ │ │ │ ││ ││ │
│ │<--------------- │ █████████░ │<----------- │ │ │ │ │ ││ ││ │
╰────────────────────╯ ╰────────────────────╯ ╰────────────────────╯ ╰────────────────────╯ ╰────────────────────╯╰────────────────────╯╰────────────────────╯
|| Read BW 0.000 GB/s
|| Write BW 0.000 GB/s
|| Atomic BW 0.000 GB/s
╭────────────────────────────────────────────╮
│ PCIe (to CPU or Non-xGMI connected GPU) │
╰────────────────────────────────────────────╯
Legend: <---- Read ----> Write <---> Atomic █ Util █ Hit%
The memory chart is a wide diagram whose width follows its content. It does not shrink to fit the terminal, so in a narrow window every chart line wraps and the boxes, arrows, and bandwidth labels no longer line up. Widening the window until one chart line fits on a single row fixes this. If you cannot resize, use one of the following instead.
Pipe the output into less. -S cuts long lines instead of wrapping them,
and -R shows the colored log lines above the chart as color rather than
escape codes. Use the left and right arrow keys to scroll across the chart:
$ rocprof-compute analyze -p workloads/vcopy/MI200/ -b 3 | less -RS
You can also send the output to an editor, for example Visual Studio Code:
$ rocprof-compute analyze -p workloads/vcopy/MI200/ -b 3 | code -
The chart is colored only when it is printed straight to a terminal, so it is plain text in both of the preceding commands.
To print the block as tables instead of the diagram, use --debug-table-view
(see Debug options).
Empirical hierarchical roofline:
$ rocprof-compute analyze -p workloads/rocflop/MI350/ --roofline

--------------------------------------------------------------------------------
4. Roofline

Interactive roofline plot saved to /home/user/workloads/rocflop/MI350/empirRoof_gpu-0.html

(4.1) Per-Kernel Roofline Metrics and (4.2) AI Plot Points

Kernel 0: matmul_fp32_throughput(float*, float
__vector(4)*, int) (25.8%)
  |
  ├─ 4.1 Roofline Rate Metrics:
  |   ╒═════════════╤════════════════════╤═══════════╤═════════╤════════════════════╕
  |   │ Metric_ID   │ Metric             │     Value │ Unit    │   Peak (Empirical) │
  |   ╞═════════════╪════════════════════╪═══════════╪═════════╪════════════════════╡
  |   │ 4.1.0       │ VALU FLOPs (F16)   │      0.00 │ GFLOP/s │          142403.81 │
  |   ├─────────────┼────────────────────┼───────────┼─────────┼────────────────────┤
  |   │ 4.1.1       │ VALU FLOPs (F32)   │      0.02 │ GFLOP/s │          139518.41 │
  |   ├─────────────┼────────────────────┼───────────┼─────────┼────────────────────┤
  |   │ 4.1.2       │ VALU FLOPs (F64)   │      0.00 │ GFLOP/s │           70917.90 │
  |   ├─────────────┼────────────────────┼───────────┼─────────┼────────────────────┤
  |   │ 4.1.3       │ MFMA FLOPs (F64)   │      0.00 │ GFLOP/s │           71377.49 │
  |   ├─────────────┼────────────────────┼───────────┼─────────┼────────────────────┤
  |   │ 4.1.4       │ MFMA FLOPs (F32)   │ 136977.38 │ GFLOP/s │          142150.19 │
  |   ├─────────────┼────────────────────┼───────────┼─────────┼────────────────────┤
  |   │ 4.1.5       │ MFMA FLOPs (F16)   │      0.00 │ GFLOP/s │         1697415.60 │
  |   ├─────────────┼────────────────────┼───────────┼─────────┼────────────────────┤
  |   │ 4.1.6       │ MFMA FLOPs (BF16)  │      0.00 │ GFLOP/s │         1938708.14 │
  |   ├─────────────┼────────────────────┼───────────┼─────────┼────────────────────┤
  |   │ 4.1.7       │ MFMA FLOPs (F8)    │      0.00 │ GFLOP/s │         2090034.29 │
  |   ├─────────────┼────────────────────┼───────────┼─────────┼────────────────────┤
  |   │ 4.1.8       │ MFMA FLOPs (MXF8)  │      0.00 │ GFLOP/s │         4361892.90 │
  |   ├─────────────┼────────────────────┼───────────┼─────────┼────────────────────┤
  |   │ 4.1.9       │ MFMA FLOPs (F6F4)  │      0.00 │ GFLOP/s │         7601929.39 │
  |   ├─────────────┼────────────────────┼───────────┼─────────┼────────────────────┤
  |   │ 4.1.10      │ MFMA IOPs (Int8)   │      0.00 │ GIOP/s  │         4034547.20 │
  |   ├─────────────┼────────────────────┼───────────┼─────────┼────────────────────┤
  |   │ 4.1.11      │ HBM Bandwidth      │      0.11 │ GB/s    │            6964.63 │
  |   ├─────────────┼────────────────────┼───────────┼─────────┼────────────────────┤
  |   │ 4.1.12      │ L2 Cache Bandwidth │      0.18 │ GB/s    │           31643.80 │
  |   ├─────────────┼────────────────────┼───────────┼─────────┼────────────────────┤
  |   │ 4.1.13      │ L1 Cache Bandwidth │      0.23 │ GB/s    │           34846.58 │
  |   ├─────────────┼────────────────────┼───────────┼─────────┼────────────────────┤
  |   │ 4.1.14      │ LDS Bandwidth      │      0.00 │ GB/s    │           57018.43 │
  |   ╘═════════════╧════════════════════╧═══════════╧═════════╧════════════════════╛
  ├─ 4.2 Roofline AI Plot Points:
  |   ╒═════════════╤══════════════════════╤════════════════════╤════════════╕
  |   │ Metric_ID   │ Metric               │ Value              │ Unit       │
  |   ╞═════════════╪══════════════════════╪════════════════════╪════════════╡
  |   │ 4.2.0       │ AI HBM               │ 1198230.6258325255 │ FLOPs/Byte │
  |   ├─────────────┼──────────────────────┼────────────────────┼────────────┤
  |   │ 4.2.1       │ AI L2                │ 762602.760461121   │ FLOPs/Byte │
  |   ├─────────────┼──────────────────────┼────────────────────┼────────────┤
  |   │ 4.2.2       │ AI L1                │ 599186.8145721277  │ FLOPs/Byte │
  |   ├─────────────┼──────────────────────┼────────────────────┼────────────┤
  |   │ 4.2.3       │ AI LDS               │ N/A                │ FLOPs/Byte │
  |   ├─────────────┼──────────────────────┼────────────────────┼────────────┤
  |   │ 4.2.4       │ Performance (GFLOPs) │ 136977.40092136632 │ GFLOP/s    │
  |   ╘═════════════╧══════════════════════╧════════════════════╧════════════╛

...
Open the saved HTML file in a browser for the interactive roofline plot. See roofline-html-generation.
Note
Visualized memory chart is only supported in single run analysis. In multiple runs comparison mode, it is switched back to basic table view.
Visualized memory chart is drawn at a fixed width and needs a wide terminal. See cli-memory-chart-viewing if it wraps.
Use
--list-metricsto list the blocks the workload profiled, and add block IDs or aliases to list their metrics. See List blocks and metrics.$ rocprof-compute analyze -p workloads/vcopy/MI200/ --list-metrics $ rocprof-compute analyze -p workloads/vcopy/MI200/ --list-metrics sol
On MI300 and MI350 series GPUs, block 1 (System Info) also reports compute and memory partition modes. See Compute and memory partition modes in analysis for how those fields affect metric normalization.
Choose your own customized subset of metrics with the
-b(or--block) option. The following snippet shows how to generate a report containing only metric 2 (System Speed-of-Light).$ rocprof-compute analyze -p workloads/vcopy/MI200/ -b 2 -------- Analyze -------- -------------------------------------------------------------------------------- 1. Top Stat ╒════╤══════════════════════════════════════════╤═════════╤═══════════╤════════════╤══════════════╤════════╕ │ │ KernelName │ Count │ Sum(ns) │ Mean(ns) │ Median(ns) │ Pct │ ╞════╪══════════════════════════════════════════╪═════════╪═══════════╪════════════╪══════════════╪════════╡ │ 0 │ vecCopy(double*, double*, double*, int, │ 1 │ 20000.00 │ 20000.00 │ 20000.00 │ 100.00 │ │ │ int) [clone .kd] │ │ │ │ │ │ ╘════╧══════════════════════════════════════════╧═════════╧═══════════╧════════════╧══════════════╧════════╛ -------------------------------------------------------------------------------- 2. System Speed-of-Light 2.1 System Speed-of-Light ╒═════════════╤═══════════════════════════╤═════════╤════════════════════════╤══════════╤═══════════════════╕ │ Metric_ID │ Metric │ Avg │ Unit │ Peak │ Percent of Peak │ ╞═════════════╪═══════════════════════════╪═════════╪════════════════════════╪══════════╪═══════════════════╡ │ 2.1.0 │ VALU FLOPs │ 0.0 │ GFLOP/s │ 22630.4 │ 0.0 │ ├─────────────┼───────────────────────────┼─────────┼────────────────────────┼──────────┼───────────────────┤ │ 2.1.1 │ MFMA FLOPs (BF16) │ 0.0 │ GFLOP/s │ 181043.2 │ 0.0 │ ├─────────────┼───────────────────────────┼─────────┼────────────────────────┼──────────┼───────────────────┤ │ 2.1.2 │ MFMA FLOPs (F16) │ 0.0 │ GFLOP/s │ 181043.2 │ 0.0 │ ├─────────────┼───────────────────────────┼─────────┼────────────────────────┼──────────┼───────────────────┤ │ 2.1.3 │ MFMA FLOPs (F32) │ 0.0 │ GFLOP/s │ 45260.8 │ 0.0 │ ├─────────────┼───────────────────────────┼─────────┼────────────────────────┼──────────┼───────────────────┤ │ 2.1.4 │ MFMA FLOPs (F64) │ 0.0 │ GFLOP/s │ 45260.8 │ 0.0 │ ├─────────────┼───────────────────────────┼─────────┼────────────────────────┼──────────┼───────────────────┤ │ 2.1.5 │ MFMA IOPs (Int8) │ 0.0 │ GIOP/s │ 181043.2 │ 0.0 │ ├─────────────┼───────────────────────────┼─────────┼────────────────────────┼──────────┼───────────────────┤ │ 2.1.6 │ SALU Utilization │ 2.74 │ Percent │ 100.0 │ N/A │ ├─────────────┼───────────────────────────┼─────────┼────────────────────────┼──────────┼───────────────────┤ │ 2.1.7 │ VALU Utilization │ 3.91 │ Percent │ 100.0 │ N/A │ ├─────────────┼───────────────────────────┼─────────┼────────────────────────┼──────────┼───────────────────┤ │ 2.1.8 │ MFMA Utilization │ 0.0 │ Percent │ 100.0 │ N/A │ ├─────────────┼───────────────────────────┼─────────┼────────────────────────┼──────────┼───────────────────┤ │ 2.1.9 │ VMEM Utilization │ 0.78 │ Percent │ 100.0 │ N/A │ ├─────────────┼───────────────────────────┼─────────┼────────────────────────┼──────────┼───────────────────┤ │ 2.1.10 │ Branch Utilization │ 0.78 │ Percent │ 100.0 │ N/A │ ├─────────────┼───────────────────────────┼─────────┼────────────────────────┼──────────┼───────────────────┤ │ 2.1.11 │ VALU Active Threads │ 64.0 │ Work-items │ 64.0 │ 100.0 │ ├─────────────┼───────────────────────────┼─────────┼────────────────────────┼──────────┼───────────────────┤ │ 2.1.12 │ IPC │ 0.14 │ Instructions per Cycle │ 5.0 │ 2.89 │ ├─────────────┼───────────────────────────┼─────────┼────────────────────────┼──────────┼───────────────────┤ │ 2.1.13 │ Wavefront Occupancy │ 1904.8 │ Wavefronts │ 3328.0 │ 57.24 │ ├─────────────┼───────────────────────────┼─────────┼────────────────────────┼──────────┼───────────────────┤ │ 2.1.14 │ Theoretical LDS Bandwidth │ 0.0 │ GB/s │ 22630.4 │ 0.0 │ ├─────────────┼───────────────────────────┼─────────┼────────────────────────┼──────────┼───────────────────┤ │ 2.1.15 │ LDS Bank Conflicts/Access │ N/A │ Conflicts per Access │ 32.0 │ N/A │ ├─────────────┼───────────────────────────┼─────────┼────────────────────────┼──────────┼───────────────────┤ │ 2.1.16 │ vL1D Cache Hit Rate │ 50.0 │ Percent │ 100.0 │ N/A │ ├─────────────┼───────────────────────────┼─────────┼────────────────────────┼──────────┼───────────────────┤ │ 2.1.17 │ vL1D Cache BW │ 1941.81 │ GB/s │ 11315.2 │ 17.16 │ ├─────────────┼───────────────────────────┼─────────┼────────────────────────┼──────────┼───────────────────┤ │ 2.1.18 │ L2 Cache Hit Rate │ 34.75 │ Percent │ 100.0 │ N/A │ ├─────────────┼───────────────────────────┼─────────┼────────────────────────┼──────────┼───────────────────┤ │ 2.1.19 │ L2 Cache BW │ 1488.67 │ GB/s │ 3481.6 │ 42.76 │ ├─────────────┼───────────────────────────┼─────────┼────────────────────────┼──────────┼───────────────────┤ │ 2.1.20 │ L2-Fabric Read BW │ 485.48 │ GB/s │ 1638.4 │ 29.63 │ ├─────────────┼───────────────────────────┼─────────┼────────────────────────┼──────────┼───────────────────┤ │ 2.1.21 │ L2-Fabric Write BW │ 386.75 │ GB/s │ 1638.4 │ 23.61 │ ├─────────────┼───────────────────────────┼─────────┼────────────────────────┼──────────┼───────────────────┤ │ 2.1.22 │ L2-Fabric Read Latency │ 909.82 │ Cycles │ N/A │ N/A │ ├─────────────┼───────────────────────────┼─────────┼────────────────────────┼──────────┼───────────────────┤ │ 2.1.23 │ L2-Fabric Write Latency │ 606.22 │ Cycles │ N/A │ N/A │ ├─────────────┼───────────────────────────┼─────────┼────────────────────────┼──────────┼───────────────────┤ │ 2.1.24 │ sL1D Cache Hit Rate │ 99.91 │ Percent │ 100.0 │ N/A │ ├─────────────┼───────────────────────────┼─────────┼────────────────────────┼──────────┼───────────────────┤ │ 2.1.25 │ sL1D Cache BW │ 242.73 │ GB/s │ 6092.8 │ 3.98 │ ├─────────────┼───────────────────────────┼─────────┼────────────────────────┼──────────┼───────────────────┤ │ 2.1.26 │ L1I Hit Rate │ 99.91 │ Percent │ 100.0 │ N/A │ ├─────────────┼───────────────────────────┼─────────┼────────────────────────┼──────────┼───────────────────┤ │ 2.1.27 │ L1I BW │ 242.73 │ GB/s │ 6092.8 │ 3.98 │ ├─────────────┼───────────────────────────┼─────────┼────────────────────────┼──────────┼───────────────────┤ │ 2.1.28 │ L1I Fetch Latency │ 32.73 │ Cycles │ N/A │ N/A │ ├─────────────┼───────────────────────────┼─────────┼────────────────────────┼──────────┼───────────────────┤ │ 2.1.29 │ CU Utilization │ 65.01 │ Percent │ 100.0 │ N/A │ ╘═════════════╧═══════════════════════════╧═════════╧════════════════════════╧══════════╧═══════════════════╛
Alternatively, use the option
-b(or--block) with block alias(es). The following snippet shows how to generate a report containing only metric 2 with the alias equivalent ofsol$ rocprof-compute analyze -p workloads/vcopy/MI200/ -b sol -------- Analyze -------- -------------------------------------------------------------------------------- 1. Top Stat ╒════╤══════════════════════════════════════════╤═════════╤═══════════╤════════════╤══════════════╤════════╕ │ │ KernelName │ Count │ Sum(ns) │ Mean(ns) │ Median(ns) │ Pct │ ╞════╪══════════════════════════════════════════╪═════════╪═══════════╪════════════╪══════════════╪════════╡ │ 0 │ vecCopy(double*, double*, double*, int, │ 1 │ 20000.00 │ 20000.00 │ 20000.00 │ 100.00 │ │ │ int) [clone .kd] │ │ │ │ │ │ ╘════╧══════════════════════════════════════════╧═════════╧═══════════╧════════════╧══════════════╧════════╛ -------------------------------------------------------------------------------- 2. System Speed-of-Light 2.1 System Speed-of-Light ╒═════════════╤═══════════════════════════╤═════════╤════════════════════════╤══════════╤═══════════════════╕ │ Metric_ID │ Metric │ Avg │ Unit │ Peak │ Percent of Peak │ ╞═════════════╪═══════════════════════════╪═════════╪════════════════════════╪══════════╪═══════════════════╡ │ 2.1.0 │ VALU FLOPs │ 0.0 │ GFLOP/s │ 22630.4 │ 0.0 │ ├─────────────┼───────────────────────────┼─────────┼────────────────────────┼──────────┼───────────────────┤ │ 2.1.1 │ MFMA FLOPs (BF16) │ 0.0 │ GFLOP/s │ 181043.2 │ 0.0 │ ├─────────────┼───────────────────────────┼─────────┼────────────────────────┼──────────┼───────────────────┤ │ 2.1.2 │ MFMA FLOPs (F16) │ 0.0 │ GFLOP/s │ 181043.2 │ 0.0 │ ├─────────────┼───────────────────────────┼─────────┼────────────────────────┼──────────┼───────────────────┤ │ 2.1.3 │ MFMA FLOPs (F32) │ 0.0 │ GFLOP/s │ 45260.8 │ 0.0 │ ├─────────────┼───────────────────────────┼─────────┼────────────────────────┼──────────┼───────────────────┤ │ 2.1.4 │ MFMA FLOPs (F64) │ 0.0 │ GFLOP/s │ 45260.8 │ 0.0 │ ├─────────────┼───────────────────────────┼─────────┼────────────────────────┼──────────┼───────────────────┤ │ 2.1.5 │ MFMA IOPs (Int8) │ 0.0 │ GIOP/s │ 181043.2 │ 0.0 │ ├─────────────┼───────────────────────────┼─────────┼────────────────────────┼──────────┼───────────────────┤ │ 2.1.6 │ SALU Utilization │ 2.74 │ Percent │ 100.0 │ N/A │ ├─────────────┼───────────────────────────┼─────────┼────────────────────────┼──────────┼───────────────────┤ │ 2.1.7 │ VALU Utilization │ 3.91 │ Percent │ 100.0 │ N/A │ ├─────────────┼───────────────────────────┼─────────┼────────────────────────┼──────────┼───────────────────┤ │ 2.1.8 │ MFMA Utilization │ 0.0 │ Percent │ 100.0 │ N/A │ ├─────────────┼───────────────────────────┼─────────┼────────────────────────┼──────────┼───────────────────┤ │ 2.1.9 │ VMEM Utilization │ 0.78 │ Percent │ 100.0 │ N/A │ ├─────────────┼───────────────────────────┼─────────┼────────────────────────┼──────────┼───────────────────┤ │ 2.1.10 │ Branch Utilization │ 0.78 │ Percent │ 100.0 │ N/A │ ├─────────────┼───────────────────────────┼─────────┼────────────────────────┼──────────┼───────────────────┤ │ 2.1.11 │ VALU Active Threads │ 64.0 │ Work-items │ 64.0 │ 100.0 │ ├─────────────┼───────────────────────────┼─────────┼────────────────────────┼──────────┼───────────────────┤ │ 2.1.12 │ IPC │ 0.14 │ Instructions per Cycle │ 5.0 │ 2.89 │ ├─────────────┼───────────────────────────┼─────────┼────────────────────────┼──────────┼───────────────────┤ │ 2.1.13 │ Wavefront Occupancy │ 1904.8 │ Wavefronts │ 3328.0 │ 57.24 │ ├─────────────┼───────────────────────────┼─────────┼────────────────────────┼──────────┼───────────────────┤ │ 2.1.14 │ Theoretical LDS Bandwidth │ 0.0 │ GB/s │ 22630.4 │ 0.0 │ ├─────────────┼───────────────────────────┼─────────┼────────────────────────┼──────────┼───────────────────┤ │ 2.1.15 │ LDS Bank Conflicts/Access │ N/A │ Conflicts per Access │ 32.0 │ N/A │ ├─────────────┼───────────────────────────┼─────────┼────────────────────────┼──────────┼───────────────────┤ │ 2.1.16 │ vL1D Cache Hit Rate │ 50.0 │ Percent │ 100.0 │ N/A │ ├─────────────┼───────────────────────────┼─────────┼────────────────────────┼──────────┼───────────────────┤ │ 2.1.17 │ vL1D Cache BW │ 1941.81 │ GB/s │ 11315.2 │ 17.16 │ ├─────────────┼───────────────────────────┼─────────┼────────────────────────┼──────────┼───────────────────┤ │ 2.1.18 │ L2 Cache Hit Rate │ 34.75 │ Percent │ 100.0 │ N/A │ ├─────────────┼───────────────────────────┼─────────┼────────────────────────┼──────────┼───────────────────┤ │ 2.1.19 │ L2 Cache BW │ 1488.67 │ GB/s │ 3481.6 │ 42.76 │ ├─────────────┼───────────────────────────┼─────────┼────────────────────────┼──────────┼───────────────────┤ │ 2.1.20 │ L2-Fabric Read BW │ 485.48 │ GB/s │ 1638.4 │ 29.63 │ ├─────────────┼───────────────────────────┼─────────┼────────────────────────┼──────────┼───────────────────┤ │ 2.1.21 │ L2-Fabric Write BW │ 386.75 │ GB/s │ 1638.4 │ 23.61 │ ├─────────────┼───────────────────────────┼─────────┼────────────────────────┼──────────┼───────────────────┤ │ 2.1.22 │ L2-Fabric Read Latency │ 909.82 │ Cycles │ N/A │ N/A │ ├─────────────┼───────────────────────────┼─────────┼────────────────────────┼──────────┼───────────────────┤ │ 2.1.23 │ L2-Fabric Write Latency │ 606.22 │ Cycles │ N/A │ N/A │ ├─────────────┼───────────────────────────┼─────────┼────────────────────────┼──────────┼───────────────────┤ │ 2.1.24 │ sL1D Cache Hit Rate │ 99.91 │ Percent │ 100.0 │ N/A │ ├─────────────┼───────────────────────────┼─────────┼────────────────────────┼──────────┼───────────────────┤ │ 2.1.25 │ sL1D Cache BW │ 242.73 │ GB/s │ 6092.8 │ 3.98 │ ├─────────────┼───────────────────────────┼─────────┼────────────────────────┼──────────┼───────────────────┤ │ 2.1.26 │ L1I Hit Rate │ 99.91 │ Percent │ 100.0 │ N/A │ ├─────────────┼───────────────────────────┼─────────┼────────────────────────┼──────────┼───────────────────┤ │ 2.1.27 │ L1I BW │ 242.73 │ GB/s │ 6092.8 │ 3.98 │ ├─────────────┼───────────────────────────┼─────────┼────────────────────────┼──────────┼───────────────────┤ │ 2.1.28 │ L1I Fetch Latency │ 32.73 │ Cycles │ N/A │ N/A │ ├─────────────┼───────────────────────────┼─────────┼────────────────────────┼──────────┼───────────────────┤ │ 2.1.29 │ CU Utilization │ 65.01 │ Percent │ 100.0 │ N/A │ ╘═════════════╧═══════════════════════════╧═════════╧════════════════════════╧══════════╧═══════════════════╛
Note
Some cells may be blank indicating a missing or unavailable hardware counter or NULL value.
Optimize the application, iterate, and re-profile to inspect performance changes.
Redo a comprehensive analysis with ROCm Compute Profiler CLI at any optimization milestone.
More analysis options#
Single run
$ rocprof-compute analyze -p workloads/vcopy/MI200/
List top kernels and dispatches
$ rocprof-compute analyze -p workloads/vcopy/MI200/ --list-stats
Note
--list-stats supports the default stdout output and --output-format txt.
Combining it with --output-format csv or --output-format db exits with an error.
List metrics of selected blocks (see List blocks and metrics)
$ rocprof-compute analyze -p workloads/vcopy/MI200/ --list-metrics sol 12
Show System Speed-of-Light and CS_Busy blocks only
$ rocprof-compute analyze -p workloads/vcopy/MI200/ -b 2 5.1.0
Note
You can filter a single metric or the whole hardware component by its ID. In
this case, 1 is the ID for System Speed-of-Light and 5.1.0 the ID for
GPU Busy Cycles metric.
Filter kernels
First, list the top kernels in your application using –list-stats.
$ rocprof-compute analyze -p workloads/vcopy/MI200/ --list-stats

Analysis mode = cli
[analysis] deriving rocprofiler-compute metrics...

--------------------------------------------------------------------------------
Detected Kernels (sorted descending by duration)
╒════╤══════════════════════════════════════════════╕
│    │ Kernel_Name                                  │
╞════╪══════════════════════════════════════════════╡
│  0 │ vecCopy(double*, double*, double*, int, int) │
╘════╧══════════════════════════════════════════════╛

--------------------------------------------------------------------------------
Dispatch list
╒════╤═══════════════╤══════════════════════════════════════════════╤══════════╕
│    │   Dispatch_ID │ Kernel_Name                                  │   GPU_ID │
╞════╪═══════════════╪══════════════════════════════════════════════╪══════════╡
│  0 │             1 │ vecCopy(double*, double*, double*, int, int) │        0 │
╘════╧═══════════════╧══════════════════════════════════════════════╧══════════╛
Second, select the index of the kernel you would like to filter; for example,
vecCopy(double*, double*, double*, int, int) [clone .kd] at index 0.
Then, use this index to apply the filter via -k or --kernel.
$ rocprof-compute analyze -p workloads/vcopy/MI200/ -k 0

Analysis mode = cli
[analysis] deriving rocprofiler-compute metrics...

--------------------------------------------------------------------------------
0. Top Stats
0.1 Top Kernels
╒════╤══════════════════════════════════════════╤═════════╤═══════════╤════════════╤══════════════╤════════╤═════╕
│    │ Kernel_Name                              │   Count │   Sum(ns) │   Mean(ns) │   Median(ns) │    Pct │ S   │
╞════╪══════════════════════════════════════════╪═════════╪═══════════╪════════════╪══════════════╪════════╪═════╡
│  0 │ vecCopy(double*, double*, double*, int,  │    1.00 │  18560.00 │   18560.00 │     18560.00 │ 100.00 │ *   │
│    │ int)                                     │         │           │            │              │        │     │
╘════╧══════════════════════════════════════════╧═════════╧═══════════╧════════════╧══════════════╧════════╧═════╛
...
You should see your filtered kernels indicated by an asterisk in the Top Stats table.
Per-kernel roofline analysis
When analyzing specific kernels, the roofline analysis provides detailed metrics for each filtered kernel:
$ rocprof-compute analyze -p workloads/vcopy/MI200/ -k 0 -b 4
This generates enhanced roofline output showing per-kernel performance rates and arithmetic intensity calculations:
================================================================================
4. Roofline
================================================================================
(4.1) Per-Kernel Roofline Metrics and (4.2) AI Plot Points
--------------------------------------------------------------------------------
Kernel 0: vecCopy(double*, double*, double*, int, int) (100.0%)
   |
   ├─ 4.1 Roofline Rate Metrics:
   |   ╒═════════════╤════════════════════╤═══════════════════╤═════════╤════════════════════╕
   |   │ Metric_ID   │ Metric             │ Value             │ Unit    │   Peak (Empirical) │
   |   ╞═════════════╪════════════════════╪═══════════════════╪═════════╪════════════════════╡
   |   │ 4.1.0       │ VALU FLOPs         │                   │ Gflop/s │           61286.40 │
   |   ├─────────────┼────────────────────┼───────────────────┼─────────┼────────────────────┤
   |   │ 4.1.1       │ MFMA FLOPs (F64)   │                   │ Gflop/s │          108544.33 │
   |   ├─────────────┼────────────────────┼───────────────────┼─────────┼────────────────────┤
   |   │ 4.1.2       │ MFMA FLOPs (F32)   │                   │ Gflop/s │          104531.42 │
   |   ├─────────────┼────────────────────┼───────────────────┼─────────┼────────────────────┤
   |   │ 4.1.3       │ MFMA FLOPs (F16)   │                   │ Gflop/s │          709169.38 │
   |   ├─────────────┼────────────────────┼───────────────────┼─────────┼────────────────────┤
   |   │ 4.1.4       │ MFMA FLOPs (BF16)  │ 0.0               │ Gflop/s │          388161.09 │
   |   ├─────────────┼────────────────────┼───────────────────┼─────────┼────────────────────┤
   |   │ 4.1.5       │ MFMA FLOPs (F8)    │ 0.0               │ Gflop/s │         1446089.60 │
   |   ├─────────────┼────────────────────┼───────────────────┼─────────┼────────────────────┤
   |   │ 4.1.6       │ MFMA IOPs (Int8)   │                   │ Giop/s  │          737317.94 │
   |   ├─────────────┼────────────────────┼───────────────────┼─────────┼────────────────────┤
   |   │ 4.1.7       │ HBM Bandwidth      │                   │ Gb/s    │            3231.95 │
   |   ├─────────────┼────────────────────┼───────────────────┼─────────┼────────────────────┤
   |   │ 4.1.8       │ L2 Cache Bandwidth │                   │ Gb/s    │           19096.81 │
   |   ├─────────────┼────────────────────┼───────────────────┼─────────┼────────────────────┤
   |   │ 4.1.9       │ L1 Cache Bandwidth │ 3880.358726762844 │ Gb/s    │           25006.24 │
   |   ├─────────────┼────────────────────┼───────────────────┼─────────┼────────────────────┤
   |   │ 4.1.10      │ LDS Bandwidth      │                   │ Gb/s    │           54920.88 │
   |   ╘═════════════╧════════════════════╧═══════════════════╧═════════╧════════════════════╛
   ├─ 4.2 Roofline AI Plot Points:
   |   ╒═════════════╤══════════════════════╤═════════╤════════════╕
   |   │ Metric_ID   │ Metric               │ Value   │ Unit       │
   |   ╞═════════════╪══════════════════════╪═════════╪════════════╡
   |   │ 4.2.0       │ AI HBM               │         │ Flops/byte │
   |   ├─────────────┼──────────────────────┼─────────┼────────────┤
   |   │ 4.2.1       │ AI L2                │         │ Flops/byte │
   |   ├─────────────┼──────────────────────┼─────────┼────────────┤
   |   │ 4.2.2       │ AI L1                │         │ Flops/byte │
   |   ├─────────────┼──────────────────────┼─────────┼────────────┤
   |   │ 4.2.3       │ AI LDS               │         │ Flops/byte │
   |   ├─────────────┼──────────────────────┼─────────┼────────────┤
   |   │ 4.2.4       │ Performance (GFLOPs) │         │ Gflop/s    │
   |   ╘═════════════╧══════════════════════╧═════════╧════════════╛
The per-kernel analysis uses YAML-based metric evaluation for accurate calculations.
Analyze multiple kernels for comparison:
$ rocprof-compute analyze -p workloads/vcopy/MI200/ -k 0 1 2 -b 4
Roofline HTML generation
Roofline HTML plots are generated during analyze mode. Profile mode creates
roofline.csv containing microbenchmark data, and analyze mode uses this
data to produce interactive HTML roofline charts.
Note
Matrix multiplication performance data will vary depending on which architecture is profiled:
gfx9 (CDNA1/2/3/4) supports Matrix Fused MultiplyAdd (MFMA).
gfx10+ (RDNA3+) supports Wave Matrix Multiply Accumulate (WMMA).
CDNA4+ also supports Microscaling formats, which can be identified by the “MX” prefix in datatypes. More details and other resources about MX per CDNA architecture can be found at AMD CDNA Architecture.
Additionally, the cache level data available for analysis is dependent on the memory hierarchy levels of the architecture. See the CDNA Performance Model or RDNA Performance Model pages to view more information about the hardware blocks and cache levels supported in each architecture.
Two-step workflow:
# Step 1: Profile to generate roofline.csv
$ rocprof-compute profile --name vcopy --roofline -- tests/vcopy -n 1048576 -b 256

# Step 2: Analyze to generate HTML roofline plots
$ rocprof-compute analyze -p workloads/vcopy/MI300A_A1/ -b 4
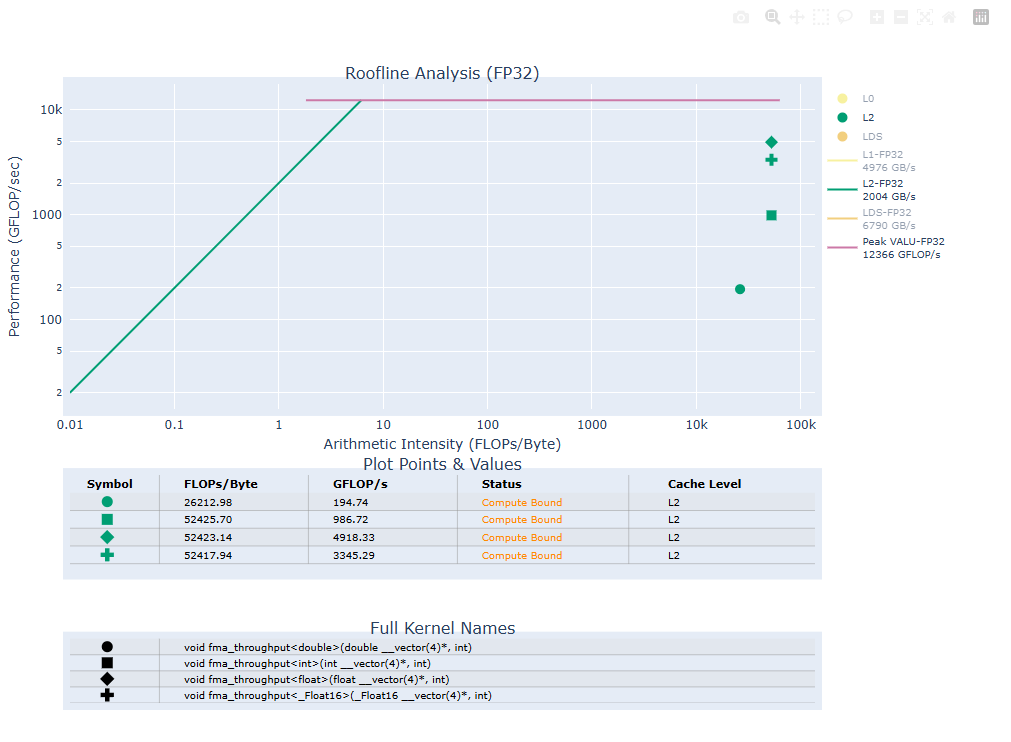
Interactive Roofline HTML:
Use the AI axis selector to choose one memory level per kernel, All peaks to plot every level at once, or Limited by to show each kernel’s limiting memory-level point (falling back to its leftmost point when no memory-level limiter is available). Isolating one kernel shows it across all available memory levels.
Use the Precision selector to choose one or more arithmetic precision’s peak roofline to display on the plot.
Use the Kernels and Bandwidth rooflines panels to isolate, multi-select, or reset plotted items. The Runtime shown slider filters to the heaviest kernels that reach the selected GPU resident-time cutoff.
Hover over kernel dots and rooflines to see arithmetic intensity, throughput, roofline percentage, limiter, runtime, bandwidth, and compute-peak details.
Drag to pan, scroll to zoom, double-click or use Reset zoom to re-frame the chart, use Export PNG to save the current view, and use Theme toggle to switch between light and dark modes.
Below is an example of the interactive HTML plot:
Baseline comparison
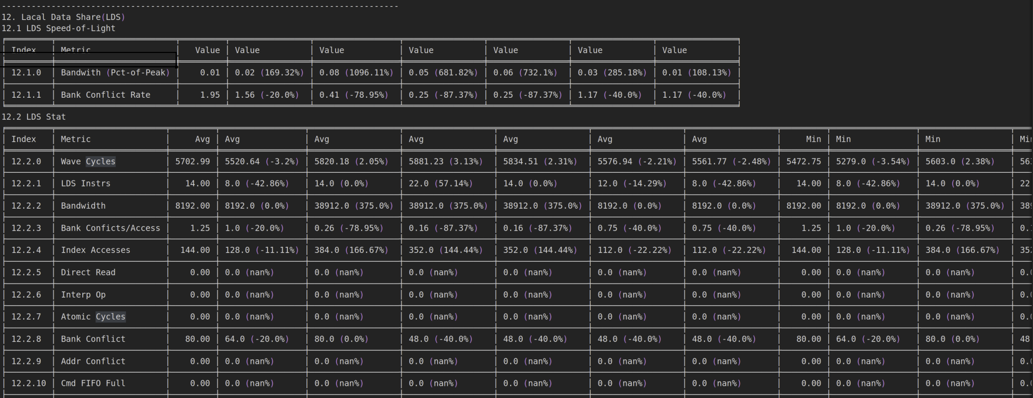
Baseline comparison allows for checking A/B effect. Currently baseline comparison is limited to the same SoC. Cross-comparison between SoCs is in development.
For both the Current Workload and the Baseline Workload, you can independently setup the following filters to allow fine grained comparisons:
Workload Name with
--pathGPU ID filtering (multi-selection) with
--gpu-idKernel Name filtering (multi-selection) with
--kernelDispatch ID filtering (regex filtering) with
--dispatchROCm Compute Profiler panels/blocks (multi-selection) with
--block
rocprof-compute analyze -p [path1] [path2] … [pathN]
rocprof-compute analyze -p [path1] [options for path1] ... -p [pathN] [options for pathN]
Examples:
rocprof-compute analyze -p workloads/workload_1/gpu_arch/ -k 0 -b 2 -p workloads/workload_2/gpu_arch/ -k 1 -b 2
rocprof-compute analyze -p workloads/workload_1/gpu_arch/ workloads/workload_2/gpu_arch/ ... workloads/workload_7/gpu_arch/ -b 12
Analysis output format#
Use the --output-format <format> analyze mode option to specify the output format of the
analysis report. Supported formats are stdout, txt, csv, and db. The default output
format is stdout.
--list-stats is available only with stdout and txt output.
--list-operators and --operator are available only with stdout.
stdoutformat:Print analysis report to the terminal.
NOTE: This option will not generate any file or folder.
txtformat:Generate a file named
rocprof_compute_<uuid>.txtin the current working directory.This file contains the entire analysis report as printed on the terminal.
This is useful in case of searching across long analysis reports.
NOTE: This option will disable output of analysis report to terminal.
csvformat:Generate a folder named
rocprof_compute_<uuid>in the current working directory.This folder contains one CSV file per view defined in the analysis database schema.
For a PC-sampled workload it also holds each kernel’s disassembly and source, and the samples per source line; see Per-kernel ISA and source in CSV output and Per-source-line counts in CSV output.
This is useful for further programmatic analysis of analysis reports.
NOTE: This option will disable output of analysis report to terminal.
dbformat:Generate a file named
rocprof_compute_<uuid>.dbin the current working directory.This is a SQLite database file containing all the data in the analysis report structured according to analysis database schema.
This is useful for further programmatic analysis of analysis reports.
NOTE: This option will disable output of analysis report to terminal.
Default file/folder name rocprof_compute_<uuid> can be overridden using --output-name <name> analyze mode option. For csv format the name is used as the output folder; for db format the name is used with a .db suffix.
Analysis database schema#
Analysis database tables
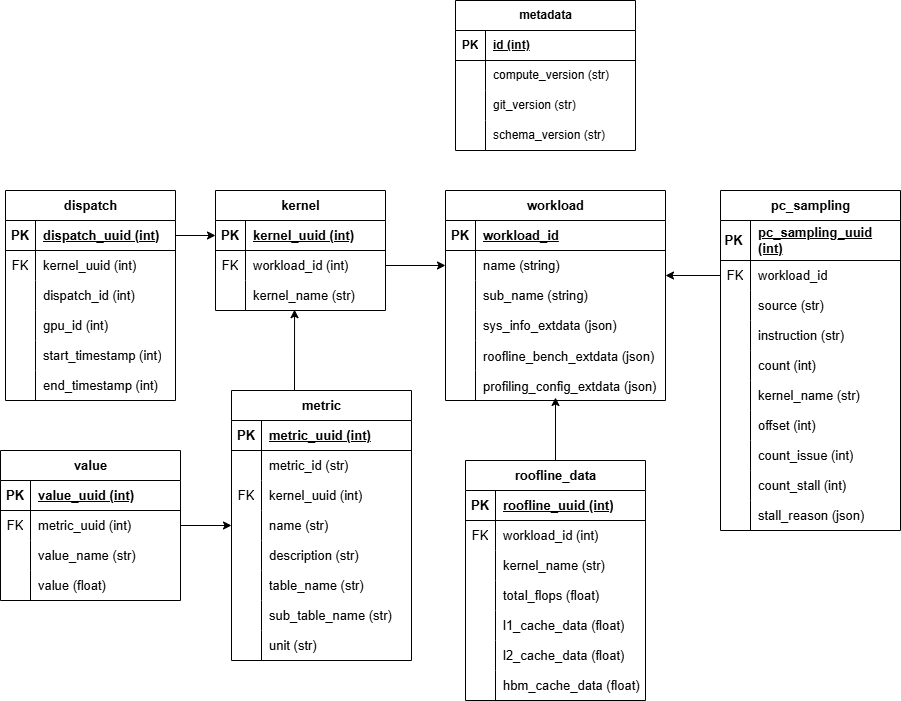
Analysis database views
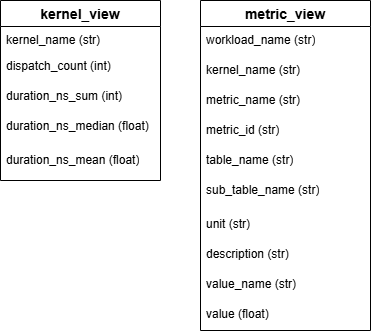
Analysis database example
Note
Some metrics cannot be calculated when corresponding counters are missing as shown in the warnings below
Note
It is possible to merge the analysis data dump for multiple workload folders (resulting from multiple profiles) by repeating -p option for each workload
$ rocprof-compute analyze --verbose --output-name test --output-format db -p workloads/nbody/MI300X_A1 -p workloads/nbody1/MI300X_A1
DEBUG Execution mode = analyze

                                 __                                       _
_ __ ___   ___ _ __  _ __ ___  / _|       ___ ___  _ __ ___  _ __  _   _| |_ ___
| '__/ _ \ / __| '_ \| '__/ _ \| |_ _____ / __/ _ \| '_ ` _ \| '_ \| | | | __/ _ \
| | | (_) | (__| |_) | | | (_) |  _|_____| (_| (_) | | | | | | |_) | |_| | ||  __/
|_|  \___/ \___| .__/|_|  \___/|_|        \___\___/|_| |_| |_| .__/ \__,_|\__\___|
               |_|                                           |_|

   INFO Analysis mode = db
   INFO ed45b0b189
DEBUG [omnisoc init]
   INFO ed45b0b189
DEBUG [omnisoc init]
DEBUG [analysis] prepping to do some analysis
   INFO [analysis] deriving rocprofiler-compute metrics...
DEBUG Collected roofline ceilings
WARNING PC sampling data not found for /app/projects/rocprofiler-compute/workloads/nbody/MI300X_A1.
WARNING PC sampling data not found for /app/projects/rocprofiler-compute/workloads/nbody1/MI300X_A1.
DEBUG Collected dispatch data
DEBUG Applied analysis mode filters
DEBUG Calculated dispatch data
DEBUG Collected metrics data
WARNING Failed to evaluate expression for 3.1.39 - Value: to_round((to_avg(
   (pmc_df.get("pmc_perf_ACCUM") / pmc_df.get("SQC_ICACHE_REQ")).where((pmc_df.get("SQC_ICACHE_REQ") != 0), None)) * 100), 0) - unsupported operand type(s) for /: 'NoneType' and 'float'
WARNING Failed to evaluate expression for 3.1.39 - Value: to_round((to_avg(
   (pmc_df.get("pmc_perf_ACCUM") / pmc_df.get("SQC_ICACHE_REQ")).where((pmc_df.get("SQC_ICACHE_REQ") != 0), None)) * 100), 0) - unsupported operand type(s) for /: 'NoneType' and 'float'
DEBUG Calculated metric values
DEBUG Calculated roofline data points
DEBUG [analysis] generating analysis
DEBUG SQLite database initialized with name: test.db
DEBUG Initialized database: test.db
   INFO ed45b0b189
   INFO ed45b0b189
DEBUG Completed writing database
WARNING Created file: test.db
PyTorch operator analysis#
Warning
These options require --experimental. After profiling with
--experimental --trace-ml-api torch (see Hierarchical operator names),
use rocprof-compute analyze ... --experimental with
--list-operators torch or --operator as needed.
If you pass both --list-operators and --operator, rocprof-compute
lists the operators and ignores --operator.
List all operators#
Display all PyTorch operators captured during profiling:
$ rocprof-compute analyze --experimental --list-operators torch --path ./workload

================================================================================
PyTorch Operator Call Tree: ./workload
Sorted by total GPU kernel duration.
================================================================================

nn.Module.Net.forward main.py:60 (calls: 10, dispatches: 90, total: 42.80 ms, dispatch_mean: 0.48 ms, dispatch_min: 0.01 ms, dispatch_max: 2.10 ms)
   ├─ aten::convolution (calls: 20)
   |  └─ conv2d_fwd (id 0) (dispatches: 40, total: 27.08 ms)
   ├─ aten::addmm (calls: 20)
   |  └─ gemm (id 1) (dispatches: 20, total: 15.41 ms)
   └─ aten::relu (calls: 40)
      └─ relu_kernel (id 2) (dispatches: 30, total: 0.31 ms)

Operator summary (Min/Max/Mean are per-dispatch over the subtree; sorted by Total):
╒══════════════════════════════════════════════════╤═════════╤══════════════╤══════════╤═══════════╤═════════════╤═════════╤═════════╤═════════╕
│ Operator                                         │   Calls │   Dispatches │    Total │   % Total │   Mean/Call │    Mean │     Min │     Max │
╞══════════════════════════════════════════════════╪═════════╪══════════════╪══════════╪═══════════╪═════════════╪═════════╪═════════╪═════════╡
│ nn.Module.Net.forward                            │      10 │           90 │ 42.80 ms │    100.00 │     4.28 ms │ 0.48 ms │ 0.01 ms │ 2.10 ms │
├──────────────────────────────────────────────────┼─────────┼──────────────┼──────────┼───────────┼─────────────┼─────────┼─────────┼─────────┤
│ nn.Module.Net.forward/aten::convolution          │      20 │           40 │ 27.08 ms │     63.27 │     1.35 ms │ 0.68 ms │ 0.21 ms │ 2.10 ms │
├──────────────────────────────────────────────────┼─────────┼──────────────┼──────────┼───────────┼─────────────┼─────────┼─────────┼─────────┤
│ nn.Module.Net.forward/aten::addmm                │      20 │           20 │ 15.41 ms │     36.00 │     0.77 ms │ 0.77 ms │ 0.13 ms │ 1.82 ms │
├──────────────────────────────────────────────────┼─────────┼──────────────┼──────────┼───────────┼─────────────┼─────────┼─────────┼─────────┤
│ nn.Module.Net.forward/aten::relu                 │      40 │           30 │  0.31 ms │      0.72 │     7.70 us │ 0.01 ms │ 0.01 ms │ 0.02 ms │
╘══════════════════════════════════════════════════╧═════════╧══════════════╧══════════╧═══════════╧═════════════╧═════════╧═════════╧═════════╛
The call tree is sorted by GPU time. Repeated calls that ran the same operators and kernels are shown once, with their combined counts. Each operator shows the source file and line it was called from, when available, and each kernel appears under the operator that launched it. See Hierarchical operator names for how operators are captured.
The flat Operator summary table below the call tree has one row per
operator that ran at least one GPU kernel. Time cells auto-switch between
milliseconds and microseconds per cell; missing values render as N/A.
Operator — the operator’s full call path (for example
nn.Module.Net.forward/aten::addmm).Calls — how many times the operator was called.
Dispatches — how many GPU kernels ran while the operator was on the call stack (kernels launched by operators it called also count).
Total — total GPU time spent while the operator was on the call stack.
% Total — share of the workload’s total GPU time spent while this operator was on the call stack. Because the same kernel time is counted for an operator and for any operator that called it, the column can add up to more than 100%.
N/Awhen no GPU time was recorded.Mean/Call — average GPU time per call to this operator.
Mean / Min / Max — per-kernel-dispatch timings across all kernels launched while this operator was on the call stack.
When no operator has any recorded dispatches, the table is replaced by the
line Operator summary: (no operators with recorded dispatches).
Filtering by Operator#
--operator selects operators with shell-style glob patterns. Matching is
case-sensitive. A pattern can match an operator’s name or its full call path,
such as nn.Module.Net.forward/aten::addmm.
A prefix limits a pattern to one framework, as in torch:*relu*. A pattern
without a prefix uses the prefix before it. If no prefix comes before it, the
pattern matches every traced framework and user ROCTx regions.
Wildcard —
*relu*matches any operator whose name containsrelu.Call path —
*/aten::addmmmatchesaten::addmmwhen another operator calls it.Exact —
aten::addmmMatch all — no arguments, or
**
rocprof-compute prints the call tree of the matching operators. The metric tables then cover only the kernels that those operators launched. To narrow the metric tables further:
-kkeeps only the listed kernels. Use the(id N)shown next to each kernel in the operator tree.-dkeeps only the listed dispatches that the matching operators launched.--list-statslists only the kernels that the matching operators launched.
These options do not change the printed operator tree. Kernel IDs depend on
-d, so use the same -d when you look up a kernel ID.
# Match PyTorch operators only
$ rocprof-compute analyze --experimental --operator 'torch:*relu*' --path ./workload

# Match a call path in every traced framework
$ rocprof-compute analyze --experimental --operator '*/aten::addmm' --path ./workload

# Match every operator (no arguments)
$ rocprof-compute analyze --experimental --operator --path ./workload
Filter multiple operators. Here *relu* uses the torch: prefix
before it:
$ rocprof-compute analyze --experimental \
    --operator 'torch:*conv*' '*relu*' 'triton:*matmul*' --path ./workload
User ROCTx regions#
Every --trace-ml-api run also records the ROCTx ranges that your
application adds. The user prefix selects them.
--list-operators user lists each user ROCTx region with everything that
ran inside it. --operator 'user:PATTERN' selects the regions whose name
matches PATTERN. The result includes all operators and kernels inside each
region. A framework pattern such as torch:*relu* keeps only that
framework’s operators below a match. Other patterns in the same command add
more operators. They never remove anything from a selected region.
$ rocprof-compute analyze --experimental --list-operators user torch --path ./workload

$ rocprof-compute analyze --experimental \
    --operator 'user:*UserDefined*' --path ./workload

$ rocprof-compute analyze --experimental \
    --operator 'user:*UserDefined*' 'torch:*relu*' --path ./workload
Triton operator analysis#
After profiling with --experimental --trace-ml-api triton (see
Triton trace), use --list-operators triton and
--operator 'triton:PATTERN', such as --operator 'triton:*rmsnorm_kernel*'.
They show only Triton kernels.
Debug options#
Debug options help you troubleshoot ROCm Compute Profiler itself, rather than analyze your workload. They are hidden from the help output. To list them, run:
$ rocprof-compute analyze --debug --help
To use a debug option, pass it on its own; --debug is not required:
$ rocprof-compute analyze -p workloads/vcopy/MI200/ -b 3 --debug-table-view
Analyze mode has these debug options:
--debug-metric-expression: Print the counter data, and each metric’s expression and inputs.--debug-table-view: Print every block as plain tables, including blocks that are normally drawn as a memory chart or a per-kernel roofline layout.--debug-verify-deps: Check that the Python dependencies of analyze mode are installed, then exit. It doesn’t need--path.