What is ROCm Compute Profiler?#
ROCm Compute Profiler is a kernel-level profiling tool for machine learning and high performance computing (HPC) workloads running on AMD Instinct™ GPUs. It measures how efficiently a single GPU kernel dispatch uses the underlying hardware: compute unit occupancy, cache and memory bandwidth utilization, instruction mix, and achieved versus peak arithmetic throughput.
This kernel-level view matters once you already know which kernel is worth optimizing. Where ROCm Systems Profiler characterizes an entire application to find where time goes, ROCm Compute Profiler drills into a specific dispatch to explain why it runs at the speed it does, down to the hardware block level.
AMD Instinct MI-Series GPUs are data center-class GPUs designed for compute and have some graphics capabilities disabled or removed. ROCm Compute Profiler primarily targets use with GPUs in the AMD Instinct MI300, MI200, and MI100 Series. Development is in progress to support Radeon™ (RDNA) GPUs.
ROCm Compute Profiler is built on top of ROCprofiler-SDK to monitor hardware performance counters. For the full performance-model reference, see Performance model.
How it works#
ROCm Compute Profiler is a Python-based tool that profiles an application in up to two
stages: it first replays the application as many times as needed to collect the requested
hardware counters per kernel dispatch, then, unless disabled with --no-roof, runs a set
of accelerator-specific micro-benchmarks to establish the empirical roofline. The roofline
model is not available on accelerators pre-MI200. See profiling-routine for the exact
stage breakdown.
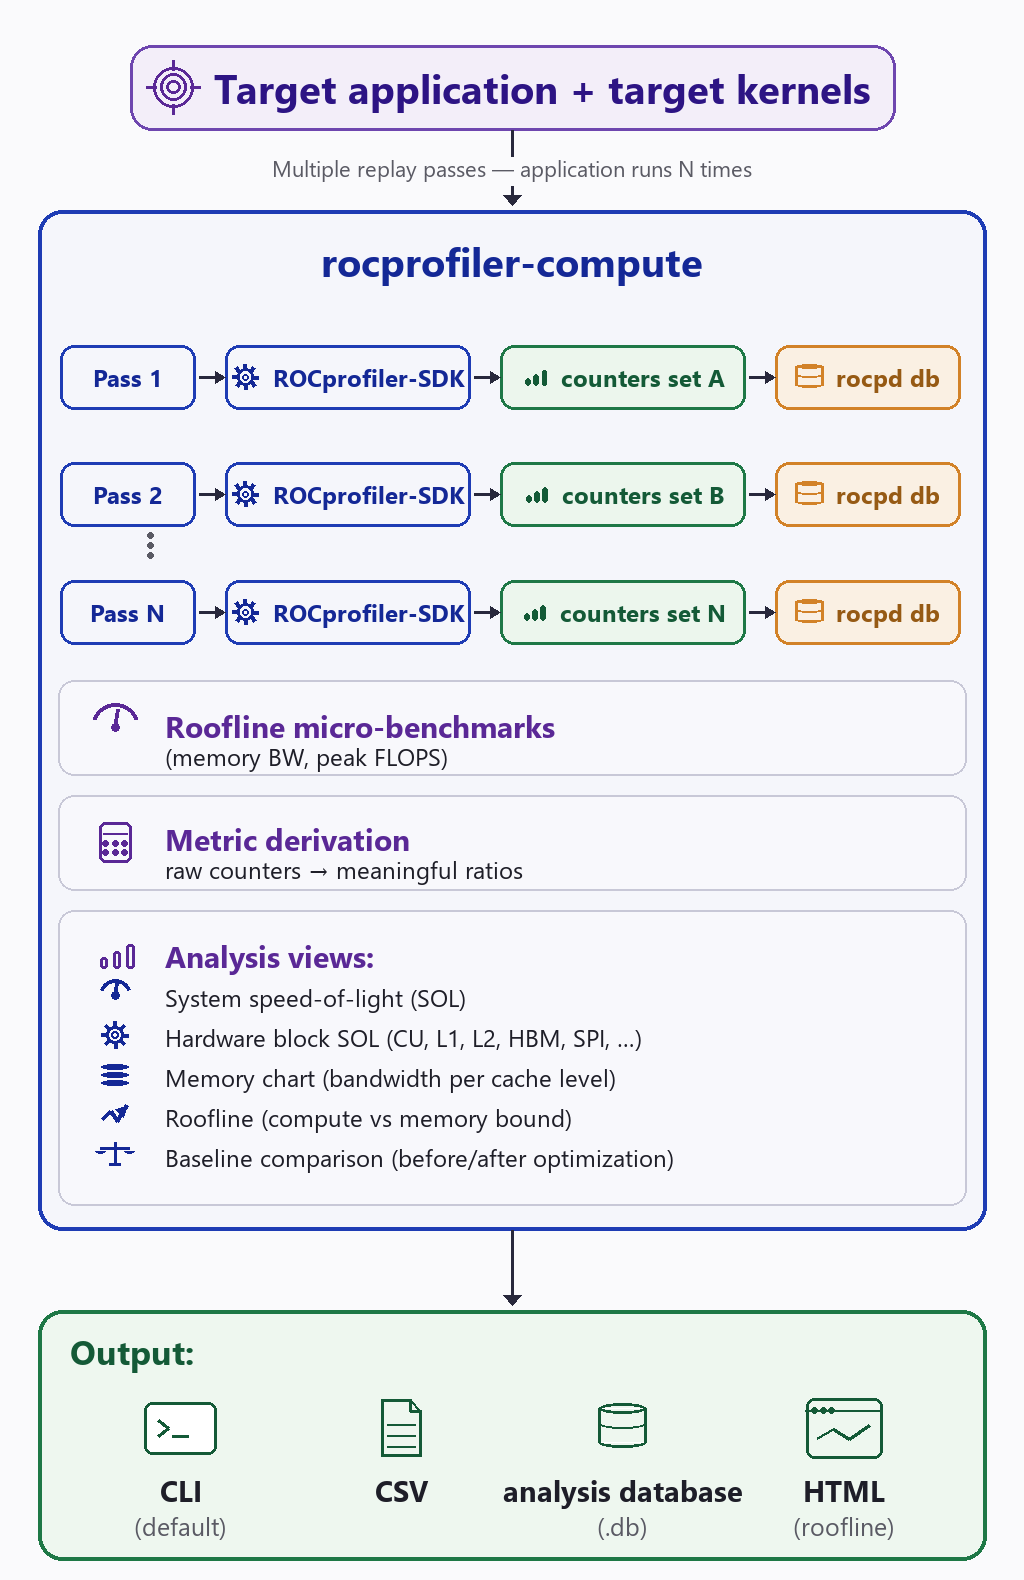
Counter collection is performed by injecting two libraries into the target process alongside ROCprofiler-SDK: a native tool (librocprofiler-compute-tool.so) that collects hardware performance counters per dispatch, and an SDK tool (librocprofiler-sdk-tool.so) that handles kernel tracing and output database generation. See Configuring the environment for profiling for the full backend and library breakdown.
Warning
Because associating counters with a specific kernel dispatch requires serializing dispatches, kernels launched on separate HIP streams on the same GPU don’t execute concurrently while profiling. Profiled kernel duration and utilization metrics reflect this serialized execution, not the concurrent behavior of a normal run. See the full warning and its consequences in Profile mode.
Once counters are collected, ROCm Compute Profiler derives higher-level metrics, such as utilizations and ratios, from the raw counter values to populate the analysis views described next.
ROCm Compute Profiler standalone GUI analyzer (experimental)#
ROCm Compute Profiler provides a standalone GUI to enable basic performance analysis.
Key features#
The feature set is documented across several how-to and conceptual pages; this table is a quick index into them.
Feature |
Description |
See also |
|---|---|---|
Kernel-level counter collection |
Collects hardware performance counters per kernel dispatch, replaying the application as many times as needed to gather every requested counter. |
|
System and hardware block Speed-of-Light |
Compares achieved utilization against theoretical peak, both for overall GPU throughput and for individual hardware blocks such as the command processor, workgroup manager, and caches. |
|
Memory chart analysis |
Visualizes transaction counts and bandwidth at each level of the memory hierarchy. |
|
Empirical roofline analysis |
Benchmarks achievable peak compute throughput and memory bandwidth, then plots kernel arithmetic intensity against that roofline. |
|
Wavefront and instruction mix analysis |
Reports launch and runtime statistics, and the breakdown of VALU, VMEM, scalar, and matrix instructions issued by a kernel. |
|
Baseline comparison |
Compares two or more profiled runs of the same SoC side by side to check the effect of a code change. |
|
Multiple analysis interfaces |
The command line and ROCm Optiq both read the same profiling output. |
|
Iteration multiplexing |
Collects a large number of performance counters with minimal profiling overhead by splitting counter collection across kernel iterations instead of full application replays. |
Analysis views#
ROCm Compute Profiler’s analysis report is organized into the following views:
View |
What it tells you |
See also |
|---|---|---|
System Speed-of-Light |
What percentage of the GPU’s theoretical peak performance the kernel achieves, across compute and memory subsystems. |
|
Hardware block Speed-of-Light |
Which specific hardware block — the compute unit, a cache level, the command processor, or the workgroup manager — is the bottleneck for a kernel, based on utilization and stall metrics for that block. |
|
Memory chart |
Read, write, and atomic transaction counts, hit rates, and latencies at each level of the memory hierarchy: LDS, the L1 caches, the L2 cache, and HBM. |
|
Roofline |
Classifies whether a kernel is compute-bound or memory-bound, and plots its exact position against attainable peak compute throughput and memory bandwidth; combine with kernel filtering for a per-kernel breakdown. |
|
Wavefront analysis |
Launch statistics (grid size, workgroup size, VGPR/AGPR/SGPR usage) and runtime statistics (wavefront occupancy, active cycles) for profiled kernels. |
|
Instruction mix |
Breakdown of VALU, VMEM, scalar, LDS, and matrix (MFMA/WMMA) instructions issued by a kernel. |
|
Baseline comparison |
Side-by-side comparison of any of the preceding views across two or more profiled runs of the same SoC — for example, before and after an optimization. |
Key commands#
ROCm Compute Profiler exposes two primary modes on the rocprof-compute executable: profile to collect data, and analyze to read it back. See Modes for the full list of modes and Basic operations for the required arguments per operation.
The following are key profile and analyze commands:
To profile
./app, collecting all available counters for all kernels, and write results toworkloads/my_run/<SoC>/:$ rocprof-compute profile -n my_run -- ./app
To profile only kernels whose name matches
vecCopy:$ rocprof-compute profile -n my_run -k vecCopy -- ./app
To profile only the 1st, 2nd, and 3rd dispatch of each kernel:
$ rocprof-compute profile -n my_run -d 1 2 3 -- ./app
To profile only the counters needed for specific analysis report blocks, which speeds up the profiling run:
$ rocprof-compute profile -n my_run -b 2 5 -- ./app
To run only the roofline micro-benchmarks, skipping standard counter collection:
$ rocprof-compute profile -n my_run --roof-only -- ./app
To analyze a profiled run in the terminal:
$ rocprof-compute analyze -p workloads/my_run/MI300X/
To write the analysis to a SQLite analysis database instead of printing to the terminal:
$ rocprof-compute analyze -p workloads/my_run/MI300X/ --output-format db
To compare two profiled runs of the same SoC side by side:
$ rocprof-compute analyze -p run_a/MI300X/ run_b/MI300X/
For full walkthroughs, see Profile mode and CLI analysis.
Flags reference#
ROCm Compute Profiler supports many flags for filtering kernels, dispatches, and
hardware blocks during profiling and analysis, and for selecting the analysis output
format. See Profile mode for the full list of profile mode flags and
Analyze mode for analyze mode flags, or run rocprof-compute profile -h
or rocprof-compute analyze -h for the complete set.
Output formats#
analyze accepts an --output-format option for the analysis report. The following table lists the available values, plus the HTML roofline plots that analyze writes automatically, and the rocpd database that profile always writes:
Format |
Produced by |
Description |
|---|---|---|
|
profile |
SQLite database of raw counters per dispatch, written automatically. Required for |
|
analyze |
Analysis results printed to the terminal only. |
|
analyze |
Analysis results written to a |
|
analyze |
Analysis results written to a folder of CSV files. Requires the workload’s |
|
analyze |
Analysis results written to a |
|
analyze |
Standalone Plotly roofline plot(s) ( |
Select the analyze output format with --output-format and override the file name with --output-name. See Analysis output format for details.
Supported hardware#
Roofline micro-benchmark support varies by SoC family independently of general counter and Speed-of-Light support. See Compatible GPUs/APUs for the full, tool-wide support table.
SoC family |
Counters / SOL support |
Roofline support |
Notes |
|---|---|---|---|
AMD Instinct™ MI350 Series (CDNA4, gfx950) |
✅ |
✅ |
Full feature support; MI350P support introduced in ROCm Compute Profiler 3.6.0. |
AMD Instinct MI300 Series (CDNA3) |
✅ |
✅ |
Full feature support. |
AMD Instinct MI200 Series (CDNA2) |
✅ |
✅ |
Full feature support. |
AMD Instinct MI100 Series (CDNA1) |
✅ |
❌ |
Roofline micro-benchmarks require MI200 or later. See Standalone roofline. |
AMD Ryzen™ AI Max / Ryzen AI Max+ 300 and 400 Series and Ryzen AI 5/7 PRO 4xx Series (Strix/Halo, Gorgon/Halo; gfx1150/gfx1151/gfx1152/gfx1153) |
✅ |
✅ |
Full feature support; roofline benchmarking for gfx1150 and gfx1152 was added in ROCm Compute Profiler 3.7.0, with the gfx1151 (Strix Halo) gap closed in 3.8.0. Uses Wave Matrix Multiply Accumulate (WMMA) in place of MFMA. |
AMD Instinct MI50, MI60 (Vega 20) |
❌ |
❌ |
— |