FAQ#
Frequently asked questions and troubleshooting tips.
Why does VALU utilization exceed the theoretical peak?#
In specific circumstances, the GPU can co-issue two VALU instructions in the same clock cycle. This may result in an observed VALU Utilization and FP64 VALU FLOP values above the theoretical peak. This is expected hardware behavior and not a measurement error.
This dual-issue capability can be further investigated via:
ROCm Compute Viewer: The Instructions view shows when two instructions are issued to the VALU in the same cycle.
On MI350 and newer platforms: Starting in ROCm 7.2.0, the
Dual-issue VALU Utilizationmetric shows the % of time when VALU is executing dual-issued instructions.
When ROCm Compute Profiler detects values exceeding their theoretical peaks, it displays a warning message indicating this behavior.
What does “Counter variance corrected” mean?#
When profiling, you may see the following warning:
WARNING: Counter variance corrected: X value(s) adjusted (max Y% deviation from multi-pass collection).
This indicates that ROCm Compute Profiler detected and corrected negative values in derived metrics. This is expected behavior, not an error.
Why does this happen?
Hardware performance counters are collected across multiple profiling passes. When calculating derived metrics that involve subtraction (such as A - B), small run-to-run variance can occasionally produce negative results. Since negative event counts are physically impossible, these values are automatically clamped to zero.
When should I be concerned?
Deviation < 1%: Normal hardware variance. No action needed.
Deviation ≥ 1%: The warning is displayed. Results are still valid, but variance was higher than typical.
Deviation > 5%: Consider investigating profiling conditions (system load, thermal throttling, non-deterministic application behavior, etc.).
This correction primarily affects L2 cache metrics where counter subtraction is used to derive values like remote read/write traffic, but run-to-run variations may impact the accuracy of a number of derived metrics in ROCm Compute Profiler.
How do compute and memory partition modes affect metrics?#
On AMD Instinct MI300 and MI350 series GPUs, the active partition modes change how counters are normalized and how percent-of-peak metrics are calculated. See Compute and memory partition modes in analysis.
Why does the CLI memory chart look wrapped or garbled?#
The chart is drawn at a fixed width and does not shrink to fit the terminal. When the window is too narrow, each chart line wraps onto the next row and the boxes and arrows stop lining up.
Widen the terminal until one chart line fits on a single row. If you cannot resize the window, see cli-memory-chart-viewing.
How can I SSH tunnel in MobaXterm?#
Open MobaXterm.
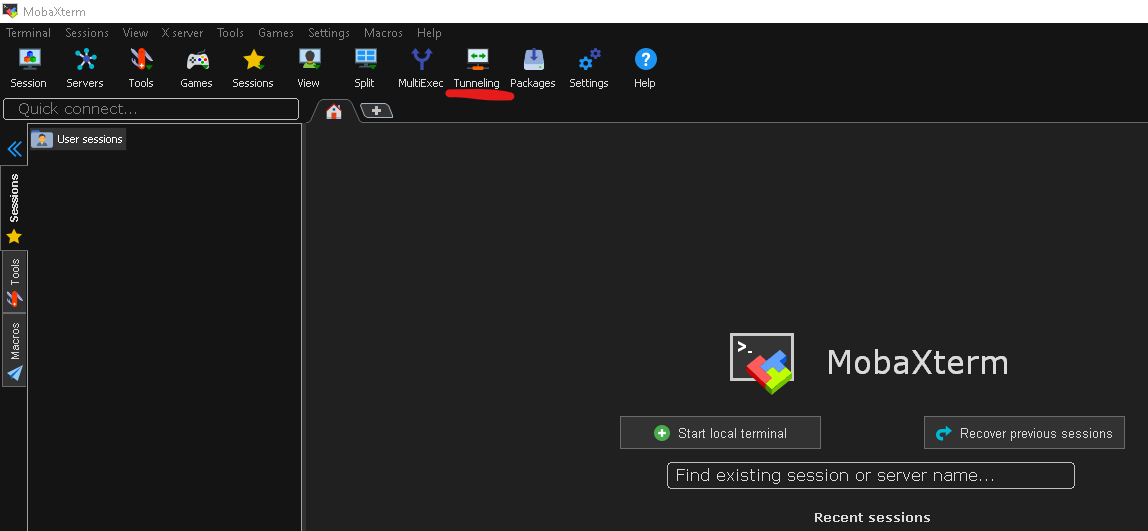
In the top ribbon, select Tunneling to access tunneling options.
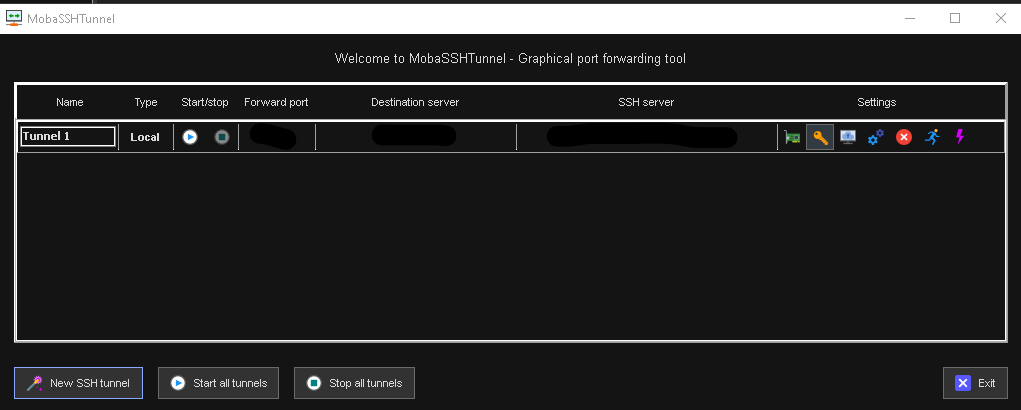
This pop-up should appear.
Select New SSH tunnel.
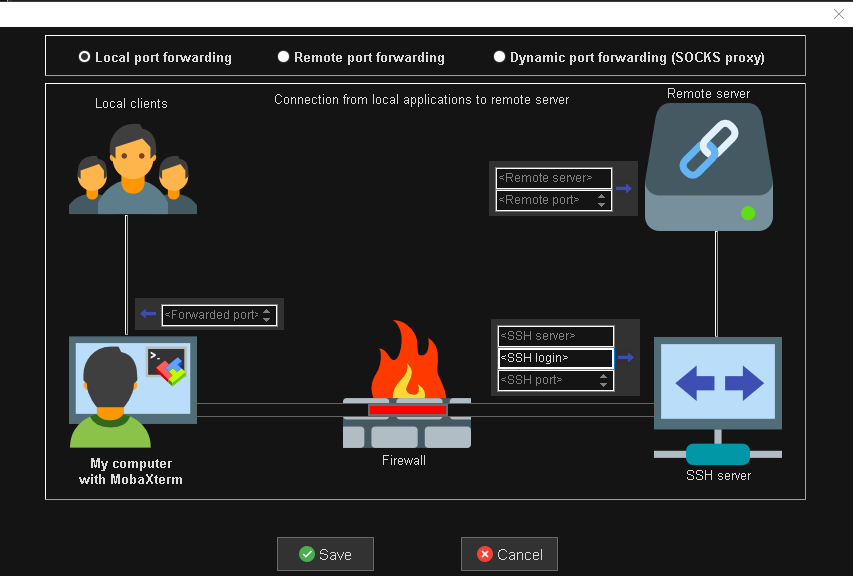
Configure the SSH tunnel.
- Local clients
<Forwarded port>:[PORT]
- Remote server
<Remote server>:localhost<Remote port>:[PORT]
- SSH server
<SSH server>: name of the server to connect to<SSH login>: username to login to the server<SSH port>:22
Why are kernels on separate HIP streams not executing concurrently during profiling?#
ROCm Compute Profiler collects GPU performance counters with kernel dispatch association which requires serializing kernel dispatches. Kernel dispatches are serialized across HIP streams on the same GPU during profiling so that only one kernel executes at a time on a given GPU. Streams on different GPUs are not serialized. As a result, kernels launched on separate HIP streams on the same GPU will run one after another during profiling. Kernel duration and throughput metrics reflect this serialized execution rather than the concurrent behavior that may occur during normal execution.
Why does profiling a vLLM workload produce empty performance counter data?#
vLLM V1 runs GPU kernels in a worker process that it terminates with a signal on shutdown, and counter data is only written when a process exits normally. See Profile vLLM workloads for the workaround and where it applies.
Why are TCP_REQ and other PMC counters zero?#
On some RDNA GPUs, the default AUTO performance level can gate the
perfmon clock. While that clock is gated, the hardware never increments
the affected performance counters, so values such as TCP_REQ,
TCP_REQ_READ, TCP_REQ_WRITE, and TCP_REQ_MISS – and the GL0
request metrics derived from them – report zero even when the kernel
issues global memory traffic.
This is a hardware power-gating behavior rather than a counter-collection defect. It has been observed on gfx115x (RDNA 3.5); the same AUTO gating is documented for Navi3x and Navi4x.
For the workaround, see Setting GPU performance level for PMC profiling in the ROCprofiler-SDK documentation.