ROCm profiling tools overview#
This topic provides an overview of the ROCm profiling tool suite, covering the six tools, their relationships, and their dependencies. The tools are complementary and designed to be used together in sequence, moving from coarse system-level characterization down to fine-grained instruction-level analysis.
For guidance on choosing the right tool for your performance investigation, see Choosing the right ROCm profiling tool.
The suite includes the following tools:
Tool |
Description |
|---|---|
A C++ library that provides the low-level profiling and tracing infrastructure. |
|
A command-line interface that exposes ROCprofiler-SDK capabilities without requiring any code changes, including advanced features such as ATT, PC Sampling, and SPM. |
|
A system-wide profiler that captures CPU, GPU, MPI, and OS activity in a unified timeline. |
|
A kernel-level analysis tool that collects hundreds of hardware counters and produces roofline, Speed-of-Light, and memory bandwidth analysis. |
|
A desktop GUI for visualizing instruction-level ATT data, showing wavefront execution timelines, ISA hotspots, and stall attribution at cycle granularity. |
|
A unified visualization application for exploring system- and kernel-level profiling data from rocprofiler-systems and rocprofiler-compute, with no ROCm installation required on the analysis machine. |
The ROCm profiling stack#
All user-facing tools are built on rocprofiler-sdk, which provides the
interception points into the ROCm runtime. The SDK itself depends on the ROCm
runtime layer (HIP, HSA, KFD). Tools are independent of each other — none of
the user-facing tools routes through another user-facing tool.
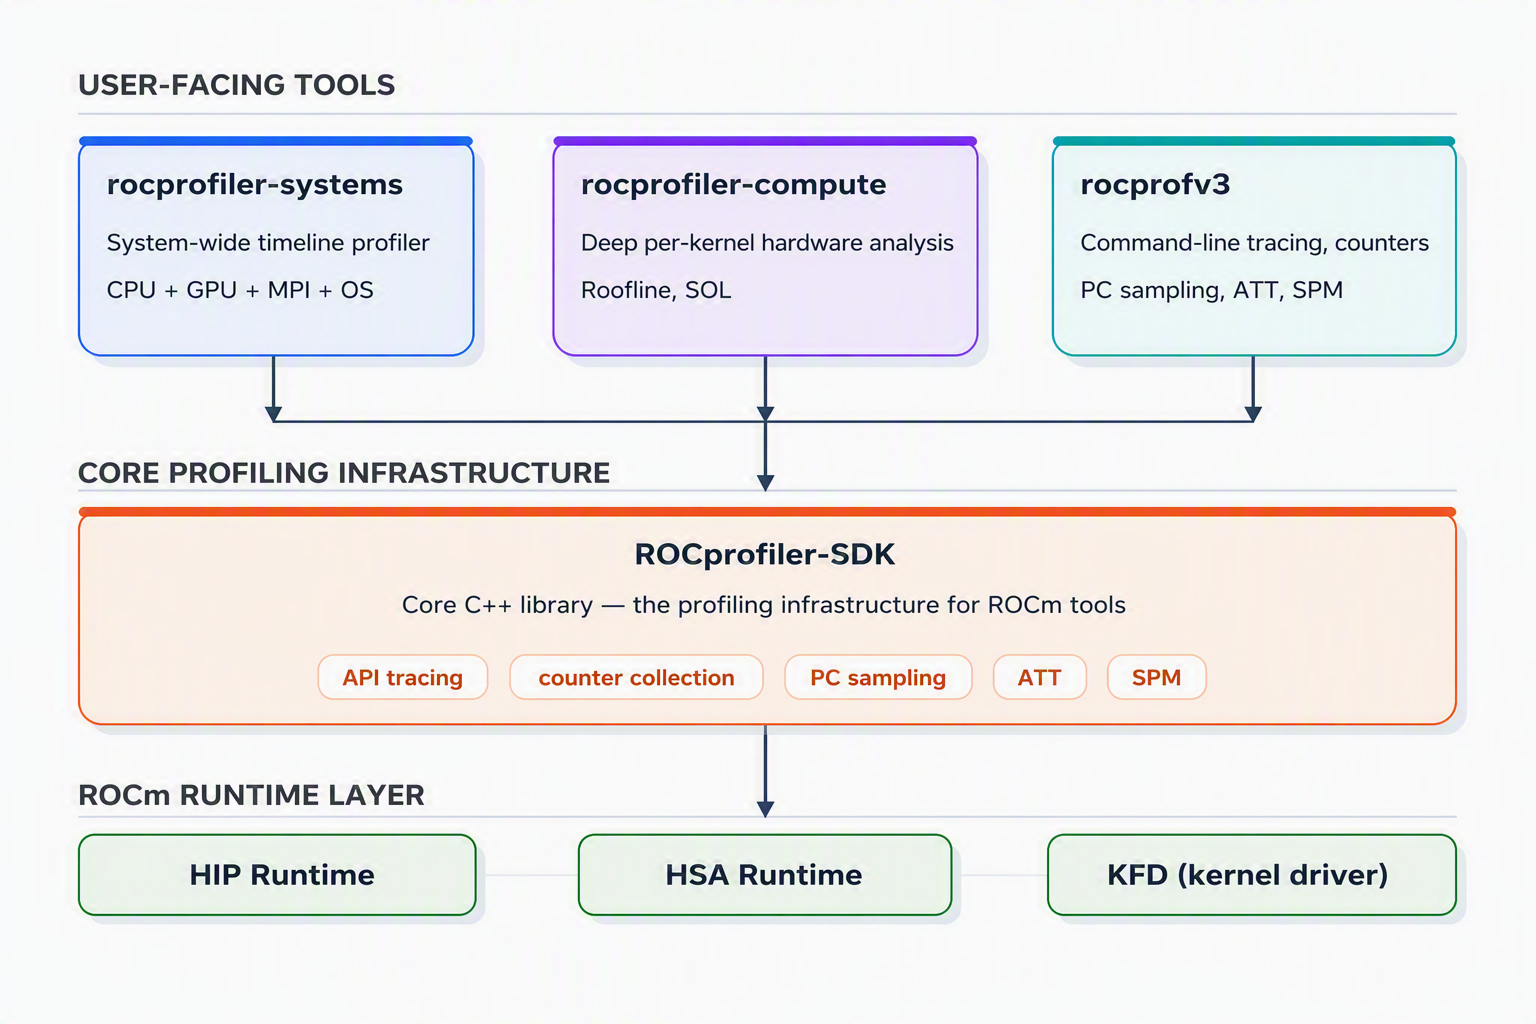
The three levels are:
ROCm runtime layer — HIP runtime, HSA runtime, and the KFD kernel driver. This is where GPU work is submitted and hardware access is gated.
ROCprofiler-SDK — The profiling infrastructure library. It intercepts API calls, reads hardware performance counters, streams PC samples, and captures Advanced Thread Trace data. All higher-level tools use this library.
User-facing tools —
rocprofv3,rocprofiler-systems, androcprofiler-computeeach build onrocprofiler-sdk. They differ in scope (instruction vs. kernel vs. system) and in how they present results.
Tools#
The following sections describe each tool in the ROCm profiling suite, covering what it does, who it’s for, and how it fits in the stack.
ROCprofiler-SDK#
ROCprofiler-SDK is a C++ library that provides the profiling and tracing infrastructure on which the ROCm profiling tools are built. It isn’t a user-facing tool; it’s an API consumed programmatically by tool developers, framework integrators, and advanced users. The library provides a unified, thread-safe interface for:
API tracing: interception and timing of HIP, HSA, ROCTx, and RCCL function calls
Hardware counter collection: per-kernel PMU performance counter reads from the GPU
Streaming Performance Monitoring (SPM): continuous hardware counter samples streamed into a ring buffer at a programmable interval, independent of kernel dispatch boundaries
PC sampling: periodic capture of the program counter and execution state of running GPU wavefronts
Advanced Thread Trace (ATT): instruction-level wavefront execution history
Correlation IDs: linking of profiling records across API boundaries and CPU/GPU timelines
Code object tracking: monitoring of GPU binary load and unload events
Most users interact with ROCprofiler-SDK indirectly through the higher-level tools. For guidance on when to use ROCprofiler-SDK directly, see When to choose ROCprofiler-SDK. For a quick overview, see What is ROCprofiler-SDK?.
rocprofv3#
rocprofv3 is the official command-line interface for rocprofiler-sdk.
It requires no source-code changes, no recompilation, and no tool library
development. Run your application under rocprofv3 and it writes structured
output files containing trace data, counter values, or samples. For guidance
on when to use rocprofv3, see When to choose rocprofv3.
For a quick overview, see
rocprofv3 — command-line profiling interface.
ROCm Systems Profiler#
ROCm Systems Profiler (rocprofiler-systems)
captures the entire application stack in a single unified timeline: CPU
function calls, GPU kernel dispatches, MPI collectives, OpenMP regions, memory
allocations, OS scheduling events, and GPU telemetry (temperature, power,
utilization, bandwidth).
This system-wide view is essential for workloads where the GPU is one component
among many. In a distributed training job, for example, the GPU may appear idle
not because the kernels are slow but because a data loader is starved, an MPI
collective is blocking, or Python GIL contention is stalling the dispatch queue.
For guidance on when to use rocprofiler-systems, see
When to choose ROCm Systems Profiler.
For an overview, see
What is ROCm Systems Profiler?.
Two instrumentation modes are available:
Dynamic binary instrumentation (
rocprof-sys-instrument) — inserts timing probes at every function entry and exit without source changes. Deterministic and complete, but carries higher overhead.Call-stack sampling (
rocprof-sys-sample) — periodically captures the CPU call stack at a configurable frequency. Lower overhead, statistical coverage; suitable for long-running production workloads.
ROCm Compute Profiler#
ROCm Compute Profiler (rocprofiler-compute)
performs deep per-kernel hardware analysis on AMD Instinct GPUs. Where
rocprofiler-systems shows which kernels are slow, rocprofiler-compute
explains why at the hardware level. For guidance on when to use
rocprofiler-compute, see
When to choose ROCm Compute Profiler.
For an overview, see
What is ROCm Compute Profiler?.
AMD Instinct GPUs expose hundreds of PMU counters across dozens of hardware
blocks (compute units, L1 cache, L2 cache, HBM controllers, shader processor
input, and more). Because the hardware multiplexers can’t read all counters
simultaneously, rocprofiler-compute replays the target application across
multiple passes, collecting a different counter subset on each pass, then
derives meaningful metrics from the aggregated values.
Visualization tools#
The ROCm profiling stack includes two dedicated visualization tools that operate
on the output produced by rocprofv3, rocprofiler-systems, and
rocprofiler-compute. They serve distinct purposes at different levels of the
analysis hierarchy.
Tool |
Input |
Level |
Primary use |
|---|---|---|---|
ROCprof Compute Viewer (RCV) |
|
Instruction-level |
Wavefront execution, ISA hotspots, stall analysis |
ROCm Optiq |
|
System- and kernel-level |
Timeline visualization, kernel metrics, CPU-GPU interaction |
ROCprof Compute Viewer#
ROCprof Compute Viewer (RCV) is a Qt
desktop GUI for visualizing ATT data collected by rocprofv3 --att. It
operates at the instruction level, below the kernel level, showing the execution
timeline of individual wavefronts across compute units.
RCV answers questions that counter-based analysis can’t: which specific ISA instruction is stalling, how wavefronts occupy execution pipelines over time, and where LDS bank conflicts or memory latency consumes cycles. For guidance on when to use RCV, see When to choose RCV. For a quick overview, see What is RCV?.
ROCm Optiq#
Note
ROCm Optiq is currently in beta and under active development.
ROCm Optiq is a unified desktop visualization
application for .db and .rpd profiling databases produced by
rocprofiler-systems and rocprofiler-compute. A key design goal is
portability: Optiq has no dependency on the ROCm stack, so trace files
collected on a GPU cluster can be analyzed on any Windows, Linux, or macOS
machine, including developer workstations without AMD hardware. For guidance
on when to use Optiq, see When to choose ROCm Optiq.
For a quick overview, see
What is ROCm Optiq?.
Tool relationships and dependencies#
This section covers the runtime dependencies of each tool and how their outputs connect across the investigation sequence.
Dependencies#
All user-facing tools depend directly on rocprofiler-sdk.
rocprofiler-systems additionally depends on OS-level and runtime-level data
sources for its cross-domain instrumentation capabilities.
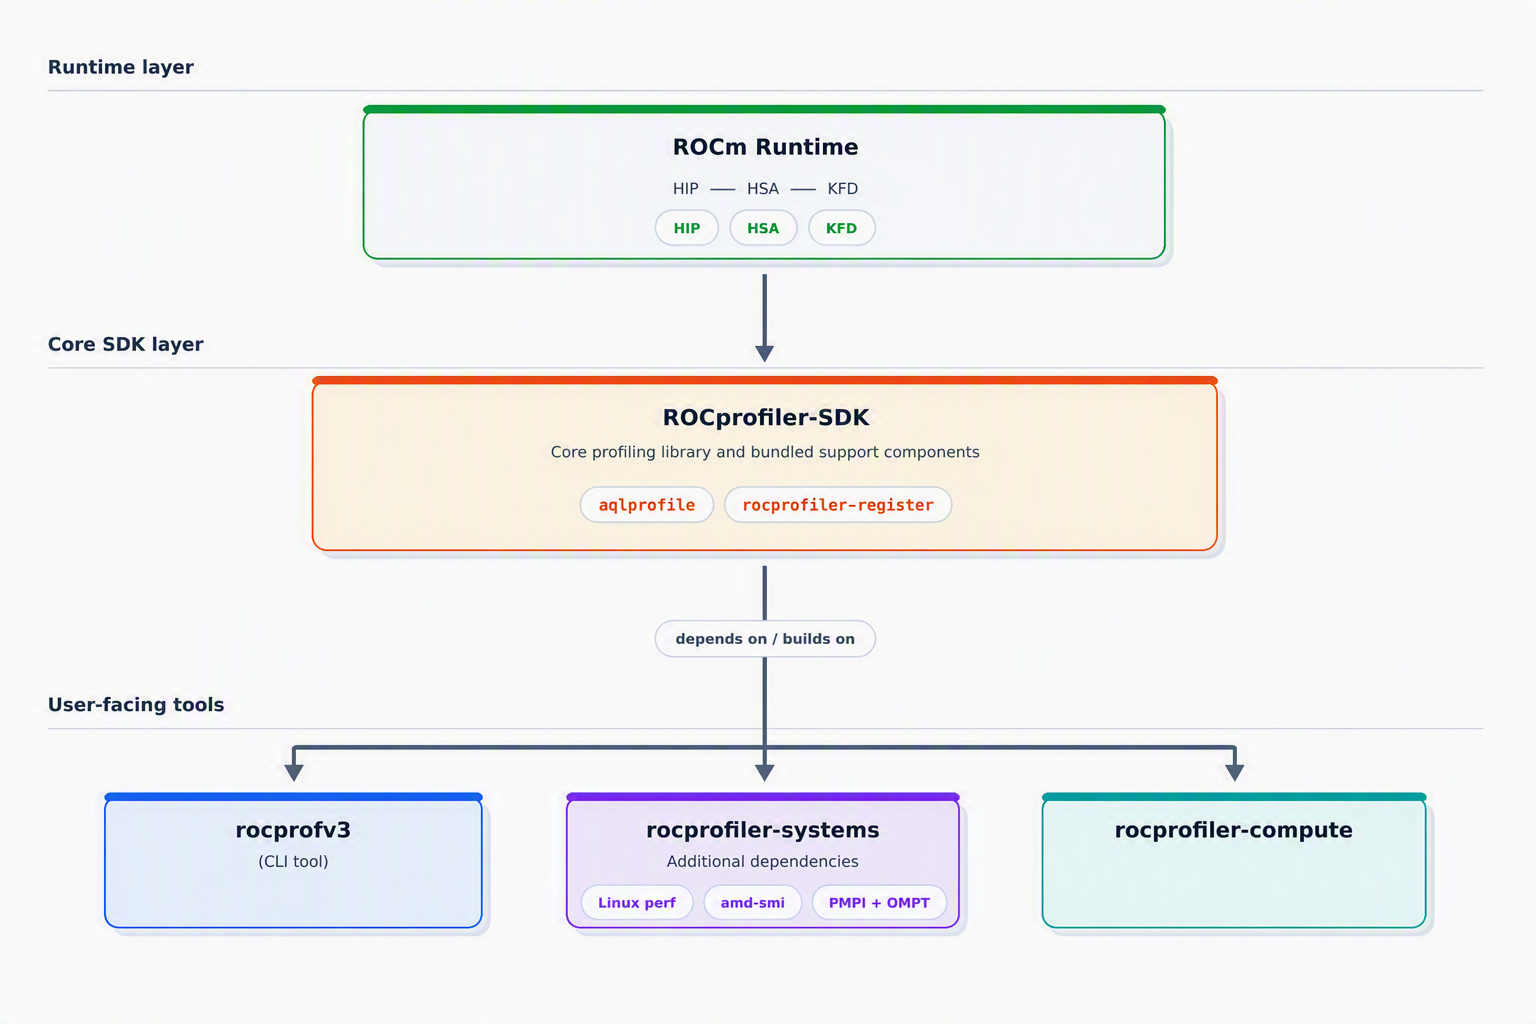
The following table lists the direct dependencies and additional runtime requirements for each tool.
Tool |
Direct dependencies |
Additional runtime requirements |
|---|---|---|
|
|
ROCm runtime (HIP + HSA), KFD kernel driver |
|
|
— |
|
|
PMPI (optional, for MPI tracing), OMPT (optional, for OpenMP tracing) |
|
|
Python 3.8+ |
Data flow between tools#
The tools are designed to be used in sequence. Each tool’s output directs what to investigate with the next tool.
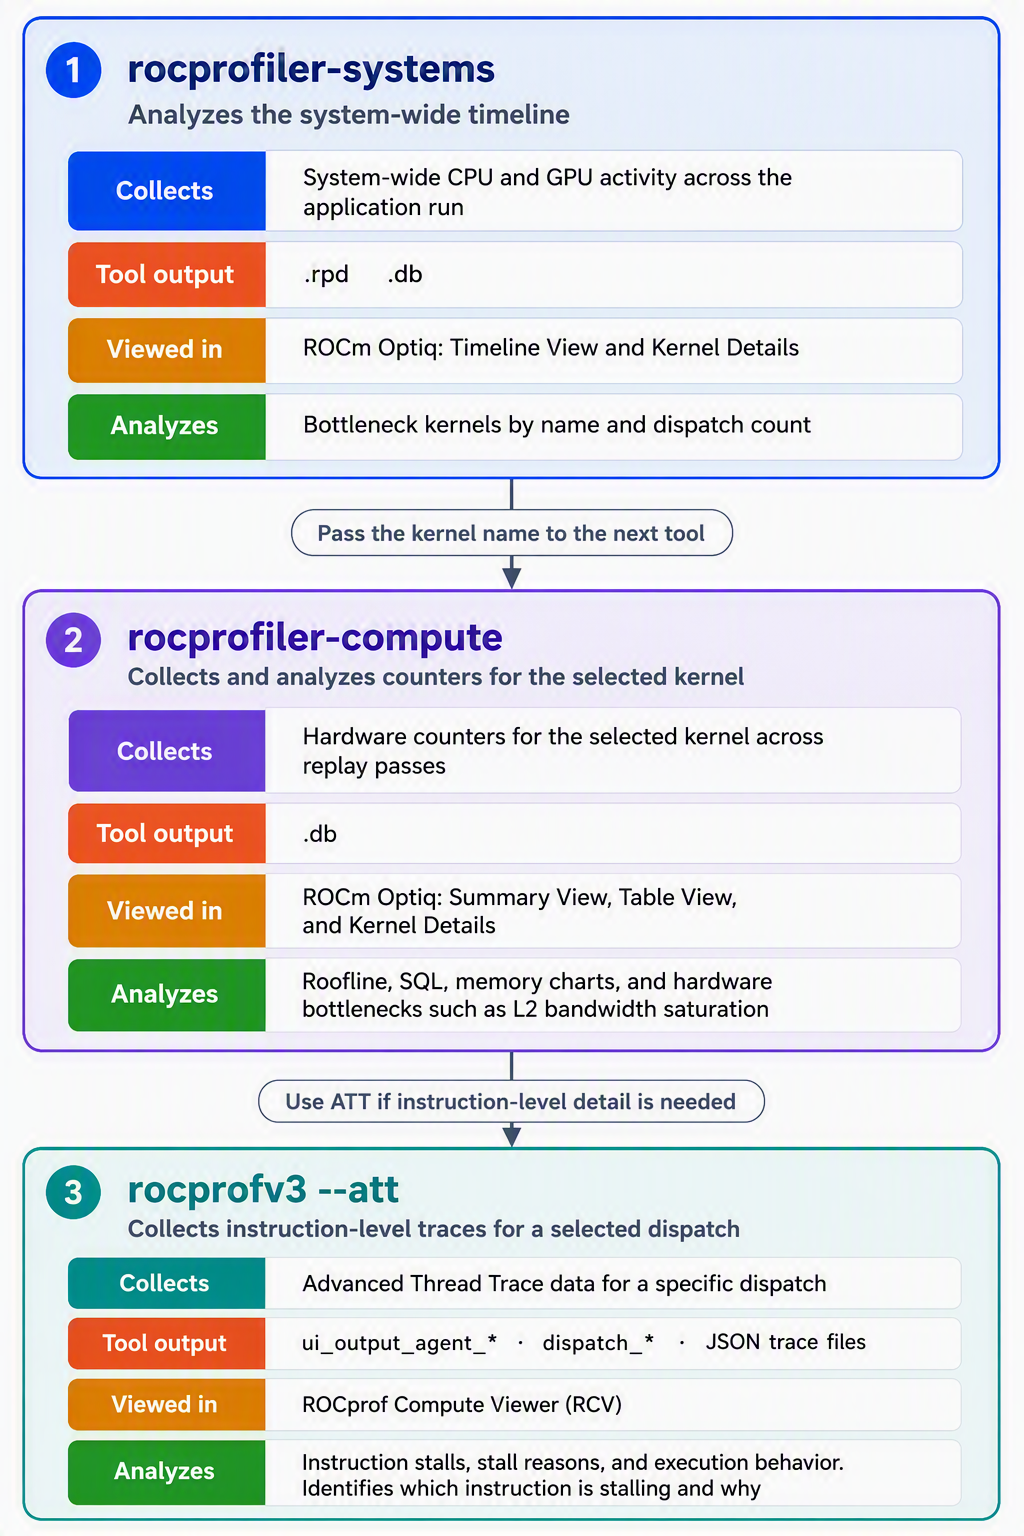
Recommended profiling workflow#
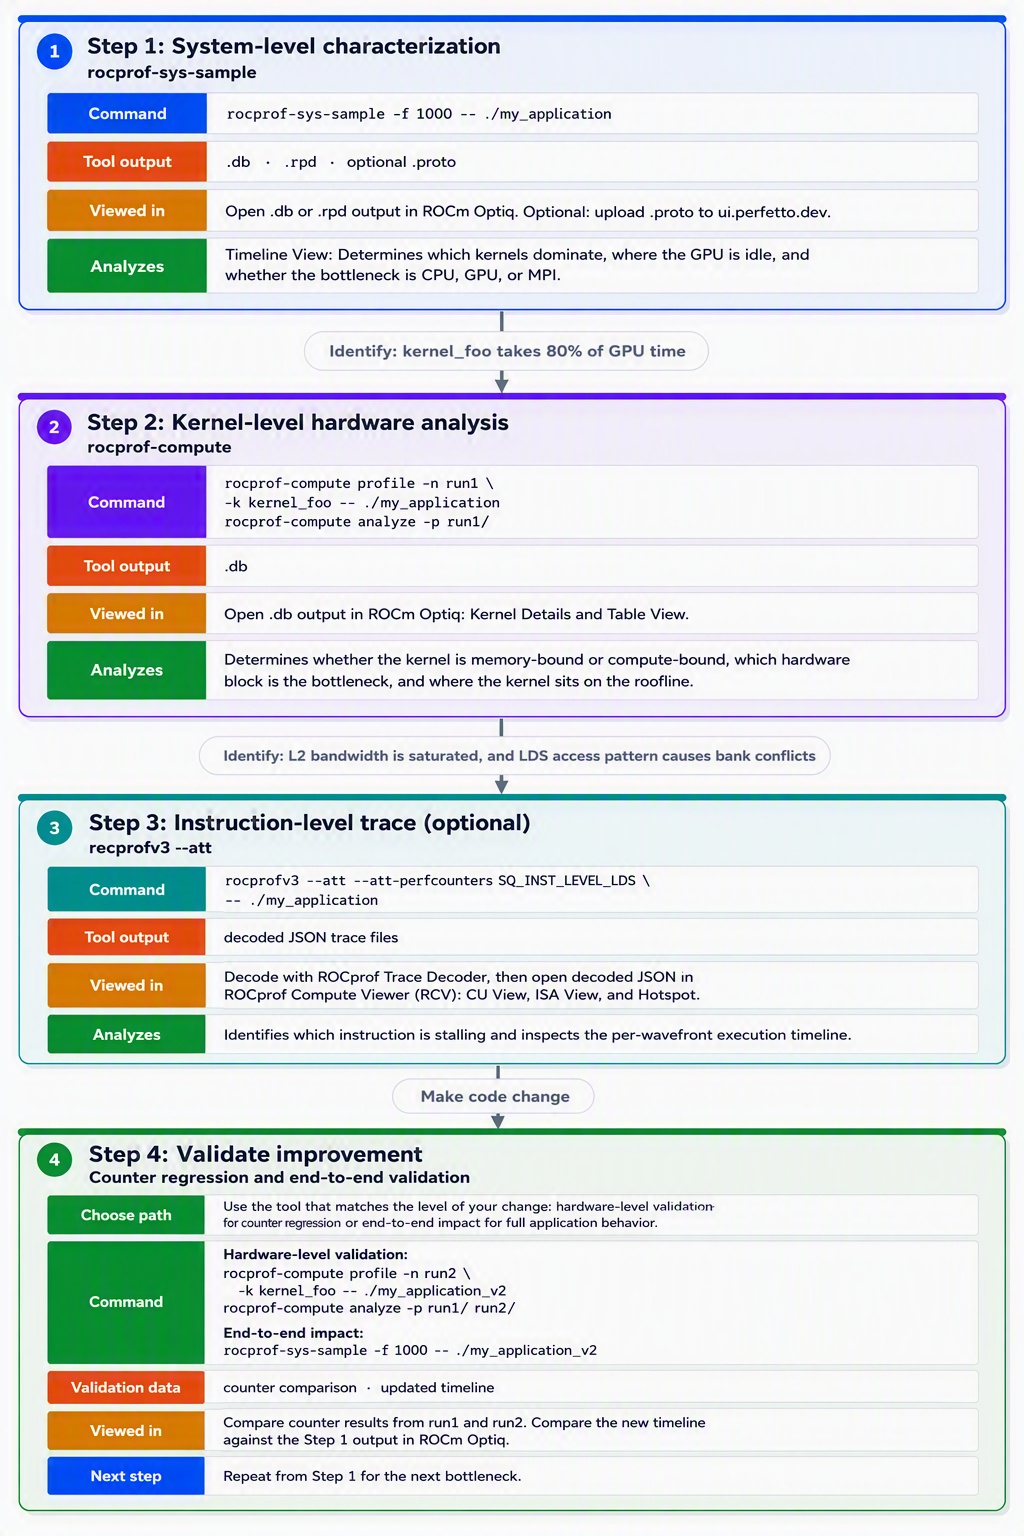
For most performance investigations, work top-down through the stack. The following workflow demonstrates a complete investigation cycle using all four levels of the tool stack: