Choosing the right ROCm profiling tool#
This topic provides guidance on selecting the appropriate ROCm profiling tool for your performance investigation. Each tool operates at a distinct level of the stack and is optimized for a different class of analysis. For background on how the tools relate to each other, see ROCm profiling tools overview.
Choosing by question#
The following table maps common performance questions to the tool best suited to answer them. Identify the question closest to your immediate need and refer to the corresponding tool section for details.
Question |
Tool |
Reason |
|---|---|---|
Where is my application spending time? |
rocprofiler-systems |
System-wide timeline shows CPU, GPU, MPI, and OS activity together. |
Which kernel is taking the most GPU time? |
rocprofiler-systems |
Kernel dispatch timeline with durations and dispatch counts. |
Why is the GPU idle between kernels? |
rocprofiler-systems |
CPU/GPU overlap analysis reveals dispatch stalls and data loader bottlenecks. |
Which MPI rank is the slowest? |
rocprofiler-systems |
Per-rank MPI collective timing with PMPI instrumentation. |
Is this kernel compute-bound or memory-bound? |
rocprofiler-compute |
Roofline analysis plots the kernel against hardware limits. |
Which hardware block is the bottleneck? |
rocprofiler-compute |
Hardware block Speed-of-Light identifies the limiting unit (CU, L1, L2, HBM, SPI). |
Did my optimization actually improve performance? |
rocprofiler-compute |
Baseline comparison of two profiling runs. |
Which instruction is causing the stall? |
rocprofv3 |
Instruction-level wavefront execution trace decoded in ROCprof Compute Viewer. |
How do I visualize an ATT trace interactively? |
ROCprof Compute Viewer (RCV) |
Renders decoded ATT JSON into a wavefront execution timeline with ISA annotation. |
How do I explore a trace on a machine without ROCm? |
ROCm Optiq |
No ROCm required on the analysis machine; opens |
How do I navigate kernel timelines and CPU-GPU interaction? |
ROCm Optiq |
Timeline view with zoom, filter, and bookmark support. |
Which tool has the lowest profiling overhead? |
rocprofv3 |
No binary instrumentation; targeted tracing and counter collection only. |
How do I get a quick trace or counter dump from the command line? |
rocprofv3 |
No code changes required; run your application under |
What hardware counters are available on my GPU? |
|
Lists all counters and derived metrics for installed hardware. |
How do I build a custom profiler? |
ROCprofiler-SDK |
Low-level C API for full control over tracing and counter collection. |
How do I add GPU support to an existing observability tool? |
ROCprofiler-SDK |
Integration API for third-party tools and frameworks. |
Choosing by analysis level#
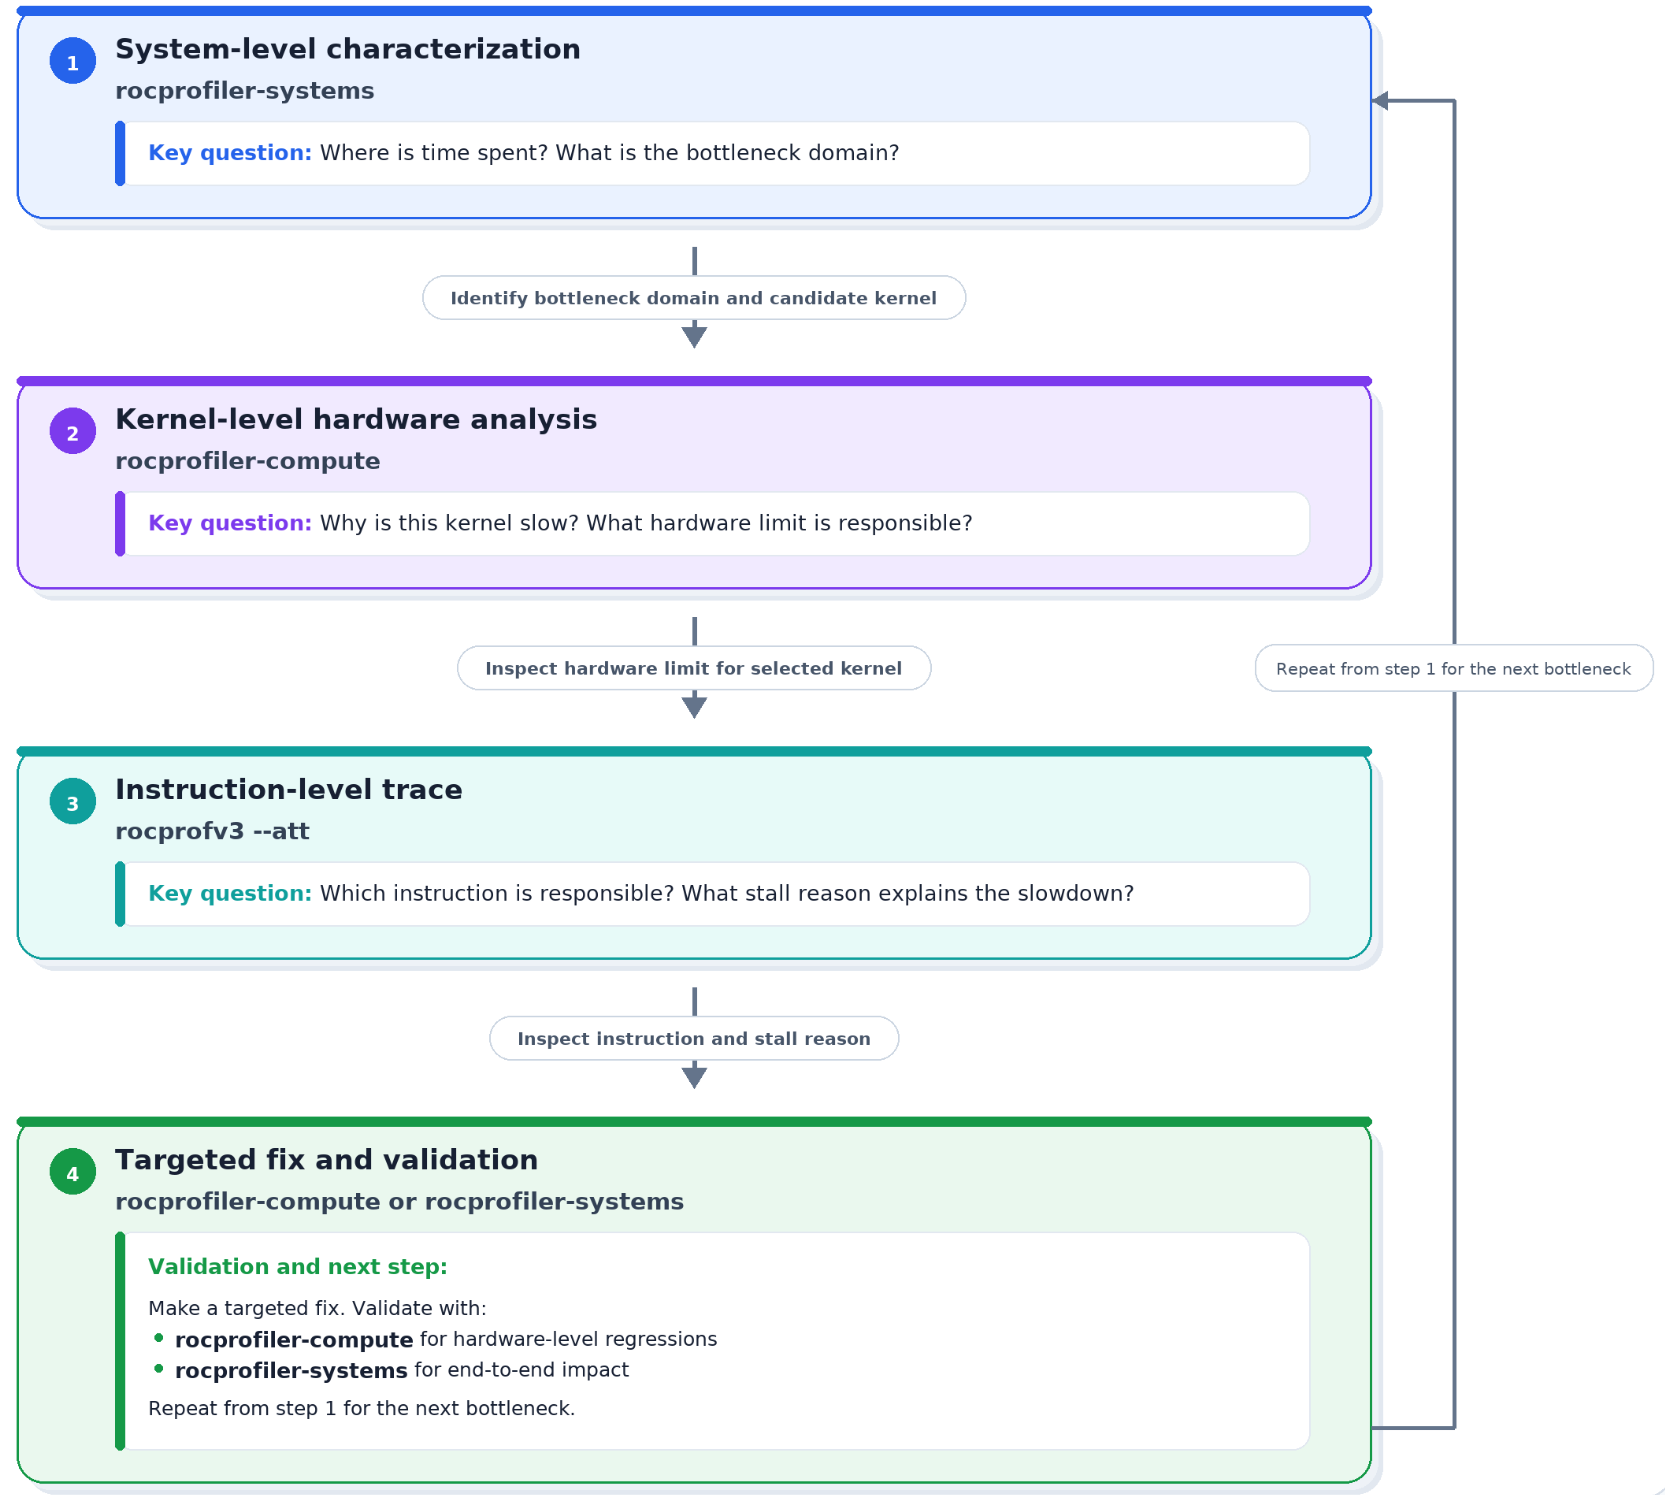
The tools address three analysis levels, each suited to a different class of performance question.
System level — rocprofiler-systems answers: where does the application spend time, and is the bottleneck on the CPU, GPU, network, or storage? This is the recommended starting point for any investigation. The output also opens directly in ROCm Optiq for interactive exploration.
Kernel level — rocprofiler-compute answers: why is this specific kernel
slow, and which hardware resource is the limiting factor? Use it after
rocprofiler-systems has identified the target kernel. rocprofv3 with
--pmc provides a lighter-weight alternative when you need a small number
of counters without the full multi-pass replay.
Instruction level — rocprofv3 --att and ROCprof Compute Viewer (RCV)
answer: which ISA instruction is stalling, and why? Use this level only when
kernel-level analysis has confirmed an instruction-level bottleneck such as an
LDS bank conflict or a high-latency memory operation, because ATT traces are
large and collection serializes the traced kernel.
Recommended investigation sequence#
For most performance investigations, start at the system level and move inward as the bottleneck narrows.
When to use each tool#
The following sections provide per-tool guidance on the scenarios where each tool is the right choice for your performance investigation.
rocprofv3#
Use rocprofv3 when you need quick, targeted profiling from the command
line. Common use cases include:
Collecting a timeline trace of a specific run for inspection in
ui.perfetto.devor a custom script.Gathering hardware counter values for a small set of counters in a scripted benchmark pipeline.
Generating CSV or JSON output for automated regression testing of kernel performance.
Attaching to a running process (
-p <PID>) to diagnose a live issue without restarting the application.Listing available hardware counters and derived metrics using
rocprofv3-avail.
Advanced profiling features:
Advanced Thread Trace (ATT) (
--att): records the complete instruction-level execution history of GPU wavefronts on a targeted compute unit for a specific kernel dispatch. Use ATT whenrocprofiler-computehas confirmed an instruction-level bottleneck and you need to identify which specific ISA instruction is stalling, inspect per-wavefront execution timelines, or diagnose LDS bank conflicts and memory latency at cycle granularity. ATT output is decoded by the ROCprof Trace Decoder and visualized in ROCprof Compute Viewer (RCV).PC Sampling (
--pc-sampling-beta-enabled): statistically samples the program counter and execution state of GPU wavefronts to identify hot code regions without per-kernel serialization. Two methods are available: HOST_TRAP (MI200+) provides hotspot histograms; STOCHASTIC (MI300+) additionally records instruction type, stall reason, and whether the sampled wave issued an instruction, making it the recommended method for precise profiling. The default method isstochasticwhen supported by the target architecture.Streaming Performance Monitoring (SPM) (
--spm-beta-enabled,--spm,--spm-sample-interval): continuously streams hardware counter values into a ring buffer at a configurable interval, independent of kernel dispatch boundaries. Unlike per-dispatch counter collection, SPM doesn’t serialize kernel execution, making it suited for monitoring overlapping or concurrent GPU workloads and for DCGM-style continuous GPU telemetry.
rocprofiler-systems#
Use rocprofiler-systems as the first step in any performance investigation. Common use cases include:
Understanding where time is spent across the entire application stack — CPU, GPU, MPI, and OS.
Answering “why is the GPU idle?” by correlating GPU kernel timelines with CPU call traces.
Analyzing MPI workloads to identify the slowest ranks, the most expensive collectives, and load imbalance.
Profiling mixed Python/C++/HIP applications where the bottleneck could be in any layer.
Running causal profiling to determine which code region to optimize first for the largest end-to-end improvement.
Profiling long-running production workloads with minimal overhead using call-stack sampling.
rocprofiler-compute#
Use rocprofiler-compute after rocprofiler-systems has identified a target
kernel. Common use cases include:
Determining whether a kernel is compute-bound or memory-bound via roofline analysis.
Understanding which hardware block is the bottleneck — compute units, L1, L2, HBM, or instruction fetch.
Measuring the kernel’s Speed-of-Light to quantify how close it is to theoretical peak.
Comparing two implementations of the same kernel side-by-side to validate that an optimization improved hardware utilization.
Tuning GEMM, attention, convolution, or other performance-critical AI/ML kernels.
Analyzing register pressure, occupancy, and wavefront scheduling behavior.
ROCprof Compute Viewer (RCV)#
Use RCV after collecting ATT data with rocprofv3 --att. Common use cases
include:
Visualizing wavefront execution timelines across compute units at instruction granularity.
Identifying which ISA instruction is the dominant stall source using the Hotspot and ISA views.
Measuring cycle costs of memory operations and their
s_waitcntlatency.Analyzing hardware utilization by instruction type (VALU, MFMA, VMEM, LDS).
Correlating source lines to stalling instructions when the application is compiled with debug symbols.
ROCm Optiq#
Use Optiq to analyze .db or .rpd files from rocprofiler-systems
or rocprofiler-compute, particularly when the analysis machine doesn’t
have ROCm installed. Common use cases include:
Exploring the full CPU-GPU interaction timeline from a
rocprofiler-systemstrace.Inspecting kernel-level hardware counter metrics and Speed-of-Light figures from
rocprofiler-compute.Sharing and reviewing profiling data on a developer workstation without AMD hardware.
Saving and revisiting an analysis session using Optiq project files (
.rpv).
ROCprofiler-SDK#
Use ROCprofiler-SDK directly when the higher-level tools don’t meet your needs. Common use cases include:
Building a new profiling or tracing tool from scratch.
Integrating AMD GPU profiling into an existing tool, such as HPCToolkit, TAU, Score-P, or a custom observability platform.
Embedding GPU trace collection into a deep learning framework, such as PyTorch, TensorFlow, JAX, or a custom training infrastructure.
Building always-on, low-overhead GPU telemetry for production monitoring infrastructure.
Developing custom analysis pipelines that need programmatic access to counter data, PC samples, or correlation IDs.
Developing HPC library instrumentation to annotate GPU work with performance markers and correlation IDs for use by upstream profiling tools.