Profiling by example#
The following examples refer to sample HIP code located in ROCm/omniperf/blob/amd-mainline/sample and distributed as part of Omniperf.
VALU arithmetic instruction mix#
For this example, consider the instruction mix sample distributed as a part of Omniperf.
Note
The examples in the section are expected to work on all CDNA™ accelerators. However, the actual experiment results in this section were collected on an MI2XX accelerator.
Design note#
This code uses a number of inline assembly instructions to cleanly identify the types of instructions being issued, as well as to avoid optimization / dead-code elimination by the compiler. While inline assembly is inherently not portable, this example is expected to work on all GCN™ GPUs and CDNA accelerators.
We reproduce a sample of the kernel as follows:
// fp32: add, mul, transcendental and fma
float f1, f2;
asm volatile(
    "v_add_f32_e32 %0, %1, %0\n"
    "v_mul_f32_e32 %0, %1, %0\n"
    "v_sqrt_f32 %0, %1\n"
    "v_fma_f32 %0, %1, %0, %1\n"
    : "=v"(f1)
    : "v"(f2));
These instructions correspond to:
A 32-bit floating point addition,
a 32-bit floating point multiplication,
a 32-bit floating point square-root transcendental operation, and
a 32-bit floating point fused multiply-add operation.
For more detail, refer to the CDNA2 ISA Guide.
Instruction mix#
This example was compiled and run on a MI250 accelerator using ROCm v5.6.0, and Omniperf v2.0.0.
$ hipcc -O3 instmix.hip -o instmix
Generate the profile for this example using the following command.
$ omniperf profile -n instmix --no-roof -- ./instmix
Analyze the instruction mix section.
$ omniperf analyze -p workloads/instmix/mi200/ -b 10.2
<...>
10. Compute Units - Instruction Mix
10.2 VALU Arithmetic Instr Mix
╒═════════╤════════════╤═════════╤════════════════╕
│ Index   │ Metric     │   Count │ Unit           │
╞═════════╪════════════╪═════════╪════════════════╡
│ 10.2.0  │ INT32      │    1.00 │ Instr per wave │
├─────────┼────────────┼─────────┼────────────────┤
│ 10.2.1  │ INT64      │    1.00 │ Instr per wave │
├─────────┼────────────┼─────────┼────────────────┤
│ 10.2.2  │ F16-ADD    │    1.00 │ Instr per wave │
├─────────┼────────────┼─────────┼────────────────┤
│ 10.2.3  │ F16-MUL    │    1.00 │ Instr per wave │
├─────────┼────────────┼─────────┼────────────────┤
│ 10.2.4  │ F16-FMA    │    1.00 │ Instr per wave │
├─────────┼────────────┼─────────┼────────────────┤
│ 10.2.5  │ F16-Trans  │    1.00 │ Instr per wave │
├─────────┼────────────┼─────────┼────────────────┤
│ 10.2.6  │ F32-ADD    │    1.00 │ Instr per wave │
├─────────┼────────────┼─────────┼────────────────┤
│ 10.2.7  │ F32-MUL    │    1.00 │ Instr per wave │
├─────────┼────────────┼─────────┼────────────────┤
│ 10.2.8  │ F32-FMA    │    1.00 │ Instr per wave │
├─────────┼────────────┼─────────┼────────────────┤
│ 10.2.9  │ F32-Trans  │    1.00 │ Instr per wave │
├─────────┼────────────┼─────────┼────────────────┤
│ 10.2.10 │ F64-ADD    │    1.00 │ Instr per wave │
├─────────┼────────────┼─────────┼────────────────┤
│ 10.2.11 │ F64-MUL    │    1.00 │ Instr per wave │
├─────────┼────────────┼─────────┼────────────────┤
│ 10.2.12 │ F64-FMA    │    1.00 │ Instr per wave │
├─────────┼────────────┼─────────┼────────────────┤
│ 10.2.13 │ F64-Trans  │    1.00 │ Instr per wave │
├─────────┼────────────┼─────────┼────────────────┤
│ 10.2.14 │ Conversion │    1.00 │ Instr per wave │
╘═════════╧════════════╧═════════╧════════════════╛
This shows that we have exactly one of each type of VALU arithmetic instruction by construction.
Infinity Fabric transactions#
For this example, consider the Infinity Fabric™ sample distributed as a part of Omniperf.
This following code snippet launches a simple read-only kernel.
// the main streaming kernel
__global__ void kernel(int* x, size_t N, int zero) {
  int sum = 0;
  const size_t offset_start = threadIdx.x + blockIdx.x * blockDim.x;
  for (int i = 0; i < 10; ++i) {
    for (size_t offset = offset_start; offset < N; offset += blockDim.x * gridDim.x) {
      sum += x[offset];
    }
  }
  if (sum != 0) {
    x[offset_start] = sum;
  }
}
This happens twice – once as a warm-up and once for analysis. Note that the
buffer x is initialized to all zeros via a call to hipMemcpy on the
host before the kernel is ever launched. Therefore, the following conditional
is identically false – and thus we expect no writes.
if (sum != 0) { ...
Note
The actual sample included with Omniperf also includes the ability to select different operation types (such as atomics, writes). This abbreviated version is presented here for reference only.
Finally, this sample code lets the user control the granularity of an allocation, the owner of an allocation (local HBM, CPU DRAM or remote HBM), and the size of an allocation (the default is \(\sim4\)GiB) via command line arguments. In doing so, we can explore the impact of these parameters on the L2-Fabric metrics reported by Omniperf to further understand their meaning.
Note
All results in this section were generated an a node of Infinity Fabric connected MI250 accelerators using ROCm version 5.6.0, and Omniperf version 2.0.0. Although results may vary with ROCm versions and accelerator connectivity, we expect the lessons learned here to be broadly applicable.
Experiment 1: Coarse-grained, accelerator-local HBM reads#
In our first experiment, we consider the simplest possible case, a
hipMalloc’d buffer that is local to our current accelerator:
$ omniperf profile -n coarse_grained_local --no-roof -- ./fabric -t 1 -o 0
Using:
  mtype:CoarseGrained
  mowner:Device
  mspace:Global
  mop:Read
  mdata:Unsigned
  remoteId:-1
<...>
$ omniperf analyze -p workloads/coarse_grained_local/mi200 -b 17.2.0 17.2.1 17.2.2 17.4.0 17.4.1 17.4.2 17.5.0 17.5.1 17.5.2 17.5.3 17.5.4 -n per_kernel --dispatch 2
<...>
17. L2 Cache
17.2 L2 - Fabric Transactions
╒═════════╤═════════════════════╤════════════════╤════════════════╤════════════════╤══════════════════╕
│ Index   │ Metric              │            Avg │            Min │            Max │ Unit             │
╞═════════╪═════════════════════╪════════════════╪════════════════╪════════════════╪══════════════════╡
│ 17.2.0  │ L2-Fabric Read BW   │ 42947428672.00 │ 42947428672.00 │ 42947428672.00 │ Bytes per kernel │
├─────────┼─────────────────────┼────────────────┼────────────────┼────────────────┼──────────────────┤
│ 17.2.1  │ HBM Read Traffic    │         100.00 │         100.00 │         100.00 │ Pct              │
├─────────┼─────────────────────┼────────────────┼────────────────┼────────────────┼──────────────────┤
│ 17.2.2  │ Remote Read Traffic │           0.00 │           0.00 │           0.00 │ Pct              │
╘═════════╧═════════════════════╧════════════════╧════════════════╧════════════════╧══════════════════╛
17.4 L2 - Fabric Interface Stalls
╒═════════╤═══════════════════════════════╤════════════════════════╤═══════════════╤═══════╤═══════╤═══════╤════════╕
│ Index   │ Metric                        │ Type                   │ Transaction   │   Avg │   Min │   Max │ Unit   │
╞═════════╪═══════════════════════════════╪════════════════════════╪═══════════════╪═══════╪═══════╪═══════╪════════╡
│ 17.4.0  │ Read - PCIe Stall             │ PCIe Stall             │ Read          │  0.00 │  0.00 │  0.00 │ Pct    │
├─────────┼───────────────────────────────┼────────────────────────┼───────────────┼───────┼───────┼───────┼────────┤
│ 17.4.1  │ Read - Infinity Fabric™ Stall │ Infinity Fabric™ Stall │ Read          │  0.00 │  0.00 │  0.00 │ Pct    │
├─────────┼───────────────────────────────┼────────────────────────┼───────────────┼───────┼───────┼───────┼────────┤
│ 17.4.2  │ Read - HBM Stall              │ HBM Stall              │ Read          │  0.07 │  0.07 │  0.07 │ Pct    │
╘═════════╧═══════════════════════════════╧════════════════════════╧═══════════════╧═══════╧═══════╧═══════╧════════╛
17.5 L2 - Fabric Detailed Transaction Breakdown
╒═════════╤═════════════════╤══════════════╤══════════════╤══════════════╤════════════════╕
│ Index   │ Metric          │          Avg │          Min │          Max │ Unit           │
╞═════════╪═════════════════╪══════════════╪══════════════╪══════════════╪════════════════╡
│ 17.5.0  │ Read (32B)      │         0.00 │         0.00 │         0.00 │ Req per kernel │
├─────────┼─────────────────┼──────────────┼──────────────┼──────────────┼────────────────┤
│ 17.5.1  │ Read (Uncached) │      1450.00 │      1450.00 │      1450.00 │ Req per kernel │
├─────────┼─────────────────┼──────────────┼──────────────┼──────────────┼────────────────┤
│ 17.5.2  │ Read (64B)      │ 671053573.00 │ 671053573.00 │ 671053573.00 │ Req per kernel │
├─────────┼─────────────────┼──────────────┼──────────────┼──────────────┼────────────────┤
│ 17.5.3  │ HBM Read        │ 671053565.00 │ 671053565.00 │ 671053565.00 │ Req per kernel │
├─────────┼─────────────────┼──────────────┼──────────────┼──────────────┼────────────────┤
│ 17.5.4  │ Remote Read     │         8.00 │         8.00 │         8.00 │ Req per kernel │
╘═════════╧═════════════════╧══════════════╧══════════════╧══════════════╧════════════════╛
Here, you can make the following observations.
The vast majority of L2-Fabric requests (>99%) are 64B read requests (17.5.2).
Nearly 100% of the read requests (17.2.1) are homed in on the accelerator-local HBM (17.5.3), while some small fraction of these reads are routed to a “remote” device (17.5.4).
These drive a \(\sim40\)GiB per kernel read-bandwidth (17.2.0).
In addition, we see a small amount of uncached reads (17.5.1), these correspond to things like:
The assembly code to execute the kernel
Kernel arguments
Coordinate parameters (such as
blockDim.z) that were not initialized by the hardware, etc. and may account for some of our “remote” read requests (17.5.4), for example, reading from CPU DRAM
The above list is not exhaustive, nor are all of these guaranteed to be “uncached” – the exact implementation depends on the accelerator and ROCm versions used. These read requests could be interrogated further in the Scalar L1 Data Cache and Instruction Cache metric sections.
Note
The Traffic metrics in Sec 17.2 are presented as a percentage of the total number of requests. For example, “HBM Read Traffic” is the percent of read requests (17.5.0 - 17.5.2) that were directed to the accelerators’ local HBM (17.5.3).
Experiment 2: Fine-grained, accelerator-local HBM reads#
In this experiment, we change the granularity of our
device-allocation to be fine-grained device memory, local to the current
accelerator. Our code uses the hipExtMallocWithFlag API with the
hipDeviceMallocFinegrained flag to accomplish this.
Note
On some systems (such as those with only PCIe® connected accelerators), you need
to set the environment variable HSA_FORCE_FINE_GRAIN_PCIE=1 to enable
this memory type.
$ omniperf profile -n fine_grained_local --no-roof -- ./fabric -t 0 -o 0
Using:
  mtype:FineGrained
  mowner:Device
  mspace:Global
  mop:Read
  mdata:Unsigned
  remoteId:-1
<...>
$ omniperf analyze -p workloads/fine_grained_local/mi200 -b 17.2.0 17.2.1 17.2.2 17.2.3 17.4.0 17.4.1 17.4.2 17.5.0 17.5.1 17.5.2 17.5.3 17.5.4  -n per_kernel --dispatch 2
<...>
17. L2 Cache
17.2 L2 - Fabric Transactions
╒═════════╤═══════════════════════╤════════════════╤════════════════╤════════════════╤══════════════════╕
│ Index   │ Metric                │            Avg │            Min │            Max │ Unit             │
╞═════════╪═══════════════════════╪════════════════╪════════════════╪════════════════╪══════════════════╡
│ 17.2.0  │ L2-Fabric Read BW     │ 42948661824.00 │ 42948661824.00 │ 42948661824.00 │ Bytes per kernel │
├─────────┼───────────────────────┼────────────────┼────────────────┼────────────────┼──────────────────┤
│ 17.2.1  │ HBM Read Traffic      │         100.00 │         100.00 │         100.00 │ Pct              │
├─────────┼───────────────────────┼────────────────┼────────────────┼────────────────┼──────────────────┤
│ 17.2.2  │ Remote Read Traffic   │           0.00 │           0.00 │           0.00 │ Pct              │
├─────────┼───────────────────────┼────────────────┼────────────────┼────────────────┼──────────────────┤
│ 17.2.3  │ Uncached Read Traffic │           0.00 │           0.00 │           0.00 │ Pct              │
╘═════════╧═══════════════════════╧════════════════╧════════════════╧════════════════╧══════════════════╛
17.4 L2 - Fabric Interface Stalls
╒═════════╤═══════════════════════════════╤════════════════════════╤═══════════════╤═══════╤═══════╤═══════╤════════╕
│ Index   │ Metric                        │ Type                   │ Transaction   │   Avg │   Min │   Max │ Unit   │
╞═════════╪═══════════════════════════════╪════════════════════════╪═══════════════╪═══════╪═══════╪═══════╪════════╡
│ 17.4.0  │ Read - PCIe Stall             │ PCIe Stall             │ Read          │  0.00 │  0.00 │  0.00 │ Pct    │
├─────────┼───────────────────────────────┼────────────────────────┼───────────────┼───────┼───────┼───────┼────────┤
│ 17.4.1  │ Read - Infinity Fabric™ Stall │ Infinity Fabric™ Stall │ Read          │  0.00 │  0.00 │  0.00 │ Pct    │
├─────────┼───────────────────────────────┼────────────────────────┼───────────────┼───────┼───────┼───────┼────────┤
│ 17.4.2  │ Read - HBM Stall              │ HBM Stall              │ Read          │  0.07 │  0.07 │  0.07 │ Pct    │
╘═════════╧═══════════════════════════════╧════════════════════════╧═══════════════╧═══════╧═══════╧═══════╧════════╛
17.5 L2 - Fabric Detailed Transaction Breakdown
╒═════════╤═════════════════╤══════════════╤══════════════╤══════════════╤════════════════╕
│ Index   │ Metric          │          Avg │          Min │          Max │ Unit           │
╞═════════╪═════════════════╪══════════════╪══════════════╪══════════════╪════════════════╡
│ 17.5.0  │ Read (32B)      │         0.00 │         0.00 │         0.00 │ Req per kernel │
├─────────┼─────────────────┼──────────────┼──────────────┼──────────────┼────────────────┤
│ 17.5.1  │ Read (Uncached) │      1334.00 │      1334.00 │      1334.00 │ Req per kernel │
├─────────┼─────────────────┼──────────────┼──────────────┼──────────────┼────────────────┤
│ 17.5.2  │ Read (64B)      │ 671072841.00 │ 671072841.00 │ 671072841.00 │ Req per kernel │
├─────────┼─────────────────┼──────────────┼──────────────┼──────────────┼────────────────┤
│ 17.5.3  │ HBM Read        │ 671072835.00 │ 671072835.00 │ 671072835.00 │ Req per kernel │
├─────────┼─────────────────┼──────────────┼──────────────┼──────────────┼────────────────┤
│ 17.5.4  │ Remote Read     │         6.00 │         6.00 │         6.00 │ Req per kernel │
╘═════════╧═════════════════╧══════════════╧══════════════╧══════════════╧════════════════╛
Comparing with our previous example, we see a relatively similar result, namely:
The vast majority of L2-Fabric requests are 64B read requests (17.5.2)
Nearly all these read requests are directed to the accelerator-local HBM (17.2.1)
In addition, we now see a small percentage of HBM Read Stalls (17.4.2), as streaming fine-grained memory is putting more stress on Infinity Fabric.
Note
The stalls in Sec 17.4 are presented as a percentage of the total number active L2 cycles, summed over all L2 channels.
Experiment 3: Fine-grained, remote-accelerator HBM reads#
In this experiment, we move our fine-grained allocation to
be owned by a remote accelerator. We accomplish this by first changing
the HIP device using, for instance, the hipSetDevice(1) API, then allocating
fine-grained memory (as described previously), and
finally resetting the device back to the default, for instance,
hipSetDevice(0).
Although we have not changed our code significantly, we do see a substantial change in the L2-Fabric metrics:
$ omniperf profile -n fine_grained_remote --no-roof -- ./fabric -t 0 -o 2
Using:
  mtype:FineGrained
  mowner:Remote
  mspace:Global
  mop:Read
  mdata:Unsigned
  remoteId:-1
<...>
$ omniperf analyze -p workloads/fine_grained_remote/mi200 -b 17.2.0 17.2.1 17.2.2 17.2.3 17.4.0 17.4.1 17.4.2 17.5.0 17.5.1 17.5.2 17.5.3 17.5.4  -n per_kernel --dispatch 2
<...>
17. L2 Cache
17.2 L2 - Fabric Transactions
╒═════════╤═══════════════════════╤════════════════╤════════════════╤════════════════╤══════════════════╕
│ Index   │ Metric                │            Avg │            Min │            Max │ Unit             │
╞═════════╪═══════════════════════╪════════════════╪════════════════╪════════════════╪══════════════════╡
│ 17.2.0  │ L2-Fabric Read BW     │ 42949692736.00 │ 42949692736.00 │ 42949692736.00 │ Bytes per kernel │
├─────────┼───────────────────────┼────────────────┼────────────────┼────────────────┼──────────────────┤
│ 17.2.1  │ HBM Read Traffic      │           0.00 │           0.00 │           0.00 │ Pct              │
├─────────┼───────────────────────┼────────────────┼────────────────┼────────────────┼──────────────────┤
│ 17.2.2  │ Remote Read Traffic   │         100.00 │         100.00 │         100.00 │ Pct              │
├─────────┼───────────────────────┼────────────────┼────────────────┼────────────────┼──────────────────┤
│ 17.2.3  │ Uncached Read Traffic │         200.00 │         200.00 │         200.00 │ Pct              │
╘═════════╧═══════════════════════╧════════════════╧════════════════╧════════════════╧══════════════════╛
17.4 L2 - Fabric Interface Stalls
╒═════════╤═══════════════════════════════╤════════════════════════╤═══════════════╤═══════╤═══════╤═══════╤════════╕
│ Index   │ Metric                        │ Type                   │ Transaction   │   Avg │   Min │   Max │ Unit   │
╞═════════╪═══════════════════════════════╪════════════════════════╪═══════════════╪═══════╪═══════╪═══════╪════════╡
│ 17.4.0  │ Read - PCIe Stall             │ PCIe Stall             │ Read          │  0.00 │  0.00 │  0.00 │ Pct    │
├─────────┼───────────────────────────────┼────────────────────────┼───────────────┼───────┼───────┼───────┼────────┤
│ 17.4.1  │ Read - Infinity Fabric™ Stall │ Infinity Fabric™ Stall │ Read          │ 17.85 │ 17.85 │ 17.85 │ Pct    │
├─────────┼───────────────────────────────┼────────────────────────┼───────────────┼───────┼───────┼───────┼────────┤
│ 17.4.2  │ Read - HBM Stall              │ HBM Stall              │ Read          │  0.00 │  0.00 │  0.00 │ Pct    │
╘═════════╧═══════════════════════════════╧════════════════════════╧═══════════════╧═══════╧═══════╧═══════╧════════╛
17.5 L2 - Fabric Detailed Transaction Breakdown
╒═════════╤═════════════════╤═══════════════╤═══════════════╤═══════════════╤════════════════╕
│ Index   │ Metric          │           Avg │           Min │           Max │ Unit           │
╞═════════╪═════════════════╪═══════════════╪═══════════════╪═══════════════╪════════════════╡
│ 17.5.0  │ Read (32B)      │          0.00 │          0.00 │          0.00 │ Req per kernel │
├─────────┼─────────────────┼───────────────┼───────────────┼───────────────┼────────────────┤
│ 17.5.1  │ Read (Uncached) │ 1342177894.00 │ 1342177894.00 │ 1342177894.00 │ Req per kernel │
├─────────┼─────────────────┼───────────────┼───────────────┼───────────────┼────────────────┤
│ 17.5.2  │ Read (64B)      │  671088949.00 │  671088949.00 │  671088949.00 │ Req per kernel │
├─────────┼─────────────────┼───────────────┼───────────────┼───────────────┼────────────────┤
│ 17.5.3  │ HBM Read        │        307.00 │        307.00 │        307.00 │ Req per kernel │
├─────────┼─────────────────┼───────────────┼───────────────┼───────────────┼────────────────┤
│ 17.5.4  │ Remote Read     │  671088642.00 │  671088642.00 │  671088642.00 │ Req per kernel │
╘═════════╧═════════════════╧═══════════════╧═══════════════╧═══════════════╧════════════════╛
First, we see that while we still observe approximately the same number of 64B Read Requests (17.5.2), we now see an even larger number of Uncached Read Requests (17.5.3). Some simple division reveals:
That is, each 64B Read Request is also counted as two Uncached Read Requests, as reflected in the request-flow diagram. This is also why the Uncached Read Traffic metric (17.2.3) is at the counter-intuitive value of 200%!
In addition, observe that:
We no longer see any significant number of HBM Read Requests (17.2.1, 17.5.3), nor HBM Read Stalls (17.4.2), but instead,
we see that almost all of these requests are considered “remote” (17.2.2, 17.5.4) are being routed to another accelerator, or the CPU — in this case HIP Device 1 — and,
we see a significantly larger percentage of AMD Infinity Fabric Read Stalls (17.4.1) as compared to the HBM Read Stalls in the previous example.
These stalls correspond to reads that are going out over the AMD Infinity Fabric connection to another MI250 accelerator. In addition, because these are crossing between accelerators, we expect significantly lower achievable bandwidths as compared to the local accelerator’s HBM – this is reflected (indirectly) in the magnitude of the stall metric (17.4.1). Finally, we note that if our system contained only PCIe connected accelerators, these observations will differ.
Experiment 4: Fine-grained, CPU-DRAM reads#
In this experiment, we move our fine-grained allocation to
be owned by the CPU’s DRAM. We accomplish this by allocating host-pinned
fine-grained memory using the hipHostMalloc API:
$ omniperf profile -n fine_grained_host --no-roof -- ./fabric -t 0 -o 1
Using:
  mtype:FineGrained
  mowner:Host
  mspace:Global
  mop:Read
  mdata:Unsigned
  remoteId:-1
<...>
$ omniperf analyze -p workloads/fine_grained_host/mi200 -b 17.2.0 17.2.1 17.2.2 17.2.3 17.4.0 17.4.1 17.4.2 17.5.0 17.5.1 17.5.2 17.5.3 17.5.4  -n per_kernel --dispatch 2
<...>
17. L2 Cache
17.2 L2 - Fabric Transactions
╒═════════╤═══════════════════════╤════════════════╤════════════════╤════════════════╤══════════════════╕
│ Index   │ Metric                │            Avg │            Min │            Max │ Unit             │
╞═════════╪═══════════════════════╪════════════════╪════════════════╪════════════════╪══════════════════╡
│ 17.2.0  │ L2-Fabric Read BW     │ 42949691264.00 │ 42949691264.00 │ 42949691264.00 │ Bytes per kernel │
├─────────┼───────────────────────┼────────────────┼────────────────┼────────────────┼──────────────────┤
│ 17.2.1  │ HBM Read Traffic      │           0.00 │           0.00 │           0.00 │ Pct              │
├─────────┼───────────────────────┼────────────────┼────────────────┼────────────────┼──────────────────┤
│ 17.2.2  │ Remote Read Traffic   │         100.00 │         100.00 │         100.00 │ Pct              │
├─────────┼───────────────────────┼────────────────┼────────────────┼────────────────┼──────────────────┤
│ 17.2.3  │ Uncached Read Traffic │         200.00 │         200.00 │         200.00 │ Pct              │
╘═════════╧═══════════════════════╧════════════════╧════════════════╧════════════════╧══════════════════╛
17.4 L2 - Fabric Interface Stalls
╒═════════╤═══════════════════════════════╤════════════════════════╤═══════════════╤═══════╤═══════╤═══════╤════════╕
│ Index   │ Metric                        │ Type                   │ Transaction   │   Avg │   Min │   Max │ Unit   │
╞═════════╪═══════════════════════════════╪════════════════════════╪═══════════════╪═══════╪═══════╪═══════╪════════╡
│ 17.4.0  │ Read - PCIe Stall             │ PCIe Stall             │ Read          │ 91.29 │ 91.29 │ 91.29 │ Pct    │
├─────────┼───────────────────────────────┼────────────────────────┼───────────────┼───────┼───────┼───────┼────────┤
│ 17.4.1  │ Read - Infinity Fabric™ Stall │ Infinity Fabric™ Stall │ Read          │  0.00 │  0.00 │  0.00 │ Pct    │
├─────────┼───────────────────────────────┼────────────────────────┼───────────────┼───────┼───────┼───────┼────────┤
│ 17.4.2  │ Read - HBM Stall              │ HBM Stall              │ Read          │  0.00 │  0.00 │  0.00 │ Pct    │
╘═════════╧═══════════════════════════════╧════════════════════════╧═══════════════╧═══════╧═══════╧═══════╧════════╛
17.5 L2 - Fabric Detailed Transaction Breakdown
╒═════════╤═════════════════╤═══════════════╤═══════════════╤═══════════════╤════════════════╕
│ Index   │ Metric          │           Avg │           Min │           Max │ Unit           │
╞═════════╪═════════════════╪═══════════════╪═══════════════╪═══════════════╪════════════════╡
│ 17.5.0  │ Read (32B)      │          0.00 │          0.00 │          0.00 │ Req per kernel │
├─────────┼─────────────────┼───────────────┼───────────────┼───────────────┼────────────────┤
│ 17.5.1  │ Read (Uncached) │ 1342177848.00 │ 1342177848.00 │ 1342177848.00 │ Req per kernel │
├─────────┼─────────────────┼───────────────┼───────────────┼───────────────┼────────────────┤
│ 17.5.2  │ Read (64B)      │  671088926.00 │  671088926.00 │  671088926.00 │ Req per kernel │
├─────────┼─────────────────┼───────────────┼───────────────┼───────────────┼────────────────┤
│ 17.5.3  │ HBM Read        │        284.00 │        284.00 │        284.00 │ Req per kernel │
├─────────┼─────────────────┼───────────────┼───────────────┼───────────────┼────────────────┤
│ 17.5.4  │ Remote Read     │  671088642.00 │  671088642.00 │  671088642.00 │ Req per kernel │
╘═════════╧═════════════════╧═══════════════╧═══════════════╧═══════════════╧════════════════╛
Here we see almost the same results as in the previous experiment, however now as we are crossing a PCIe bus to the CPU, we see that the Infinity Fabric Read stalls (17.4.1) have shifted to be a PCIe stall (17.4.2). In addition, as (on this system) the PCIe bus has a lower peak bandwidth than the AMD Infinity Fabric connection between two accelerators, we once again observe an increase in the percentage of stalls on this interface.
Note
Had we performed this same experiment on an MI250X system, these transactions would again have been marked as Infinity Fabric Read stalls (17.4.1), as the CPU is connected to the accelerator via AMD Infinity Fabric.
Experiment 5: Coarse-grained, CPU-DRAM reads#
In our next fabric experiment, we change our CPU memory allocation to be
coarse-grained. We accomplish this by passing the
hipHostMalloc API the hipHostMallocNonCoherent flag, to mark the
allocation as coarse-grained:
$ omniperf profile -n coarse_grained_host --no-roof -- ./fabric -t 1 -o 1
Using:
  mtype:CoarseGrained
  mowner:Host
  mspace:Global
  mop:Read
  mdata:Unsigned
  remoteId:-1
<...>
$ omniperf analyze -p workloads/coarse_grained_host/mi200 -b 17.2.0 17.2.1 17.2.2 17.2.3 17.4.0 17.4.1 17.4.2 17.5.0 17.5.1 17.5.2 17.5.3 17.5.4  -n per_kernel --dispatch 2
<...>
17. L2 Cache
17.2 L2 - Fabric Transactions
╒═════════╤═══════════════════════╤════════════════╤════════════════╤════════════════╤══════════════════╕
│ Index   │ Metric                │            Avg │            Min │            Max │ Unit             │
╞═════════╪═══════════════════════╪════════════════╪════════════════╪════════════════╪══════════════════╡
│ 17.2.0  │ L2-Fabric Read BW     │ 42949691264.00 │ 42949691264.00 │ 42949691264.00 │ Bytes per kernel │
├─────────┼───────────────────────┼────────────────┼────────────────┼────────────────┼──────────────────┤
│ 17.2.1  │ HBM Read Traffic      │           0.00 │           0.00 │           0.00 │ Pct              │
├─────────┼───────────────────────┼────────────────┼────────────────┼────────────────┼──────────────────┤
│ 17.2.2  │ Remote Read Traffic   │         100.00 │         100.00 │         100.00 │ Pct              │
├─────────┼───────────────────────┼────────────────┼────────────────┼────────────────┼──────────────────┤
│ 17.2.3  │ Uncached Read Traffic │           0.00 │           0.00 │           0.00 │ Pct              │
╘═════════╧═══════════════════════╧════════════════╧════════════════╧════════════════╧══════════════════╛
17.4 L2 - Fabric Interface Stalls
╒═════════╤═══════════════════════════════╤════════════════════════╤═══════════════╤═══════╤═══════╤═══════╤════════╕
│ Index   │ Metric                        │ Type                   │ Transaction   │   Avg │   Min │   Max │ Unit   │
╞═════════╪═══════════════════════════════╪════════════════════════╪═══════════════╪═══════╪═══════╪═══════╪════════╡
│ 17.4.0  │ Read - PCIe Stall             │ PCIe Stall             │ Read          │ 91.27 │ 91.27 │ 91.27 │ Pct    │
├─────────┼───────────────────────────────┼────────────────────────┼───────────────┼───────┼───────┼───────┼────────┤
│ 17.4.1  │ Read - Infinity Fabric™ Stall │ Infinity Fabric™ Stall │ Read          │  0.00 │  0.00 │  0.00 │ Pct    │
├─────────┼───────────────────────────────┼────────────────────────┼───────────────┼───────┼───────┼───────┼────────┤
│ 17.4.2  │ Read - HBM Stall              │ HBM Stall              │ Read          │  0.00 │  0.00 │  0.00 │ Pct    │
╘═════════╧═══════════════════════════════╧════════════════════════╧═══════════════╧═══════╧═══════╧═══════╧════════╛
17.5 L2 - Fabric Detailed Transaction Breakdown
╒═════════╤═════════════════╤══════════════╤══════════════╤══════════════╤════════════════╕
│ Index   │ Metric          │          Avg │          Min │          Max │ Unit           │
╞═════════╪═════════════════╪══════════════╪══════════════╪══════════════╪════════════════╡
│ 17.5.0  │ Read (32B)      │         0.00 │         0.00 │         0.00 │ Req per kernel │
├─────────┼─────────────────┼──────────────┼──────────────┼──────────────┼────────────────┤
│ 17.5.1  │ Read (Uncached) │       562.00 │       562.00 │       562.00 │ Req per kernel │
├─────────┼─────────────────┼──────────────┼──────────────┼──────────────┼────────────────┤
│ 17.5.2  │ Read (64B)      │ 671088926.00 │ 671088926.00 │ 671088926.00 │ Req per kernel │
├─────────┼─────────────────┼──────────────┼──────────────┼──────────────┼────────────────┤
│ 17.5.3  │ HBM Read        │       281.00 │       281.00 │       281.00 │ Req per kernel │
├─────────┼─────────────────┼──────────────┼──────────────┼──────────────┼────────────────┤
│ 17.5.4  │ Remote Read     │ 671088645.00 │ 671088645.00 │ 671088645.00 │ Req per kernel │
╘═════════╧═════════════════╧══════════════╧══════════════╧══════════════╧════════════════╛
Here we see a similar result to our previous experiment, with one key difference: our accesses are no longer marked as Uncached Read requests (17.2.3, 17.5.1), but instead are 64B read requests (17.5.2), as observed in our Coarse-grained, accelerator-local HBM experiment.
Experiment 6: Fine-grained, CPU-DRAM writes#
Thus far in our exploration of the L2-Fabric interface, we have
primarily focused on read operations. However, in
our request flow diagram, we note that writes are
counted separately. To observe this, we use the -p flag to trigger write
operations to fine-grained memory allocated on the host:
$ omniperf profile -n fine_grained_host_write --no-roof -- ./fabric -t 0 -o 1 -p 1
Using:
  mtype:FineGrained
  mowner:Host
  mspace:Global
  mop:Write
  mdata:Unsigned
  remoteId:-1
<...>
$ omniperf analyze -p workloads/fine_grained_host_writes/mi200 -b 17.2.4 17.2.5 17.2.6 17.2.7 17.2.8 17.4.3 17.4.4 17.4.5 17.4.6 17.5.5 17.5.6 17.5.7 17.5.8 17.5.9 17.5.10 -n per_kernel --dispatch 2
<...>
17. L2 Cache
17.2 L2 - Fabric Transactions
╒═════════╤═══════════════════════════════════╤════════════════╤════════════════╤════════════════╤══════════════════╕
│ Index   │ Metric                            │            Avg │            Min │            Max │ Unit             │
╞═════════╪═══════════════════════════════════╪════════════════╪════════════════╪════════════════╪══════════════════╡
│ 17.2.4  │ L2-Fabric Write and Atomic BW     │ 42949672960.00 │ 42949672960.00 │ 42949672960.00 │ Bytes per kernel │
├─────────┼───────────────────────────────────┼────────────────┼────────────────┼────────────────┼──────────────────┤
│ 17.2.5  │ HBM Write and Atomic Traffic      │           0.00 │           0.00 │           0.00 │ Pct              │
├─────────┼───────────────────────────────────┼────────────────┼────────────────┼────────────────┼──────────────────┤
│ 17.2.6  │ Remote Write and Atomic Traffic   │         100.00 │         100.00 │         100.00 │ Pct              │
├─────────┼───────────────────────────────────┼────────────────┼────────────────┼────────────────┼──────────────────┤
│ 17.2.7  │ Atomic Traffic                    │           0.00 │           0.00 │           0.00 │ Pct              │
├─────────┼───────────────────────────────────┼────────────────┼────────────────┼────────────────┼──────────────────┤
│ 17.2.8  │ Uncached Write and Atomic Traffic │         100.00 │         100.00 │         100.00 │ Pct              │
╘═════════╧═══════════════════════════════════╧════════════════╧════════════════╧════════════════╧══════════════════╛
17.4 L2 - Fabric Interface Stalls
╒═════════╤════════════════════════════════╤════════════════════════╤═══════════════╤═══════╤═══════╤═══════╤════════╕
│ Index   │ Metric                         │ Type                   │ Transaction   │   Avg │   Min │   Max │ Unit   │
╞═════════╪════════════════════════════════╪════════════════════════╪═══════════════╪═══════╪═══════╪═══════╪════════╡
│ 17.4.3  │ Write - PCIe Stall             │ PCIe Stall             │ Write         │  0.00 │  0.00 │  0.00 │ Pct    │
├─────────┼────────────────────────────────┼────────────────────────┼───────────────┼───────┼───────┼───────┼────────┤
│ 17.4.4  │ Write - Infinity Fabric™ Stall │ Infinity Fabric™ Stall │ Write         │  0.00 │  0.00 │  0.00 │ Pct    │
├─────────┼────────────────────────────────┼────────────────────────┼───────────────┼───────┼───────┼───────┼────────┤
│ 17.4.5  │ Write - HBM Stall              │ HBM Stall              │ Write         │  0.00 │  0.00 │  0.00 │ Pct    │
├─────────┼────────────────────────────────┼────────────────────────┼───────────────┼───────┼───────┼───────┼────────┤
│ 17.4.6  │ Write - Credit Starvation      │ Credit Starvation      │ Write         │  0.00 │  0.00 │  0.00 │ Pct    │
╘═════════╧════════════════════════════════╧════════════════════════╧═══════════════╧═══════╧═══════╧═══════╧════════╛
17.5 L2 - Fabric Detailed Transaction Breakdown
╒═════════╤═════════════════════════╤══════════════╤══════════════╤══════════════╤════════════════╕
│ Index   │ Metric                  │          Avg │          Min │          Max │ Unit           │
╞═════════╪═════════════════════════╪══════════════╪══════════════╪══════════════╪════════════════╡
│ 17.5.5  │ Write (32B)             │         0.00 │         0.00 │         0.00 │ Req per kernel │
├─────────┼─────────────────────────┼──────────────┼──────────────┼──────────────┼────────────────┤
│ 17.5.6  │ Write (Uncached)        │ 671088640.00 │ 671088640.00 │ 671088640.00 │ Req per kernel │
├─────────┼─────────────────────────┼──────────────┼──────────────┼──────────────┼────────────────┤
│ 17.5.7  │ Write (64B)             │ 671088640.00 │ 671088640.00 │ 671088640.00 │ Req per kernel │
├─────────┼─────────────────────────┼──────────────┼──────────────┼──────────────┼────────────────┤
│ 17.5.8  │ HBM Write and Atomic    │         0.00 │         0.00 │         0.00 │ Req per kernel │
├─────────┼─────────────────────────┼──────────────┼──────────────┼──────────────┼────────────────┤
│ 17.5.9  │ Remote Write and Atomic │ 671088640.00 │ 671088640.00 │ 671088640.00 │ Req per kernel │
├─────────┼─────────────────────────┼──────────────┼──────────────┼──────────────┼────────────────┤
│ 17.5.10 │ Atomic                  │         0.00 │         0.00 │         0.00 │ Req per kernel │
╘═════════╧═════════════════════════╧══════════════╧══════════════╧══════════════╧════════════════╛
Here we notice a few changes in our request pattern:
As expected, the requests have changed from 64B Reads to 64B Write requests (17.5.7),
these requests are homed in on a “remote” destination (17.2.6, 17.5.9), as expected, and
these are also counted as a single Uncached Write request (17.5.6).
In addition, there are rather significant changes in the bandwidth values reported:
The “L2-Fabric Write and Atomic” bandwidth metric (17.2.4) reports about 40GiB of data written across Infinity Fabric while
The “Remote Write and Traffic” metric (17.2.5) indicates that nearly 100% of these request are being directed to a remote source.
The precise meaning of these metrics are explored in the subsequent experiment.
Finally, we note that we see no write stalls on the PCIe bus (17.4.3). This is because writes over a PCIe bus are non-posted, that is, they do not require acknowledgement.
Experiment 7: Fine-grained, CPU-DRAM atomicAdd#
Next, we change our experiment to instead target atomicAdd
operations to the CPU’s DRAM.
$ omniperf profile -n fine_grained_host_add --no-roof -- ./fabric -t 0 -o 1 -p 2
Using:
  mtype:FineGrained
  mowner:Host
  mspace:Global
  mop:Add
  mdata:Unsigned
  remoteId:-1
<...>
$ omniperf analyze -p workloads/fine_grained_host_add/mi200 -b 17.2.4 17.2.5 17.2.6 17.2.7 17.2.8 17.4.3 17.4.4 17.4.5 17.4.6 17.5.5 17.5.6 17.5.7 17.5.8 17.5.9 17.5.10 -n per_kernel --dispatch 2
<...>
17. L2 Cache
17.2 L2 - Fabric Transactions
╒═════════╤═══════════════════════════════════╤══════════════╤══════════════╤══════════════╤══════════════════╕
│ Index   │ Metric                            │          Avg │          Min │          Max │ Unit             │
╞═════════╪═══════════════════════════════════╪══════════════╪══════════════╪══════════════╪══════════════════╡
│ 17.2.4  │ L2-Fabric Write and Atomic BW     │ 429496736.00 │ 429496736.00 │ 429496736.00 │ Bytes per kernel │
├─────────┼───────────────────────────────────┼──────────────┼──────────────┼──────────────┼──────────────────┤
│ 17.2.5  │ HBM Write and Atomic Traffic      │         0.00 │         0.00 │         0.00 │ Pct              │
├─────────┼───────────────────────────────────┼──────────────┼──────────────┼──────────────┼──────────────────┤
│ 17.2.6  │ Remote Write and Atomic Traffic   │       100.00 │       100.00 │       100.00 │ Pct              │
├─────────┼───────────────────────────────────┼──────────────┼──────────────┼──────────────┼──────────────────┤
│ 17.2.7  │ Atomic Traffic                    │       100.00 │       100.00 │       100.00 │ Pct              │
├─────────┼───────────────────────────────────┼──────────────┼──────────────┼──────────────┼──────────────────┤
│ 17.2.8  │ Uncached Write and Atomic Traffic │       100.00 │       100.00 │       100.00 │ Pct              │
╘═════════╧═══════════════════════════════════╧══════════════╧══════════════╧══════════════╧══════════════════╛
17.4 L2 - Fabric Interface Stalls
╒═════════╤════════════════════════════════╤════════════════════════╤═══════════════╤═══════╤═══════╤═══════╤════════╕
│ Index   │ Metric                         │ Type                   │ Transaction   │   Avg │   Min │   Max │ Unit   │
╞═════════╪════════════════════════════════╪════════════════════════╪═══════════════╪═══════╪═══════╪═══════╪════════╡
│ 17.4.3  │ Write - PCIe Stall             │ PCIe Stall             │ Write         │  0.00 │  0.00 │  0.00 │ Pct    │
├─────────┼────────────────────────────────┼────────────────────────┼───────────────┼───────┼───────┼───────┼────────┤
│ 17.4.4  │ Write - Infinity Fabric™ Stall │ Infinity Fabric™ Stall │ Write         │  0.00 │  0.00 │  0.00 │ Pct    │
├─────────┼────────────────────────────────┼────────────────────────┼───────────────┼───────┼───────┼───────┼────────┤
│ 17.4.5  │ Write - HBM Stall              │ HBM Stall              │ Write         │  0.00 │  0.00 │  0.00 │ Pct    │
├─────────┼────────────────────────────────┼────────────────────────┼───────────────┼───────┼───────┼───────┼────────┤
│ 17.4.6  │ Write - Credit Starvation      │ Credit Starvation      │ Write         │  0.00 │  0.00 │  0.00 │ Pct    │
╘═════════╧════════════════════════════════╧════════════════════════╧═══════════════╧═══════╧═══════╧═══════╧════════╛
17.5 L2 - Fabric Detailed Transaction Breakdown
╒═════════╤═════════════════════════╤═════════════╤═════════════╤═════════════╤════════════════╕
│ Index   │ Metric                  │         Avg │         Min │         Max │ Unit           │
╞═════════╪═════════════════════════╪═════════════╪═════════════╪═════════════╪════════════════╡
│ 17.5.5  │ Write (32B)             │ 13421773.00 │ 13421773.00 │ 13421773.00 │ Req per kernel │
├─────────┼─────────────────────────┼─────────────┼─────────────┼─────────────┼────────────────┤
│ 17.5.6  │ Write (Uncached)        │ 13421773.00 │ 13421773.00 │ 13421773.00 │ Req per kernel │
├─────────┼─────────────────────────┼─────────────┼─────────────┼─────────────┼────────────────┤
│ 17.5.7  │ Write (64B)             │        0.00 │        0.00 │        0.00 │ Req per kernel │
├─────────┼─────────────────────────┼─────────────┼─────────────┼─────────────┼────────────────┤
│ 17.5.8  │ HBM Write and Atomic    │        0.00 │        0.00 │        0.00 │ Req per kernel │
├─────────┼─────────────────────────┼─────────────┼─────────────┼─────────────┼────────────────┤
│ 17.5.9  │ Remote Write and Atomic │ 13421773.00 │ 13421773.00 │ 13421773.00 │ Req per kernel │
├─────────┼─────────────────────────┼─────────────┼─────────────┼─────────────┼────────────────┤
│ 17.5.10 │ Atomic                  │ 13421773.00 │ 13421773.00 │ 13421773.00 │ Req per kernel │
╘═════════╧═════════════════════════╧═════════════╧═════════════╧═════════════╧════════════════╛
In this case, there is quite a lot to unpack:
For the first time, the 32B Write requests (17.5.5) are heavily used.
These correspond to Atomic requests (17.2.7, 17.5.10), and are counted as Uncached Writes (17.5.6).
The L2-Fabric Write and Atomic bandwidth metric (17.2.4) shows about 0.4 GiB of traffic. For convenience, the sample reduces the default problem size for this case due to the speed of atomics across a PCIe bus, and finally,
The traffic is directed to a remote device (17.2.6, 17.5.9).
Let’s consider what an “atomic” request means in this context. Recall that we are discussing memory traffic flowing from the L2 cache, the device-wide coherence point on current CDNA accelerators such as the MI250, to for example, the CPU’s DRAM. In this light, we see that these requests correspond to system scope atomics, and specifically in the case of the MI250, to fine-grained memory.
Disclaimer
PCIe® is a registered trademark of PCI-SIG Corporation.
Vector memory operation counting#
Global / Generic (FLAT)#
For this example, consider the
vector memory sample distributed as a part of
Omniperf. This code launches many different versions of a simple
read/write/atomic-only kernels targeting various address spaces. For example,
below is our simple global_write kernel:
// write to a global pointer
__global__ void global_write(int* ptr, int zero) {
  ptr[threadIdx.x] = zero;
}
Note
This example was compiled and run on an MI250 accelerator using ROCm v5.6.0, and Omniperf v2.0.0.
$ hipcc -O3 --save-temps vmem.hip -o vmem
We have also chosen to include the --save-temps flag to save the
compiler temporary files, such as the generated CDNA assembly code, for
inspection.
Finally, we generate our omniperf profile as follows.
$ omniperf profile -n vmem --no-roof -- ./vmem
Design note#
This section explains some of the more peculiar lines of code in the example, for example, the use of compiler built-ins and explicit address space casting, and so forth.
// write to a generic pointer
typedef int __attribute__((address_space(0)))* generic_ptr;

__attribute__((noinline)) __device__ void generic_store(generic_ptr ptr, int zero) { *ptr = zero; }

__global__ void generic_write(int* ptr, int zero, int filter) {
  __shared__ int lds[1024];
  int* generic = (threadIdx.x < filter) ? &ptr[threadIdx.x] : &lds[threadIdx.x];
  generic_store((generic_ptr)generic, zero);
}
One of the aims of this example is to demonstrate the use of the “generic” FLAT address space. This address space is typically used when the compiler cannot statically prove where the backing memory is located.
To try to force the compiler to use this address space, we applied
__attribute__((noinline)) to the generic_store function to have the
compiler treat it as a function call (that is, on the other side of which, the
address space may not be known). However, in a trivial example such as this, the
compiler may choose to specialize the generic_store function to the two
address spaces that might provably be used from our translation unit, that is,
“local” (or, LDS) and “global”.
Hence, we forcibly cast the address space to
“generic” (or, FLAT) to avoid this compiler
optimization.
Warning
While convenient for this example, this sort of explicit address space casting can lead to strange compilation errors, and in the worst case, incorrect results. As a result, use is discouraged in production code.
For more details on address spaces, refer to Memory spaces.
Global write#
First, we demonstrate our simple global_write kernel:
$ omniperf analyze -p workloads/vmem/mi200/ --dispatch 1 -b 10.3 15.1.4 15.1.5 15.1.6 15.1.7 15.1.8 15.1.9 15.1.10 15.1.11  -n per_kernel
<...>
--------------------------------------------------------------------------------
0. Top Stat
╒════╤═════════════════════════════════════╤═════════╤═══════════╤════════════╤══════════════╤════════╕
│    │ KernelName                          │   Count │   Sum(ns) │   Mean(ns) │   Median(ns) │    Pct │
╞════╪═════════════════════════════════════╪═════════╪═══════════╪════════════╪══════════════╪════════╡
│  0 │ global_write(int*, int) [clone .kd] │    1.00 │   2400.00 │    2400.00 │      2400.00 │ 100.00 │
╘════╧═════════════════════════════════════╧═════════╧═══════════╧════════════╧══════════════╧════════╛


--------------------------------------------------------------------------------
10. Compute Units - Instruction Mix
10.3 VMEM Instr Mix
╒═════════╤═══════════════════════╤═══════╤═══════╤═══════╤══════════════════╕
│ Index   │ Metric                │   Avg │   Min │   Max │ Unit             │
╞═════════╪═══════════════════════╪═══════╪═══════╪═══════╪══════════════════╡
│ 10.3.0  │ Global/Generic Instr  │  1.00 │  1.00 │  1.00 │ Instr per kernel │
├─────────┼───────────────────────┼───────┼───────┼───────┼──────────────────┤
│ 10.3.1  │ Global/Generic Read   │  0.00 │  0.00 │  0.00 │ Instr per kernel │
├─────────┼───────────────────────┼───────┼───────┼───────┼──────────────────┤
│ 10.3.2  │ Global/Generic Write  │  1.00 │  1.00 │  1.00 │ Instr per kernel │
├─────────┼───────────────────────┼───────┼───────┼───────┼──────────────────┤
│ 10.3.3  │ Global/Generic Atomic │  0.00 │  0.00 │  0.00 │ Instr per kernel │
├─────────┼───────────────────────┼───────┼───────┼───────┼──────────────────┤
│ 10.3.4  │ Spill/Stack Instr     │  0.00 │  0.00 │  0.00 │ Instr per kernel │
├─────────┼───────────────────────┼───────┼───────┼───────┼──────────────────┤
│ 10.3.5  │ Spill/Stack Read      │  0.00 │  0.00 │  0.00 │ Instr per kernel │
├─────────┼───────────────────────┼───────┼───────┼───────┼──────────────────┤
│ 10.3.6  │ Spill/Stack Write     │  0.00 │  0.00 │  0.00 │ Instr per kernel │
├─────────┼───────────────────────┼───────┼───────┼───────┼──────────────────┤
│ 10.3.7  │ Spill/Stack Atomic    │  0.00 │  0.00 │  0.00 │ Instr per kernel │
╘═════════╧═══════════════════════╧═══════╧═══════╧═══════╧══════════════════╛


--------------------------------------------------------------------------------
15. Address Processing Unit and Data Return Path (TA/TD)
15.1 Address Processing Unit
╒═════════╤═════════════════════════════╤═══════╤═══════╤═══════╤══════════════════╕
│ Index   │ Metric                      │   Avg │   Min │   Max │ Unit             │
╞═════════╪═════════════════════════════╪═══════╪═══════╪═══════╪══════════════════╡
│ 15.1.4  │ Total Instructions          │  1.00 │  1.00 │  1.00 │ Instr per kernel │
├─────────┼─────────────────────────────┼───────┼───────┼───────┼──────────────────┤
│ 15.1.5  │ Global/Generic Instr        │  1.00 │  1.00 │  1.00 │ Instr per kernel │
├─────────┼─────────────────────────────┼───────┼───────┼───────┼──────────────────┤
│ 15.1.6  │ Global/Generic Read Instr   │  0.00 │  0.00 │  0.00 │ Instr per kernel │
├─────────┼─────────────────────────────┼───────┼───────┼───────┼──────────────────┤
│ 15.1.7  │ Global/Generic Write Instr  │  1.00 │  1.00 │  1.00 │ Instr per kernel │
├─────────┼─────────────────────────────┼───────┼───────┼───────┼──────────────────┤
│ 15.1.8  │ Global/Generic Atomic Instr │  0.00 │  0.00 │  0.00 │ Instr per kernel │
├─────────┼─────────────────────────────┼───────┼───────┼───────┼──────────────────┤
│ 15.1.9  │ Spill/Stack Instr           │  0.00 │  0.00 │  0.00 │ Instr per kernel │
├─────────┼─────────────────────────────┼───────┼───────┼───────┼──────────────────┤
│ 15.1.10 │ Spill/Stack Read Instr      │  0.00 │  0.00 │  0.00 │ Instr per kernel │
├─────────┼─────────────────────────────┼───────┼───────┼───────┼──────────────────┤
│ 15.1.11 │ Spill/Stack Write Instr     │  0.00 │  0.00 │  0.00 │ Instr per kernel │
╘═════════╧═════════════════════════════╧═══════╧═══════╧═══════╧══════════════════╛
Here, we have presented both the information in the VMEM Instruction Mix table (10.3) and the Address Processing Unit (15.1). We note that this data is expected to be identical, and hence we omit table 15.1 in our subsequent examples.
In addition, as expected, we see a single Global/Generic Write instruction (10.3.2, 15.1.7). Inspecting the generated assembly, we get:
        .protected      _Z12global_writePii     ; -- Begin function _Z12global_writePii
        .globl  _Z12global_writePii
        .p2align        8
        .type   _Z12global_writePii,@function
_Z12global_writePii:                    ; @_Z12global_writePii
; %bb.0:
        s_load_dword s2, s[4:5], 0x8
        s_load_dwordx2 s[0:1], s[4:5], 0x0
        v_lshlrev_b32_e32 v0, 2, v0
        s_waitcnt lgkmcnt(0)
        v_mov_b32_e32 v1, s2
        global_store_dword v0, v1, s[0:1]
        s_endpgm
        .section        .rodata,#alloc
        .p2align        6, 0x0
        .amdhsa_kernel _Z12global_writePii
Notice that this corresponds to an instance of a global_store_dword
operation.
Note
The assembly in these experiments were generated for an MI2XX accelerator using ROCm 5.6.0, and may change depending on ROCm versions and the targeted hardware architecture.
Generic write to LDS#
Next, we examine a generic write. As discussed
previously, our generic_write kernel uses an
address space cast to force the compiler to choose our desired address
space, regardless of other optimizations that may be possible.
Also note that the filter parameter passed in as a kernel argument (see
example and
design note) is set to zero on the host, such
that we always write to the local (LDS)
memory allocation lds.
Examining this kernel in the VMEM Instruction Mix table yields:
$ omniperf analyze -p workloads/vmem/mi200/ --dispatch 2 -b 10.3 -n per_kernel
<...>
0. Top Stat
╒════╤══════════════════════════════════════════╤═════════╤═══════════╤════════════╤══════════════╤════════╕
│    │ KernelName                               │   Count │   Sum(ns) │   Mean(ns) │   Median(ns) │    Pct │
╞════╪══════════════════════════════════════════╪═════════╪═══════════╪════════════╪══════════════╪════════╡
│  0 │ generic_write(int*, int, int) [clone .kd │    1.00 │   2880.00 │    2880.00 │      2880.00 │ 100.00 │
│    │ ]                                        │         │           │            │              │        │
╘════╧══════════════════════════════════════════╧═════════╧═══════════╧════════════╧══════════════╧════════╛


--------------------------------------------------------------------------------
10. Compute Units - Instruction Mix
10.3 VMEM Instr Mix
╒═════════╤═══════════════════════╤═══════╤═══════╤═══════╤══════════════════╕
│ Index   │ Metric                │   Avg │   Min │   Max │ Unit             │
╞═════════╪═══════════════════════╪═══════╪═══════╪═══════╪══════════════════╡
│ 10.3.0  │ Global/Generic Instr  │  1.00 │  1.00 │  1.00 │ Instr per kernel │
├─────────┼───────────────────────┼───────┼───────┼───────┼──────────────────┤
│ 10.3.1  │ Global/Generic Read   │  0.00 │  0.00 │  0.00 │ Instr per kernel │
├─────────┼───────────────────────┼───────┼───────┼───────┼──────────────────┤
│ 10.3.2  │ Global/Generic Write  │  1.00 │  1.00 │  1.00 │ Instr per kernel │
├─────────┼───────────────────────┼───────┼───────┼───────┼──────────────────┤
│ 10.3.3  │ Global/Generic Atomic │  0.00 │  0.00 │  0.00 │ Instr per kernel │
├─────────┼───────────────────────┼───────┼───────┼───────┼──────────────────┤
│ 10.3.4  │ Spill/Stack Instr     │  0.00 │  0.00 │  0.00 │ Instr per kernel │
├─────────┼───────────────────────┼───────┼───────┼───────┼──────────────────┤
│ 10.3.5  │ Spill/Stack Read      │  0.00 │  0.00 │  0.00 │ Instr per kernel │
├─────────┼───────────────────────┼───────┼───────┼───────┼──────────────────┤
│ 10.3.6  │ Spill/Stack Write     │  0.00 │  0.00 │  0.00 │ Instr per kernel │
├─────────┼───────────────────────┼───────┼───────┼───────┼──────────────────┤
│ 10.3.7  │ Spill/Stack Atomic    │  0.00 │  0.00 │  0.00 │ Instr per kernel │
╘═════════╧═══════════════════════╧═══════╧═══════╧═══════╧══════════════════╛
As expected we see a single generic write (10.3.2). In the assembly
generated for this kernel (in particular, we care about the
generic_store function), we see that this corresponds to a
flat_store_dword instruction:
        .type   _Z13generic_storePii,@function
_Z13generic_storePii:                   ; @_Z13generic_storePii
; %bb.0:
        s_waitcnt vmcnt(0) expcnt(0) lgkmcnt(0)
        flat_store_dword v[0:1], v2
        s_waitcnt vmcnt(0) lgkmcnt(0)
        s_setpc_b64 s[30:31]
.Lfunc_end0:
In addition, we note that we can observe the destination of this request by looking at the LDS Instructions metric (12.2.0) – which indicates one LDS access.
$ omniperf analyze -p workloads/vmem/mi200/ --dispatch 2 -b 12.2.0 -n per_kernel
<...>
12. Local Data Share (LDS)
12.2 LDS Stats
╒═════════╤════════════╤═══════╤═══════╤═══════╤══════════════════╕
│ Index   │ Metric     │   Avg │   Min │   Max │ Unit             │
╞═════════╪════════════╪═══════╪═══════╪═══════╪══════════════════╡
│ 12.2.0  │ LDS Instrs │  1.00 │  1.00 │  1.00 │ Instr per kernel │
╘═════════╧════════════╧═══════╧═══════╧═══════╧══════════════════╛
Note
Exercise for the reader: if this access had been targeted at global memory
(for instance, by changing value of filter), where should we look for the
memory traffic? Hint: see the generic read example.
Global read#
Next, we examine a simple global read operation:
__global__ void global_read(int* ptr, int zero) {
  int x = ptr[threadIdx.x];
  if (x != zero) {
    ptr[threadIdx.x] = x + 1;
  }
}
Here we observe a now familiar pattern:
Read a value in from global memory.
Have a write hidden behind a conditional that is impossible for the compiler to statically eliminate, but is identically false. In this case, our
main()function initializes the data inptrto zero.
Running Omniperf on this kernel yields:
$ omniperf analyze -p workloads/vmem/mi200/ --dispatch 3 -b 10.3 -n per_kernel
<...>
0. Top Stat
╒════╤════════════════════════════════════╤═════════╤═══════════╤════════════╤══════════════╤════════╕
│    │ KernelName                         │   Count │   Sum(ns) │   Mean(ns) │   Median(ns) │    Pct │
╞════╪════════════════════════════════════╪═════════╪═══════════╪════════════╪══════════════╪════════╡
│  0 │ global_read(int*, int) [clone .kd] │    1.00 │   4480.00 │    4480.00 │      4480.00 │ 100.00 │
╘════╧════════════════════════════════════╧═════════╧═══════════╧════════════╧══════════════╧════════╛


--------------------------------------------------------------------------------
10. Compute Units - Instruction Mix
10.3 VMEM Instr Mix
╒═════════╤═══════════════════════╤═══════╤═══════╤═══════╤══════════════════╕
│ Index   │ Metric                │   Avg │   Min │   Max │ Unit             │
╞═════════╪═══════════════════════╪═══════╪═══════╪═══════╪══════════════════╡
│ 10.3.0  │ Global/Generic Instr  │  1.00 │  1.00 │  1.00 │ Instr per kernel │
├─────────┼───────────────────────┼───────┼───────┼───────┼──────────────────┤
│ 10.3.1  │ Global/Generic Read   │  1.00 │  1.00 │  1.00 │ Instr per kernel │
├─────────┼───────────────────────┼───────┼───────┼───────┼──────────────────┤
│ 10.3.2  │ Global/Generic Write  │  0.00 │  0.00 │  0.00 │ Instr per kernel │
├─────────┼───────────────────────┼───────┼───────┼───────┼──────────────────┤
│ 10.3.3  │ Global/Generic Atomic │  0.00 │  0.00 │  0.00 │ Instr per kernel │
├─────────┼───────────────────────┼───────┼───────┼───────┼──────────────────┤
│ 10.3.4  │ Spill/Stack Instr     │  0.00 │  0.00 │  0.00 │ Instr per kernel │
├─────────┼───────────────────────┼───────┼───────┼───────┼──────────────────┤
│ 10.3.5  │ Spill/Stack Read      │  0.00 │  0.00 │  0.00 │ Instr per kernel │
├─────────┼───────────────────────┼───────┼───────┼───────┼──────────────────┤
│ 10.3.6  │ Spill/Stack Write     │  0.00 │  0.00 │  0.00 │ Instr per kernel │
├─────────┼───────────────────────┼───────┼───────┼───────┼──────────────────┤
│ 10.3.7  │ Spill/Stack Atomic    │  0.00 │  0.00 │  0.00 │ Instr per kernel │
╘═════════╧═══════════════════════╧═══════╧═══════╧═══════╧══════════════════╛
Here we see a single global/generic instruction (10.3.0) which, as expected, is a read (10.3.1).
Generic read from global memory#
For our generic read example, we choose to change our target for the generic read to be global memory:
__global__ void generic_read(int* ptr, int zero, int filter) {
  __shared__ int lds[1024];
  if (static_cast<int>(filter - 1) == zero) {
    lds[threadIdx.x] = 0; // initialize to zero to avoid conditional, but hide behind _another_ conditional
  }
  int* generic;
  if (static_cast<int>(threadIdx.x) > filter - 1) {
    generic = &ptr[threadIdx.x];
  } else {
    generic = &lds[threadIdx.x];
    abort();
  }
  int x = generic_load((generic_ptr)generic);
  if (x != zero) {
    ptr[threadIdx.x] = x + 1;
  }
}
In addition to our usual if (condition_that_wont_happen) guard
around the write operation, there is an additional conditional around
the initialization of the lds buffer. We note that it’s typically
required to write to this buffer to prevent the compiler from
eliminating the local memory branch entirely due to undefined behavior
(use of an uninitialized value). However, to report only our global
memory read, we again hide this initialization behind an identically
false conditional (both zero and filter are set to zero in the
kernel launch). Note that this is a different conditional from our
pointer assignment (to avoid combination of the two).
Running Omniperf on this kernel reports:
$ omniperf analyze -p workloads/vmem/mi200/ --dispatch 4 -b 10.3 12.2.0 16.3.10 -n per_kernel
<...>
0. Top Stat
╒════╤══════════════════════════════════════════╤═════════╤═══════════╤════════════╤══════════════╤════════╕
│    │ KernelName                               │   Count │   Sum(ns) │   Mean(ns) │   Median(ns) │    Pct │
╞════╪══════════════════════════════════════════╪═════════╪═══════════╪════════════╪══════════════╪════════╡
│  0 │ generic_read(int*, int, int) [clone .kd] │    1.00 │   2240.00 │    2240.00 │      2240.00 │ 100.00 │
╘════╧══════════════════════════════════════════╧═════════╧═══════════╧════════════╧══════════════╧════════╛


--------------------------------------------------------------------------------
10. Compute Units - Instruction Mix
10.3 VMEM Instr Mix
╒═════════╤═══════════════════════╤═══════╤═══════╤═══════╤══════════════════╕
│ Index   │ Metric                │   Avg │   Min │   Max │ Unit             │
╞═════════╪═══════════════════════╪═══════╪═══════╪═══════╪══════════════════╡
│ 10.3.0  │ Global/Generic Instr  │  1.00 │  1.00 │  1.00 │ Instr per kernel │
├─────────┼───────────────────────┼───────┼───────┼───────┼──────────────────┤
│ 10.3.1  │ Global/Generic Read   │  1.00 │  1.00 │  1.00 │ Instr per kernel │
├─────────┼───────────────────────┼───────┼───────┼───────┼──────────────────┤
│ 10.3.2  │ Global/Generic Write  │  0.00 │  0.00 │  0.00 │ Instr per kernel │
├─────────┼───────────────────────┼───────┼───────┼───────┼──────────────────┤
│ 10.3.3  │ Global/Generic Atomic │  0.00 │  0.00 │  0.00 │ Instr per kernel │
├─────────┼───────────────────────┼───────┼───────┼───────┼──────────────────┤
│ 10.3.4  │ Spill/Stack Instr     │  0.00 │  0.00 │  0.00 │ Instr per kernel │
├─────────┼───────────────────────┼───────┼───────┼───────┼──────────────────┤
│ 10.3.5  │ Spill/Stack Read      │  0.00 │  0.00 │  0.00 │ Instr per kernel │
├─────────┼───────────────────────┼───────┼───────┼───────┼──────────────────┤
│ 10.3.6  │ Spill/Stack Write     │  0.00 │  0.00 │  0.00 │ Instr per kernel │
├─────────┼───────────────────────┼───────┼───────┼───────┼──────────────────┤
│ 10.3.7  │ Spill/Stack Atomic    │  0.00 │  0.00 │  0.00 │ Instr per kernel │
╘═════════╧═══════════════════════╧═══════╧═══════╧═══════╧══════════════════╛


--------------------------------------------------------------------------------
12. Local Data Share (LDS)
12.2 LDS Stats
╒═════════╤════════════╤═══════╤═══════╤═══════╤══════════════════╕
│ Index   │ Metric     │   Avg │   Min │   Max │ Unit             │
╞═════════╪════════════╪═══════╪═══════╪═══════╪══════════════════╡
│ 12.2.0  │ LDS Instrs │  0.00 │  0.00 │  0.00 │ Instr per kernel │
╘═════════╧════════════╧═══════╧═══════╧═══════╧══════════════════╛


--------------------------------------------------------------------------------
16. Vector L1 Data Cache
16.3 L1D Cache Accesses
╒═════════╤════════════╤═══════╤═══════╤═══════╤════════════════╕
│ Index   │ Metric     │   Avg │   Min │   Max │ Unit           │
╞═════════╪════════════╪═══════╪═══════╪═══════╪════════════════╡
│ 16.3.10 │ L1-L2 Read │  1.00 │  1.00 │  1.00 │ Req per kernel │
╘═════════╧════════════╧═══════╧═══════╧═══════╧════════════════╛
Here we observe:
A single global/generic read operation (10.3.1), which
Is not an LDS instruction (12.2), as seen in the generic write example, but is instead
An L1-L2 read operation (16.3.10)
That is, we have successfully targeted our generic read at global
memory. Inspecting the assembly shows this corresponds to a
flat_load_dword instruction.
Global atomic#
Our global atomic kernel simply atomically adds a (non-compile-time) zero value to a pointer.
__global__ void global_atomic(int* ptr, int zero) {
  atomicAdd(ptr, zero);
}
Running Omniperf on this kernel yields:
$ omniperf analyze -p workloads/vmem/mi200/ --dispatch 5 -b 10.3 16.3.12 -n per_kernel
<...>
0. Top Stat
╒════╤══════════════════════════════════════╤═════════╤═══════════╤════════════╤══════════════╤════════╕
│    │ KernelName                           │   Count │   Sum(ns) │   Mean(ns) │   Median(ns) │    Pct │
╞════╪══════════════════════════════════════╪═════════╪═══════════╪════════════╪══════════════╪════════╡
│  0 │ global_atomic(int*, int) [clone .kd] │    1.00 │   4640.00 │    4640.00 │      4640.00 │ 100.00 │
╘════╧══════════════════════════════════════╧═════════╧═══════════╧════════════╧══════════════╧════════╛


--------------------------------------------------------------------------------
10. Compute Units - Instruction Mix
10.3 VMEM Instr Mix
╒═════════╤═══════════════════════╤═══════╤═══════╤═══════╤══════════════════╕
│ Index   │ Metric                │   Avg │   Min │   Max │ Unit             │
╞═════════╪═══════════════════════╪═══════╪═══════╪═══════╪══════════════════╡
│ 10.3.0  │ Global/Generic Instr  │  1.00 │  1.00 │  1.00 │ Instr per kernel │
├─────────┼───────────────────────┼───────┼───────┼───────┼──────────────────┤
│ 10.3.1  │ Global/Generic Read   │  0.00 │  0.00 │  0.00 │ Instr per kernel │
├─────────┼───────────────────────┼───────┼───────┼───────┼──────────────────┤
│ 10.3.2  │ Global/Generic Write  │  0.00 │  0.00 │  0.00 │ Instr per kernel │
├─────────┼───────────────────────┼───────┼───────┼───────┼──────────────────┤
│ 10.3.3  │ Global/Generic Atomic │  1.00 │  1.00 │  1.00 │ Instr per kernel │
├─────────┼───────────────────────┼───────┼───────┼───────┼──────────────────┤
│ 10.3.4  │ Spill/Stack Instr     │  0.00 │  0.00 │  0.00 │ Instr per kernel │
├─────────┼───────────────────────┼───────┼───────┼───────┼──────────────────┤
│ 10.3.5  │ Spill/Stack Read      │  0.00 │  0.00 │  0.00 │ Instr per kernel │
├─────────┼───────────────────────┼───────┼───────┼───────┼──────────────────┤
│ 10.3.6  │ Spill/Stack Write     │  0.00 │  0.00 │  0.00 │ Instr per kernel │
├─────────┼───────────────────────┼───────┼───────┼───────┼──────────────────┤
│ 10.3.7  │ Spill/Stack Atomic    │  0.00 │  0.00 │  0.00 │ Instr per kernel │
╘═════════╧═══════════════════════╧═══════╧═══════╧═══════╧══════════════════╛


--------------------------------------------------------------------------------
16. Vector L1 Data Cache
16.3 L1D Cache Accesses
╒═════════╤══════════════╤═══════╤═══════╤═══════╤════════════════╕
│ Index   │ Metric       │   Avg │   Min │   Max │ Unit           │
╞═════════╪══════════════╪═══════╪═══════╪═══════╪════════════════╡
│ 16.3.12 │ L1-L2 Atomic │  1.00 │  1.00 │  1.00 │ Req per kernel │
╘═════════╧══════════════╧═══════╧═══════╧═══════╧════════════════╛
Here we see a single global/generic atomic instruction (10.3.3), which corresponds to an L1-L2 atomic request (16.3.12).
Generic, mixed atomic#
In our final global/generic example, we look at a case where our generic operation targets both LDS and global memory:
__global__ void generic_atomic(int* ptr, int filter, int zero) {
  __shared__ int lds[1024];
  int* generic = (threadIdx.x % 2 == filter) ? &ptr[threadIdx.x] : &lds[threadIdx.x];
  generic_atomic((generic_ptr)generic, zero);
}
This assigns every other work-item to atomically update global memory or local memory.
Running this kernel through Omniperf shows:
$ omniperf analyze -p workloads/vmem/mi200/ --dispatch 6 -b 10.3 12.2.0 16.3.12 -n per_kernel
<...>
0. Top Stat
╒════╤══════════════════════════════════════════╤═════════╤═══════════╤════════════╤══════════════╤════════╕
│    │ KernelName                               │   Count │   Sum(ns) │   Mean(ns) │   Median(ns) │    Pct │
╞════╪══════════════════════════════════════════╪═════════╪═══════════╪════════════╪══════════════╪════════╡
│  0 │ generic_atomic(int*, int, int) [clone .k │    1.00 │   3360.00 │    3360.00 │      3360.00 │ 100.00 │
│    │ d]                                       │         │           │            │              │        │
╘════╧══════════════════════════════════════════╧═════════╧═══════════╧════════════╧══════════════╧════════╛


10. Compute Units - Instruction Mix
10.3 VMEM Instr Mix
╒═════════╤═══════════════════════╤═══════╤═══════╤═══════╤══════════════════╕
│ Index   │ Metric                │   Avg │   Min │   Max │ Unit             │
╞═════════╪═══════════════════════╪═══════╪═══════╪═══════╪══════════════════╡
│ 10.3.0  │ Global/Generic Instr  │  1.00 │  1.00 │  1.00 │ Instr per kernel │
├─────────┼───────────────────────┼───────┼───────┼───────┼──────────────────┤
│ 10.3.1  │ Global/Generic Read   │  0.00 │  0.00 │  0.00 │ Instr per kernel │
├─────────┼───────────────────────┼───────┼───────┼───────┼──────────────────┤
│ 10.3.2  │ Global/Generic Write  │  0.00 │  0.00 │  0.00 │ Instr per kernel │
├─────────┼───────────────────────┼───────┼───────┼───────┼──────────────────┤
│ 10.3.3  │ Global/Generic Atomic │  1.00 │  1.00 │  1.00 │ Instr per kernel │
├─────────┼───────────────────────┼───────┼───────┼───────┼──────────────────┤
│ 10.3.4  │ Spill/Stack Instr     │  0.00 │  0.00 │  0.00 │ Instr per kernel │
├─────────┼───────────────────────┼───────┼───────┼───────┼──────────────────┤
│ 10.3.5  │ Spill/Stack Read      │  0.00 │  0.00 │  0.00 │ Instr per kernel │
├─────────┼───────────────────────┼───────┼───────┼───────┼──────────────────┤
│ 10.3.6  │ Spill/Stack Write     │  0.00 │  0.00 │  0.00 │ Instr per kernel │
├─────────┼───────────────────────┼───────┼───────┼───────┼──────────────────┤
│ 10.3.7  │ Spill/Stack Atomic    │  0.00 │  0.00 │  0.00 │ Instr per kernel │
╘═════════╧═══════════════════════╧═══════╧═══════╧═══════╧══════════════════╛


--------------------------------------------------------------------------------
12. Local Data Share (LDS)
12.2 LDS Stats
╒═════════╤════════════╤═══════╤═══════╤═══════╤══════════════════╕
│ Index   │ Metric     │   Avg │   Min │   Max │ Unit             │
╞═════════╪════════════╪═══════╪═══════╪═══════╪══════════════════╡
│ 12.2.0  │ LDS Instrs │  1.00 │  1.00 │  1.00 │ Instr per kernel │
╘═════════╧════════════╧═══════╧═══════╧═══════╧══════════════════╛


--------------------------------------------------------------------------------
16. Vector L1 Data Cache
16.3 L1D Cache Accesses
╒═════════╤══════════════╤═══════╤═══════╤═══════╤════════════════╕
│ Index   │ Metric       │   Avg │   Min │   Max │ Unit           │
╞═════════╪══════════════╪═══════╪═══════╪═══════╪════════════════╡
│ 16.3.12 │ L1-L2 Atomic │  1.00 │  1.00 │  1.00 │ Req per kernel │
╘═════════╧══════════════╧═══════╧═══════╧═══════╧════════════════╛
That is, we see:
A single generic atomic instruction (10.3.3) that maps to both
An LDS instruction (12.2.0), and
An L1-L2 atomic request (16.3)
We have demonstrated the ability of the generic address space to dynamically target different backing memory.
Spill/Scratch (BUFFER)#
Next we examine the use of “Spill/Scratch” memory. On current CDNA
accelerators such as the MI2XX, this is implemented using
the private memory space, which maps to
“scratch” memory in AMDGPU hardware
terminology. This type of memory can be accessed via different instructions
depending on the specific architecture targeted. However, current CDNA
accelerators such as the MI2XX use so called buffer
instructions to access private memory in a simple (and typically) coalesced
manner. See
Sec. 9.1, “Vector Memory Buffer Instructions” of the CDNA2 ISA guide
for further reading on this instruction type.
We develop a simple kernel that uses stack memory:
#include <hip/hip_runtime.h>
__global__ void knl(int* out, int filter) {
  int x[1024];
  x[filter] = 0;
  if (threadIdx.x < filter)
    out[threadIdx.x] = x[threadIdx.x];
}
Our strategy here is to:
Create a large stack buffer (that cannot reasonably fit into registers) - Write to a compile-time unknown location on the stack, and then
Behind the typical compile-time unknown
if(condition_that_wont_happen)Read from a different, compile-time unknown, location on the stack and write to global memory to prevent the compiler from optimizing it out.
This example was compiled and run on an MI250 accelerator using ROCm v5.6.0, and Omniperf v2.0.0.
$ hipcc -O3 stack.hip -o stack.hip
And profiled using Omniperf:
$ omniperf profile -n stack --no-roof -- ./stack
<...>
$ omniperf analyze -p workloads/stack/mi200/  -b 10.3 16.3.11 -n per_kernel
<...>
10. Compute Units - Instruction Mix
10.3 VMEM Instr Mix
╒═════════╤═══════════════════════╤═══════╤═══════╤═══════╤══════════════════╕
│ Index   │ Metric                │   Avg │   Min │   Max │ Unit             │
╞═════════╪═══════════════════════╪═══════╪═══════╪═══════╪══════════════════╡
│ 10.3.0  │ Global/Generic Instr  │  0.00 │  0.00 │  0.00 │ Instr per kernel │
├─────────┼───────────────────────┼───────┼───────┼───────┼──────────────────┤
│ 10.3.1  │ Global/Generic Read   │  0.00 │  0.00 │  0.00 │ Instr per kernel │
├─────────┼───────────────────────┼───────┼───────┼───────┼──────────────────┤
│ 10.3.2  │ Global/Generic Write  │  0.00 │  0.00 │  0.00 │ Instr per kernel │
├─────────┼───────────────────────┼───────┼───────┼───────┼──────────────────┤
│ 10.3.3  │ Global/Generic Atomic │  0.00 │  0.00 │  0.00 │ Instr per kernel │
├─────────┼───────────────────────┼───────┼───────┼───────┼──────────────────┤
│ 10.3.4  │ Spill/Stack Instr     │  1.00 │  1.00 │  1.00 │ Instr per kernel │
├─────────┼───────────────────────┼───────┼───────┼───────┼──────────────────┤
│ 10.3.5  │ Spill/Stack Read      │  0.00 │  0.00 │  0.00 │ Instr per kernel │
├─────────┼───────────────────────┼───────┼───────┼───────┼──────────────────┤
│ 10.3.6  │ Spill/Stack Write     │  1.00 │  1.00 │  1.00 │ Instr per kernel │
├─────────┼───────────────────────┼───────┼───────┼───────┼──────────────────┤
│ 10.3.7  │ Spill/Stack Atomic    │  0.00 │  0.00 │  0.00 │ Instr per kernel │
╘═════════╧═══════════════════════╧═══════╧═══════╧═══════╧══════════════════╛


--------------------------------------------------------------------------------
16. Vector L1 Data Cache
16.3 L1D Cache Accesses
╒═════════╤═════════════╤═══════╤═══════╤═══════╤════════════════╕
│ Index   │ Metric      │   Avg │   Min │   Max │ Unit           │
╞═════════╪═════════════╪═══════╪═══════╪═══════╪════════════════╡
│ 16.3.11 │ L1-L2 Write │  1.00 │  1.00 │  1.00 │ Req per kernel │
╘═════════╧═════════════╧═══════╧═══════╧═══════╧════════════════╛
Here we see a single write to the stack (10.3.6), which corresponds to an L1-L2 write request (16.3.11), that is, the stack is backed by global memory and travels through the same memory hierarchy.
Instructions-per-cycle and utilizations example#
For this example, consider the instructions-per-cycle (IPC) example included with Omniperf.
This example is compiled using c++17 support:
$ hipcc -O3 ipc.hip -o ipc -std=c++17
and was run on an MI250 CDNA2 accelerator:
$ omniperf profile -n ipc --no-roof -- ./ipc
The results shown in this section are generally applicable to CDNA accelerators, but may vary between generations and specific products.
Design note#
The kernels in this example all execute a specific assembly operation
N times (1000, by default), for instance the vmov kernel:
template<int N=1000>
__device__ void vmov_op() {
    int dummy;
    if constexpr (N >= 1) {
        asm volatile("v_mov_b32 v0, v1\n" : : "{v31}"(dummy));
        vmov_op<N - 1>();
    }
}

template<int N=1000>
__global__ void vmov() {
    vmov_op<N>();
}
The kernels are then launched twice, once for a warm-up run, and once for measurement.
VALU utilization and IPC#
Now we can use our test to measure the achieved instructions-per-cycle
of various types of instructions. We start with a simple VALU
operation, i.e., a v_mov_b32 instruction, e.g.:
v_mov_b32 v0, v1
This instruction simply copies the contents from the source register
(v1) to the destination register (v0). Investigating this kernel
with Omniperf, we see:
$ omniperf analyze -p workloads/ipc/mi200/ --dispatch 7 -b 11.2
<...>
--------------------------------------------------------------------------------
0. Top Stat
╒════╤═══════════════════════════════╤═════════╤═════════════╤═════════════╤══════════════╤════════╕
│    │ KernelName                    │   Count │     Sum(ns) │    Mean(ns) │   Median(ns) │    Pct │
╞════╪═══════════════════════════════╪═════════╪═════════════╪═════════════╪══════════════╪════════╡
│  0 │ void vmov<1000>() [clone .kd] │    1.00 │ 99317423.00 │ 99317423.00 │  99317423.00 │ 100.00 │
╘════╧═══════════════════════════════╧═════════╧═════════════╧═════════════╧══════════════╧════════╛


--------------------------------------------------------------------------------
11. Compute Units - Compute Pipeline
11.2 Pipeline Stats
╒═════════╤═════════════════════╤═══════╤═══════╤═══════╤══════════════╕
│ Index   │ Metric              │ Avg   │ Min   │ Max   │ Unit         │
╞═════════╪═════════════════════╪═══════╪═══════╪═══════╪══════════════╡
│ 11.2.0  │ IPC                 │ 1.0   │ 1.0   │ 1.0   │ Instr/cycle  │
├─────────┼─────────────────────┼───────┼───────┼───────┼──────────────┤
│ 11.2.1  │ IPC (Issued)        │ 1.0   │ 1.0   │ 1.0   │ Instr/cycle  │
├─────────┼─────────────────────┼───────┼───────┼───────┼──────────────┤
│ 11.2.2  │ SALU Util           │ 0.0   │ 0.0   │ 0.0   │ Pct          │
├─────────┼─────────────────────┼───────┼───────┼───────┼──────────────┤
│ 11.2.3  │ VALU Util           │ 99.98 │ 99.98 │ 99.98 │ Pct          │
├─────────┼─────────────────────┼───────┼───────┼───────┼──────────────┤
│ 11.2.4  │ VMEM Util           │ 0.0   │ 0.0   │ 0.0   │ Pct          │
├─────────┼─────────────────────┼───────┼───────┼───────┼──────────────┤
│ 11.2.5  │ Branch Util         │ 0.1   │ 0.1   │ 0.1   │ Pct          │
├─────────┼─────────────────────┼───────┼───────┼───────┼──────────────┤
│ 11.2.6  │ VALU Active Threads │ 64.0  │ 64.0  │ 64.0  │ Threads      │
├─────────┼─────────────────────┼───────┼───────┼───────┼──────────────┤
│ 11.2.7  │ MFMA Util           │ 0.0   │ 0.0   │ 0.0   │ Pct          │
├─────────┼─────────────────────┼───────┼───────┼───────┼──────────────┤
│ 11.2.8  │ MFMA Instr Cycles   │       │       │       │ Cycles/instr │
╘═════════╧═════════════════════╧═══════╧═══════╧═══════╧══════════════╛
Here we see that:
Both the IPC (11.2.0) and “Issued” IPC (11.2.1) metrics are \(\sim 1\)
The VALU Utilization metric (11.2.3) is also \(\sim100\%\), and finally
The VALU Active Threads metric (11.2.4) is 64, i.e., the wavefront size on CDNA accelerators, as all threads in the wavefront are active.
We will explore the difference between the IPC (11.2.0) and “Issued” IPC (11.2.1) metrics in the next section.
Additionally, we notice a small (0.1%) Branch utilization (11.2.5). Inspecting the assembly of this kernel shows there are no branch operations, however recalling the note in the Pipeline statistics section:
The branch utilization <…> includes time spent in other instruction types (namely:
s_endpgm) that are typically a very small percentage of the overall kernel execution.
We see that this is coming from execution of the s_endpgm
instruction at the end of every wavefront.
Note
Technically, the cycle counts used in the denominators of our IPC metrics are actually in units of quad-cycles, a group of 4 consecutive cycles. However, a typical VALU instruction on CDNA accelerators runs for a single quad-cycle (see The AMD GCN Architecture - A Crash Course (slide 30)). Therefore, for simplicity, we simply report these metrics as “instructions per cycle”.
Exploring “issued” IPC via MFMA operations#
Warning
The MFMA assembly operations used in this example are inherently not portable to older CDNA architectures.
Unlike the simple quad-cycle v_mov_b32 operation discussed in our
previous example, some operations take many
quad-cycles to execute. For example, using the
AMD Matrix Instruction Calculator
we can see that some MFMA operations take 64 cycles, e.g.:
$ ./matrix_calculator.py --arch CDNA2 --detail-instruction --instruction v_mfma_f32_32x32x8bf16_1k
Architecture: CDNA2
Instruction: V_MFMA_F32_32X32X8BF16_1K
<...>
    Execution statistics:
        FLOPs: 16384
        Execution cycles: 64
        FLOPs/CU/cycle: 1024
        Can co-execute with VALU: True
        VALU co-execution cycles possible: 60
What happens to our IPC when we utilize this v_mfma_f32_32x32x8bf16_1k
instruction on a CDNA2 accelerator? To find out, we turn to our mfma kernel
in the IPC example:
$ omniperf analyze -p workloads/ipc/mi200/ --dispatch 8 -b 11.2 --decimal 4
<...>
--------------------------------------------------------------------------------
0. Top Stat
╒════╤═══════════════════════════════╤═════════╤═════════════════╤═════════════════╤═════════════════╤══════════╕
│    │ KernelName                    │   Count │         Sum(ns) │        Mean(ns) │      Median(ns) │      Pct │
╞════╪═══════════════════════════════╪═════════╪═════════════════╪═════════════════╪═════════════════╪══════════╡
│  0 │ void mfma<1000>() [clone .kd] │  1.0000 │ 1623167595.0000 │ 1623167595.0000 │ 1623167595.0000 │ 100.0000 │
╘════╧═══════════════════════════════╧═════════╧═════════════════╧═════════════════╧═════════════════╧══════════╛


--------------------------------------------------------------------------------
11. Compute Units - Compute Pipeline
11.2 Pipeline Stats
╒═════════╤═════════════════════╤═════════╤═════════╤═════════╤══════════════╕
│ Index   │ Metric              │     Avg │     Min │     Max │ Unit         │
╞═════════╪═════════════════════╪═════════╪═════════╪═════════╪══════════════╡
│ 11.2.0  │ IPC                 │  0.0626 │  0.0626 │  0.0626 │ Instr/cycle  │
├─────────┼─────────────────────┼─────────┼─────────┼─────────┼──────────────┤
│ 11.2.1  │ IPC (Issued)        │  1.0000 │  1.0000 │  1.0000 │ Instr/cycle  │
├─────────┼─────────────────────┼─────────┼─────────┼─────────┼──────────────┤
│ 11.2.2  │ SALU Util           │  0.0000 │  0.0000 │  0.0000 │ Pct          │
├─────────┼─────────────────────┼─────────┼─────────┼─────────┼──────────────┤
│ 11.2.3  │ VALU Util           │  6.2496 │  6.2496 │  6.2496 │ Pct          │
├─────────┼─────────────────────┼─────────┼─────────┼─────────┼──────────────┤
│ 11.2.4  │ VMEM Util           │  0.0000 │  0.0000 │  0.0000 │ Pct          │
├─────────┼─────────────────────┼─────────┼─────────┼─────────┼──────────────┤
│ 11.2.5  │ Branch Util         │  0.0062 │  0.0062 │  0.0062 │ Pct          │
├─────────┼─────────────────────┼─────────┼─────────┼─────────┼──────────────┤
│ 11.2.6  │ VALU Active Threads │ 64.0000 │ 64.0000 │ 64.0000 │ Threads      │
├─────────┼─────────────────────┼─────────┼─────────┼─────────┼──────────────┤
│ 11.2.7  │ MFMA Util           │ 99.9939 │ 99.9939 │ 99.9939 │ Pct          │
├─────────┼─────────────────────┼─────────┼─────────┼─────────┼──────────────┤
│ 11.2.8  │ MFMA Instr Cycles   │ 64.0000 │ 64.0000 │ 64.0000 │ Cycles/instr │
╘═════════╧═════════════════════╧═════════╧═════════╧═════════╧══════════════╛
In contrast to our VALU IPC example, we now see that the IPC metric (11.2.0) and Issued IPC (11.2.1) metric differ substantially. First, we see the VALU utilization (11.2.3) has decreased substantially, from nearly 100% to \(\sim6.25\%\). We note that this matches the ratio of: \(((Execution\ cycles) - (VALU\ coexecution\ cycles)) / (Execution\ cycles)\) reported by the matrix calculator, while the MFMA utilization (11.2.7) has increased to nearly 100%.
Recall that our v_mfma_f32_32x32x8bf16_1k instruction takes 64 cycles to
execute, or 16 quad-cycles, matching our observed MFMA Instruction
Cycles (11.2.8). That is, we have a single instruction executed every 16
quad-cycles, or \(1/16 = 0.0625\), which is almost identical to our IPC
metric (11.2.0). Why then is the Issued IPC metric (11.2.1) equal to 1.0?
Instead of simply counting the number of instructions issued and dividing by the number of cycles the CUs on the accelerator were active (as is done for 11.2.0), this metric is formulated differently, and instead counts the number of (non-internal) instructions issued divided by the number of (quad-) cycles where the scheduler was actively working on issuing instructions. Thus the Issued IPC metric (11.2.1) gives more of a sense of “what percent of the total number of scheduler cycles did a wave schedule an instruction?” while the IPC metric (11.2.0) indicates the ratio of the number of instructions executed over the total active CU cycles.
Warning
There are further complications of the Issued IPC metric (11.2.1) that make its use more complicated. We will be explore that in the following section. For these reasons, Omniperf typically promotes use of the regular IPC metric (11.2.0), e.g., in the top-level Speed-of-Light chart.
Internal instructions and IPC#
Next, we explore the concept of an “internal” instruction. From
The AMD GCN Architecture - A Crash Course (slide 29), we see a few candidates for internal instructions, and
we choose a s_nop instruction, which according to the
CDNA2 ISA guide:
Does nothing; it can be repeated in hardware up to eight times.
Here we choose to use the following no-op to make our point:
s_nop 0x0
Running this kernel through Omniperf yields:
$ omniperf analyze -p workloads/ipc/mi200/ --dispatch 9 -b 11.2
<...>
--------------------------------------------------------------------------------
0. Top Stat
╒════╤═══════════════════════════════╤═════════╤═════════════╤═════════════╤══════════════╤════════╕
│    │ KernelName                    │   Count │     Sum(ns) │    Mean(ns) │   Median(ns) │    Pct │
╞════╪═══════════════════════════════╪═════════╪═════════════╪═════════════╪══════════════╪════════╡
│  0 │ void snop<1000>() [clone .kd] │    1.00 │ 14221851.50 │ 14221851.50 │  14221851.50 │ 100.00 │
╘════╧═══════════════════════════════╧═════════╧═════════════╧═════════════╧══════════════╧════════╛


--------------------------------------------------------------------------------
11. Compute Units - Compute Pipeline
11.2 Pipeline Stats
╒═════════╤═════════════════════╤═══════╤═══════╤═══════╤══════════════╕
│ Index   │ Metric              │ Avg   │ Min   │ Max   │ Unit         │
╞═════════╪═════════════════════╪═══════╪═══════╪═══════╪══════════════╡
│ 11.2.0  │ IPC                 │ 6.79  │ 6.79  │ 6.79  │ Instr/cycle  │
├─────────┼─────────────────────┼───────┼───────┼───────┼──────────────┤
│ 11.2.1  │ IPC (Issued)        │ 1.0   │ 1.0   │ 1.0   │ Instr/cycle  │
├─────────┼─────────────────────┼───────┼───────┼───────┼──────────────┤
│ 11.2.2  │ SALU Util           │ 0.0   │ 0.0   │ 0.0   │ Pct          │
├─────────┼─────────────────────┼───────┼───────┼───────┼──────────────┤
│ 11.2.3  │ VALU Util           │ 0.0   │ 0.0   │ 0.0   │ Pct          │
├─────────┼─────────────────────┼───────┼───────┼───────┼──────────────┤
│ 11.2.4  │ VMEM Util           │ 0.0   │ 0.0   │ 0.0   │ Pct          │
├─────────┼─────────────────────┼───────┼───────┼───────┼──────────────┤
│ 11.2.5  │ Branch Util         │ 0.68  │ 0.68  │ 0.68  │ Pct          │
├─────────┼─────────────────────┼───────┼───────┼───────┼──────────────┤
│ 11.2.6  │ VALU Active Threads │       │       │       │ Threads      │
├─────────┼─────────────────────┼───────┼───────┼───────┼──────────────┤
│ 11.2.7  │ MFMA Util           │ 0.0   │ 0.0   │ 0.0   │ Pct          │
├─────────┼─────────────────────┼───────┼───────┼───────┼──────────────┤
│ 11.2.8  │ MFMA Instr Cycles   │       │       │       │ Cycles/instr │
╘═════════╧═════════════════════╧═══════╧═══════╧═══════╧══════════════╛
First, we see that the IPC metric (11.2.0) tops our theoretical maximum of 5 instructions per cycle (discussed in the scheduler section). How can this be?
Recall that The AMD GCN Architecture - A Crash Course (slide 27) say “no functional unit” for the internal instructions. This removes the limitation on the IPC. If we are only issuing internal instructions, we are not issuing to any execution units! However, workloads such as these are almost entirely artificial (that is, repeatedly issuing internal instructions almost exclusively). In practice, a maximum of IPC of 5 is expected in almost all cases.
Secondly, note that our “Issued” IPC (11.2.1) is still identical to
the one here. Again, this has to do with the details of “internal”
instructions. Recall in our previous example we defined
this metric as explicitly excluding internal instruction counts. The
logical question then is, “what is this metric counting in our
s_nop kernel?”
The generated assembly looks something like:
;;#ASMSTART
s_nop 0x0
;;#ASMEND
;;#ASMSTART
s_nop 0x0
;;#ASMEND
;;<... omitting many more ...>
s_endpgm
.section        .rodata,#alloc
.p2align        6, 0x0
.amdhsa_kernel _Z4snopILi1000EEvv
Of particular interest here is the s_endpgm instruction, of which
the CDNA2 ISA
guide
states:
End of program; terminate wavefront.
This is not on our list of internal instructions from
The AMD GCN Architecture, and is therefore counted as part
of our Issued IPC (11.2.1). Thus, the issued IPC being equal to one here
indicates that we issued an s_endpgm instruction every cycle the
scheduler was active for non-internal instructions, which
is expected as this was our only non-internal instruction.
SALU Utilization#
Next, we explore a simple SALU kernel in our on-going IPC and utilization example. For this case, we select a simple scalar move operation, for instance:
s_mov_b32 s0, s1
which, in analogue to our v_mov example, copies the
contents of the source scalar register (s1) to the destination
scalar register (s0). Running this kernel through Omniperf yields:
$ omniperf analyze -p workloads/ipc/mi200/ --dispatch 10 -b 11.2
<...>
--------------------------------------------------------------------------------
0. Top Stat
╒════╤═══════════════════════════════╤═════════╤═════════════╤═════════════╤══════════════╤════════╕
│    │ KernelName                    │   Count │     Sum(ns) │    Mean(ns) │   Median(ns) │    Pct │
╞════╪═══════════════════════════════╪═════════╪═════════════╪═════════════╪══════════════╪════════╡
│  0 │ void smov<1000>() [clone .kd] │    1.00 │ 96246554.00 │ 96246554.00 │  96246554.00 │ 100.00 │
╘════╧═══════════════════════════════╧═════════╧═════════════╧═════════════╧══════════════╧════════╛


--------------------------------------------------------------------------------
11. Compute Units - Compute Pipeline
11.2 Pipeline Stats
╒═════════╤═════════════════════╤═══════╤═══════╤═══════╤══════════════╕
│ Index   │ Metric              │ Avg   │ Min   │ Max   │ Unit         │
╞═════════╪═════════════════════╪═══════╪═══════╪═══════╪══════════════╡
│ 11.2.0  │ IPC                 │ 1.0   │ 1.0   │ 1.0   │ Instr/cycle  │
├─────────┼─────────────────────┼───────┼───────┼───────┼──────────────┤
│ 11.2.1  │ IPC (Issued)        │ 1.0   │ 1.0   │ 1.0   │ Instr/cycle  │
├─────────┼─────────────────────┼───────┼───────┼───────┼──────────────┤
│ 11.2.2  │ SALU Util           │ 99.98 │ 99.98 │ 99.98 │ Pct          │
├─────────┼─────────────────────┼───────┼───────┼───────┼──────────────┤
│ 11.2.3  │ VALU Util           │ 0.0   │ 0.0   │ 0.0   │ Pct          │
├─────────┼─────────────────────┼───────┼───────┼───────┼──────────────┤
│ 11.2.4  │ VMEM Util           │ 0.0   │ 0.0   │ 0.0   │ Pct          │
├─────────┼─────────────────────┼───────┼───────┼───────┼──────────────┤
│ 11.2.5  │ Branch Util         │ 0.1   │ 0.1   │ 0.1   │ Pct          │
├─────────┼─────────────────────┼───────┼───────┼───────┼──────────────┤
│ 11.2.6  │ VALU Active Threads │       │       │       │ Threads      │
├─────────┼─────────────────────┼───────┼───────┼───────┼──────────────┤
│ 11.2.7  │ MFMA Util           │ 0.0   │ 0.0   │ 0.0   │ Pct          │
├─────────┼─────────────────────┼───────┼───────┼───────┼──────────────┤
│ 11.2.8  │ MFMA Instr Cycles   │       │       │       │ Cycles/instr │
╘═════════╧═════════════════════╧═══════╧═══════╧═══════╧══════════════╛
Here we see that:
Both our IPC (11.2.0) and Issued IPC (11.2.1) are \(\sim1.0\) as expected, and
The SALU Utilization (11.2.2) was nearly 100% as it was active for almost the entire kernel.
VALU Active Threads#
For our final IPC/Utilization example, we consider a slight modification of our v_mov example:
template<int N=1000>
__global__ void vmov_with_divergence() {
    if (threadIdx.x % 64 == 0)
        vmov_op<N>();
}
That is, we wrap our VALU operation inside a conditional where only one lane in our wavefront is active. Running this kernel through Omniperf yields:
$ omniperf analyze -p workloads/ipc/mi200/ --dispatch 11 -b 11.2
<...>
--------------------------------------------------------------------------------
0. Top Stat
╒════╤══════════════════════════════════════════╤═════════╤═════════════╤═════════════╤══════════════╤════════╕
│    │ KernelName                               │   Count │     Sum(ns) │    Mean(ns) │   Median(ns) │    Pct │
╞════╪══════════════════════════════════════════╪═════════╪═════════════╪═════════════╪══════════════╪════════╡
│  0 │ void vmov_with_divergence<1000>() [clone │    1.00 │ 97125097.00 │ 97125097.00 │  97125097.00 │ 100.00 │
│    │  .kd]                                    │         │             │             │              │        │
╘════╧══════════════════════════════════════════╧═════════╧═════════════╧═════════════╧══════════════╧════════╛


--------------------------------------------------------------------------------
11. Compute Units - Compute Pipeline
11.2 Pipeline Stats
╒═════════╤═════════════════════╤═══════╤═══════╤═══════╤══════════════╕
│ Index   │ Metric              │ Avg   │ Min   │ Max   │ Unit         │
╞═════════╪═════════════════════╪═══════╪═══════╪═══════╪══════════════╡
│ 11.2.0  │ IPC                 │ 1.0   │ 1.0   │ 1.0   │ Instr/cycle  │
├─────────┼─────────────────────┼───────┼───────┼───────┼──────────────┤
│ 11.2.1  │ IPC (Issued)        │ 1.0   │ 1.0   │ 1.0   │ Instr/cycle  │
├─────────┼─────────────────────┼───────┼───────┼───────┼──────────────┤
│ 11.2.2  │ SALU Util           │ 0.1   │ 0.1   │ 0.1   │ Pct          │
├─────────┼─────────────────────┼───────┼───────┼───────┼──────────────┤
│ 11.2.3  │ VALU Util           │ 99.98 │ 99.98 │ 99.98 │ Pct          │
├─────────┼─────────────────────┼───────┼───────┼───────┼──────────────┤
│ 11.2.4  │ VMEM Util           │ 0.0   │ 0.0   │ 0.0   │ Pct          │
├─────────┼─────────────────────┼───────┼───────┼───────┼──────────────┤
│ 11.2.5  │ Branch Util         │ 0.2   │ 0.2   │ 0.2   │ Pct          │
├─────────┼─────────────────────┼───────┼───────┼───────┼──────────────┤
│ 11.2.6  │ VALU Active Threads │ 1.13  │ 1.13  │ 1.13  │ Threads      │
├─────────┼─────────────────────┼───────┼───────┼───────┼──────────────┤
│ 11.2.7  │ MFMA Util           │ 0.0   │ 0.0   │ 0.0   │ Pct          │
├─────────┼─────────────────────┼───────┼───────┼───────┼──────────────┤
│ 11.2.8  │ MFMA Instr Cycles   │       │       │       │ Cycles/instr │
╘═════════╧═════════════════════╧═══════╧═══════╧═══════╧══════════════╛
Here we see that once again, our VALU Utilization (11.2.3) is nearly 100%. However, we note that the VALU Active Threads metric (11.2.6) is \(\sim 1\), which matches our conditional in the source code. So VALU Active Threads reports the average number of lanes of our wavefront that are active over all VALU instructions, or thread “convergence” (i.e., 1 - divergence).
Note
The act of evaluating a vector conditional in this example typically triggers VALU operations, contributing to why the VALU Active Threads metric is not identically one.
This metric is a time (cycle) averaged value, and thus contains an implicit dependence on the duration of various VALU instructions.
Nonetheless, this metric serves as a useful measure of thread-convergence.
Finally, we note that our branch utilization (11.2.5) has increased
slightly from our baseline, as we now have a branch (checking the value
of threadIdx.x).
LDS examples#
For this example, consider the LDS sample distributed as a part of Omniperf. This code contains two kernels to explore how both LDS bandwidth and bank conflicts are calculated in Omniperf.
This example was compiled and run on an MI250 accelerator using ROCm v5.6.0, and Omniperf v2.0.0.
$ hipcc -O3 lds.hip -o lds
Finally, we generate our omniperf profile as:
$ omniperf profile -n lds --no-roof -- ./lds
LDS bandwidth#
To explore our theoretical LDS bandwidth metric, we use a simple kernel:
constexpr unsigned max_threads = 256;
__global__ void load(int* out, int flag) {
  __shared__ int array[max_threads];
  int index = threadIdx.x;
  // fake a store to the LDS array to avoid unwanted behavior
  if (flag)
    array[max_threads - index] = index;
  __syncthreads();
  int x = array[index];
  if (x == int(-1234567))
    out[threadIdx.x] = x;
}
Here we:
Create an array of 256 integers in LDS
Fake a write to the LDS using the
flagvariable (always set to zero on the host) to avoid dead-code eliminationRead a single integer per work-item from
threadIdx.xof the LDS arrayIf the integer is equal to a magic number (always false), write the value out to global memory to again, avoid dead-code elimination
Finally, we launch this kernel repeatedly, varying the number of threads in our workgroup:
void bandwidth_demo(int N) {
  for (int i = 1; i <= N; ++i)
    load<<<1,i>>>(nullptr, 0);
  hipDeviceSynchronize();
}
Next, let’s analyze the first of our bandwidth kernel dispatches:
$ omniperf analyze -p workloads/lds/mi200/ -b 12.2.1 --dispatch 0 -n per_kernel
<...>
12. Local Data Share (LDS)
12.2 LDS Stats
╒═════════╤═══════════════════════╤════════╤════════╤════════╤══════════════════╕
│ Index   │ Metric                │    Avg │    Min │    Max │ Unit             │
╞═════════╪═══════════════════════╪════════╪════════╪════════╪══════════════════╡
│ 12.2.1  │ Theoretical Bandwidth │ 256.00 │ 256.00 │ 256.00 │ Bytes per kernel │
╘═════════╧═══════════════════════╧════════╧════════╧════════╧══════════════════╛
Here we see that our Theoretical Bandwidth metric (12.2.1) is reporting 256 Bytes were loaded even though we launched a single work-item workgroup, and thus only loaded a single integer from LDS. Why is this?
Recall our definition of this metric:
Indicates the maximum amount of bytes that could have been loaded from/stored to/atomically updated in the LDS per normalization unit.
Here we see that this instruction could have loaded up to 256 bytes of data (4 bytes for each work-item in the wavefront), and therefore this is the expected value for this metric in Omniperf, hence why this metric is named the “theoretical” bandwidth.
To further illustrate this point we plot the relationship of the theoretical bandwidth metric (12.2.1) as compared to the effective (or achieved) bandwidth of this kernel, varying the number of work-items launched from 1 to 256:
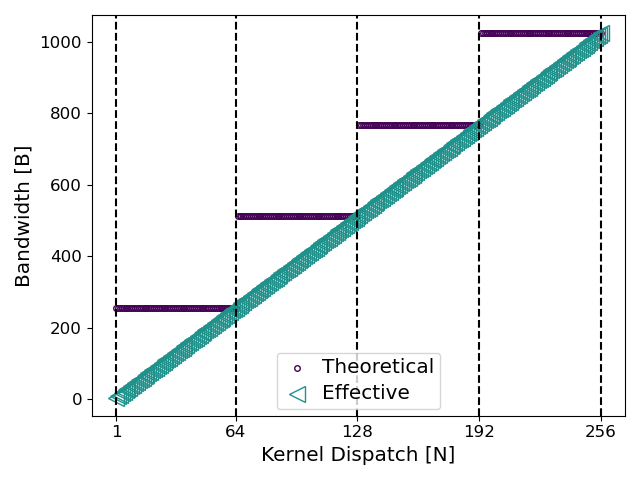
Fig. 52 Comparison of effective bandwidth versus the theoretical bandwidth metric in Omniperf for our simple example.#
Here we see that the theoretical bandwidth metric follows a step-function. It increases only when another wavefront issues an LDS instruction for up to 256 bytes of data. Such increases are marked in the plot using dashed lines. In contrast, the effective bandwidth increases linearly, by 4 bytes, with the number of work-items in the kernel, N.
Bank conflicts#
Next we explore bank conflicts using a slight modification of our bandwidth kernel:
constexpr unsigned nbanks = 32;
__global__ void conflicts(int* out, int flag) {
  constexpr unsigned nelements = nbanks * max_threads;
  __shared__ int array[nelements];
  // each thread reads from the same bank
  int index = threadIdx.x * nbanks;
  // fake a store to the LDS array to avoid unwanted behavior
  if (flag)
    array[max_threads - index] = index;
  __syncthreads();
  int x = array[index];
  if (x == int(-1234567))
    out[threadIdx.x] = x;
}
Here we:
Allocate an LDS array of size \(32*256*4{B}=32{KiB}\)
Fake a write to the LDS using the
flagvariable (always set to zero on the host) to avoid dead-code eliminationRead a single integer per work-item from index
threadIdx.x * nbanksof the LDS arrayIf the integer is equal to a magic number (always false), write the value out to global memory to, again, avoid dead-code elimination.
On the host, we again repeatedly launch this kernel, varying the number of work-items:
void conflicts_demo(int N) {
  for (int i = 1; i <= N; ++i)
    conflicts<<<1,i>>>(nullptr, 0);
  hipDeviceSynchronize();
}
Analyzing our first conflicts kernel (i.e., a single work-item), we
see:
$ omniperf analyze -p workloads/lds/mi200/ -b 12.2.4 12.2.6 --dispatch 256 -n per_kernel
<...>
--------------------------------------------------------------------------------
12. Local Data Share (LDS)
12.2 LDS Stats
╒═════════╤════════════════╤═══════╤═══════╤═══════╤═══════════════════╕
│ Index   │ Metric         │   Avg │   Min │   Max │ Unit              │
╞═════════╪════════════════╪═══════╪═══════╪═══════╪═══════════════════╡
│ 12.2.4  │ Index Accesses │  2.00 │  2.00 │  2.00 │ Cycles per kernel │
├─────────┼────────────────┼───────┼───────┼───────┼───────────────────┤
│ 12.2.6  │ Bank Conflict  │  0.00 │  0.00 │  0.00 │ Cycles per kernel │
╘═════════╧════════════════╧═══════╧═══════╧═══════╧═══════════════════╛
In our previous example, we showed how a load from a single work-item is considered to have a theoretical bandwidth of 256B. Recall, the LDS can load up to \(128B\) per cycle (i.e, 32 banks x 4B / bank / cycle). Hence, we see that loading an 4B integer spends two cycles accessing the LDS (\(2\ {cycle} = (256B) / (128\ B/{cycle})\)).
Looking at the next conflicts dispatch (i.e., two work-items) yields:
$ omniperf analyze -p workloads/lds/mi200/ -b 12.2.4 12.2.6 --dispatch 257 -n per_kernel
<...>
--------------------------------------------------------------------------------
12. Local Data Share (LDS)
12.2 LDS Stats
╒═════════╤════════════════╤═══════╤═══════╤═══════╤═══════════════════╕
│ Index   │ Metric         │   Avg │   Min │   Max │ Unit              │
╞═════════╪════════════════╪═══════╪═══════╪═══════╪═══════════════════╡
│ 12.2.4  │ Index Accesses │  3.00 │  3.00 │  3.00 │ Cycles per kernel │
├─────────┼────────────────┼───────┼───────┼───────┼───────────────────┤
│ 12.2.6  │ Bank Conflict  │  1.00 │  1.00 │  1.00 │ Cycles per kernel │
╘═════════╧════════════════╧═══════╧═══════╧═══════╧═══════════════════╛
Here we see a bank conflict! What happened?
Recall that the index for each thread was calculated as:
int index = threadIdx.x * nbanks;
Or, precisely 32 elements, and each element is 4B wide (for a standard integer). That is, each thread strides back to the same bank in the LDS, such that each work-item we add to the dispatch results in another bank conflict!
Recalling our discussion of bank conflicts in our LDS description:
A bank conflict occurs when two (or more) work-items in a wavefront want to read, write, or atomically update different addresses that map to the same bank in the same cycle. In this case, the conflict detection hardware will determined a new schedule such that the access is split into multiple cycles with no conflicts in any single cycle.
Here we see the conflict resolution hardware in action! Because we have engineered our kernel to generate conflicts, we expect our bank conflict metric to scale linearly with the number of work-items:
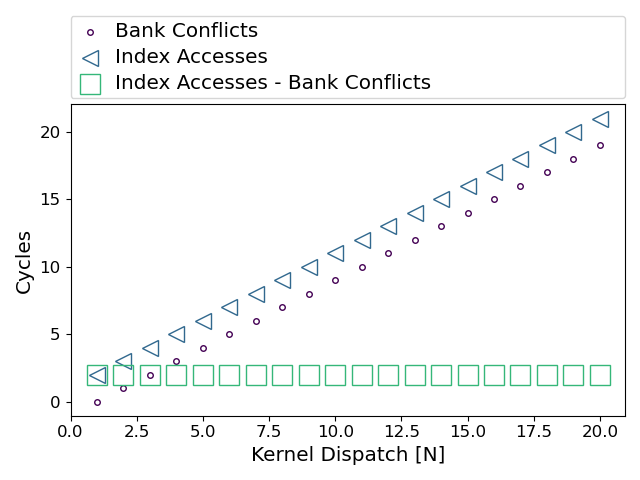
Fig. 53 Comparison of LDS conflict cycles versus access cycles for our simple example.#
Here we show the comparison of the Index Accesses (12.2.4), to the Bank Conflicts (12.2.6) for the first 20 kernel invocations. We see that each grows linearly, and there is a constant gap of 2 cycles between them (i.e., the first access is never considered a conflict).
Finally, we can use these two metrics to derive the Bank Conflict Rate (12.1.4). Since within an Index Access we have 32 banks that may need to be updated, we use:
$$ BankConflictRate = 100 * ((BankConflicts / 32) / (IndexAccesses - BankConflicts)) $$
Plotting this, we see:
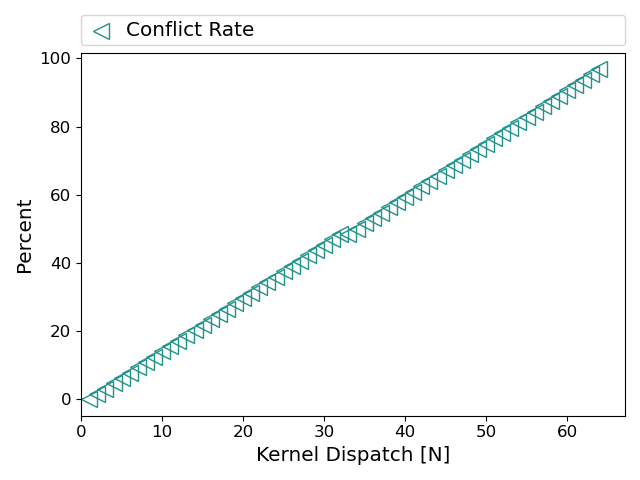
Fig. 54 LDS Bank Conflict rate for our simple example.#
The bank conflict rate linearly increases with the number of work-items within a wavefront that are active, approaching 100%, but never quite reaching it.
Occupancy limiters example#
For this example, consider the occupancy included with Omniperf. We will investigate the use of the resource allocation panel in the Workgroup Manager’s metrics section to determine occupancy limiters. This code contains several kernels to explore how both various kernel resources impact achieved occupancy, and how this is reported in Omniperf.
This example was compiled and run on a MI250 accelerator using ROCm v5.6.0, and Omniperf v2.0.0:
$ hipcc -O3 occupancy.hip -o occupancy --save-temps
We have again included the --save-temps flag to get the
corresponding assembly.
Finally, we generate our Omniperf profile as:
$ omniperf profile -n occupancy --no-roof -- ./occupancy
Design note#
For our occupancy test, we need to create a kernel that is resource heavy, in various ways. For this purpose, we use the following (somewhat funny-looking) kernel:
constexpr int bound = 16;
__launch_bounds__(256)
__global__ void vgprbound(int N, double* ptr) {
    double intermediates[bound];
    for (int i = 0 ; i < bound; ++i) intermediates[i] = N * threadIdx.x;
    double x = ptr[threadIdx.x];
    for (int i = 0; i < 100; ++i) {
        x += sin(pow(__shfl(x, i % warpSize) * intermediates[(i - 1) % bound], intermediates[i % bound]));
        intermediates[i % bound] = x;
    }
    if (x == N) ptr[threadIdx.x] = x;
}
Here we try to use as many VGPRs as possible, to this end:
We create a small array of double precision floats, that we size to try to fit into registers (i.e.,
bound, this may need to be tuned depending on the ROCm version).We specify
__launch_bounds___(256)to increase the number of VPGRs available to the kernel (by limiting the number of wavefronts that can be resident on a CU).Write a unique non-compile time constant to each element of the array.
Repeatedly permute and call relatively expensive math functions on our array elements.
Keep the compiler from optimizing out any operations by faking a write to the
ptrbased on a run-time conditional.
This yields a total of 122 VGPRs, but it is expected this number will depend on the exact ROCm/compiler version.
        .size   _Z9vgprboundiPd, .Lfunc_end1-_Z9vgprboundiPd
                                        ; -- End function
        .section        .AMDGPU.csdata
; Kernel info:
; codeLenInByte = 4732
; NumSgprs: 68
; NumVgprs: 122
; NumAgprs: 0
; <...>
; AccumOffset: 124
We will use various permutations of this kernel to limit occupancy, and more importantly for the purposes of this example, demonstrate how this is reported in Omniperf.
VGPR limited#
For our first test, we use the vgprbound kernel discussed in the
design note. After profiling, we run
the analyze step on this kernel:
$ omniperf analyze -p workloads/occupancy/mi200/ -b 2.1.15 6.2 7.1.5 7.1.6 7.1.7 --dispatch 1
<...>
--------------------------------------------------------------------------------
0. Top Stat
╒════╤═════════════════════════╤═════════╤══════════════╤══════════════╤══════════════╤════════╕
│    │ KernelName              │   Count │      Sum(ns) │     Mean(ns) │   Median(ns) │    Pct │
╞════╪═════════════════════════╪═════════╪══════════════╪══════════════╪══════════════╪════════╡
│  0 │ vgprbound(int, double*) │    1.00 │ 923093822.50 │ 923093822.50 │ 923093822.50 │ 100.00 │
╘════╧═════════════════════════╧═════════╧══════════════╧══════════════╧══════════════╧════════╛


--------------------------------------------------------------------------------
2. System Speed-of-Light
2.1 Speed-of-Light
╒═════════╤═════════════════════╤═════════╤════════════╤═════════╤═══════════════╕
│ Index   │ Metric              │     Avg │ Unit       │    Peak │   Pct of Peak │
╞═════════╪═════════════════════╪═════════╪════════════╪═════════╪═══════════════╡
│ 2.1.15  │ Wavefront Occupancy │ 1661.24 │ Wavefronts │ 3328.00 │         49.92 │
╘═════════╧═════════════════════╧═════════╧════════════╧═════════╧═══════════════╛


--------------------------------------------------------------------------------
6. Workgroup Manager (SPI)
6.2 Workgroup Manager - Resource Allocation
╒═════════╤════════════════════════════════════════╤═══════╤═══════╤═══════╤════════╕
│ Index   │ Metric                                 │   Avg │   Min │   Max │ Unit   │
╞═════════╪════════════════════════════════════════╪═══════╪═══════╪═══════╪════════╡
│ 6.2.0   │ Not-scheduled Rate (Workgroup Manager) │  0.64 │  0.64 │  0.64 │ Pct    │
├─────────┼────────────────────────────────────────┼───────┼───────┼───────┼────────┤
│ 6.2.1   │ Not-scheduled Rate (Scheduler-Pipe)    │ 24.94 │ 24.94 │ 24.94 │ Pct    │
├─────────┼────────────────────────────────────────┼───────┼───────┼───────┼────────┤
│ 6.2.2   │ Scheduler-Pipe Stall Rate              │ 24.49 │ 24.49 │ 24.49 │ Pct    │
├─────────┼────────────────────────────────────────┼───────┼───────┼───────┼────────┤
│ 6.2.3   │ Scratch Stall Rate                     │  0.00 │  0.00 │  0.00 │ Pct    │
├─────────┼────────────────────────────────────────┼───────┼───────┼───────┼────────┤
│ 6.2.4   │ Insufficient SIMD Waveslots            │  0.00 │  0.00 │  0.00 │ Pct    │
├─────────┼────────────────────────────────────────┼───────┼───────┼───────┼────────┤
│ 6.2.5   │ Insufficient SIMD VGPRs                │ 94.90 │ 94.90 │ 94.90 │ Pct    │
├─────────┼────────────────────────────────────────┼───────┼───────┼───────┼────────┤
│ 6.2.6   │ Insufficient SIMD SGPRs                │  0.00 │  0.00 │  0.00 │ Pct    │
├─────────┼────────────────────────────────────────┼───────┼───────┼───────┼────────┤
│ 6.2.7   │ Insufficient CU LDS                    │  0.00 │  0.00 │  0.00 │ Pct    │
├─────────┼────────────────────────────────────────┼───────┼───────┼───────┼────────┤
│ 6.2.8   │ Insufficient CU Barriers               │  0.00 │  0.00 │  0.00 │ Pct    │
├─────────┼────────────────────────────────────────┼───────┼───────┼───────┼────────┤
│ 6.2.9   │ Reached CU Workgroup Limit             │  0.00 │  0.00 │  0.00 │ Pct    │
├─────────┼────────────────────────────────────────┼───────┼───────┼───────┼────────┤
│ 6.2.10  │ Reached CU Wavefront Limit             │  0.00 │  0.00 │  0.00 │ Pct    │
╘═════════╧════════════════════════════════════════╧═══════╧═══════╧═══════╧════════╛


--------------------------------------------------------------------------------
7. Wavefront
7.1 Wavefront Launch Stats
╒═════════╤══════════╤════════╤════════╤════════╤═══════════╕
│ Index   │ Metric   │    Avg │    Min │    Max │ Unit      │
╞═════════╪══════════╪════════╪════════╪════════╪═══════════╡
│ 7.1.5   │ VGPRs    │ 124.00 │ 124.00 │ 124.00 │ Registers │
├─────────┼──────────┼────────┼────────┼────────┼───────────┤
│ 7.1.6   │ AGPRs    │   4.00 │   4.00 │   4.00 │ Registers │
├─────────┼──────────┼────────┼────────┼────────┼───────────┤
│ 7.1.7   │ SGPRs    │  80.00 │  80.00 │  80.00 │ Registers │
╘═════════╧══════════╧════════╧════════╧════════╧═══════════╛
Here we see that the kernel indeed does use around (but not exactly)
122 VGPRs, with the difference due to granularity of VGPR allocations.
In addition, we see that we have allocated 4 “AGPRs”. We
note that on current CDNA2 accelerators, the AccumOffset field of
the assembly metadata:
; AccumOffset: 124
denotes the divide between VGPRs and AGPRs.
Next, we examine our wavefront occupancy (2.1.15), and see that we are reaching only \(\sim50\%\) of peak occupancy. As a result, we see that:
We are not scheduling workgroups \(\sim25\%\) of total scheduler-pipe cycles (6.2.1); recall from the discussion of the workgroup manager <desc-spi>, 25% is the maximum.
The scheduler-pipe is stalled (6.2.2) from scheduling workgroups due to resource constraints for the same \(\sim25\%\) of the time.
And finally, \(\sim91\%\) of those stalls are due to a lack of SIMDs with the appropriate number of VGPRs available (6.2.5).
That is, the reason we can’t reach full occupancy is due to our VGPR usage, as expected!
LDS limited#
To examine an LDS limited example, we must change our kernel slightly:
constexpr size_t fully_allocate_lds = 64ul * 1024ul / sizeof(double);
__launch_bounds__(256)
__global__ void ldsbound(int N, double* ptr) {
    __shared__ double intermediates[fully_allocate_lds];
    for (int i = threadIdx.x ; i < fully_allocate_lds; i += blockDim.x) intermediates[i] = N * threadIdx.x;
    __syncthreads();
    double x = ptr[threadIdx.x];
    for (int i = threadIdx.x; i < fully_allocate_lds; i += blockDim.x) {
        x += sin(pow(__shfl(x, i % warpSize) * intermediates[(i - 1) % fully_allocate_lds], intermediates[i % fully_allocate_lds]));
        __syncthreads();
        intermediates[i % fully_allocate_lds] = x;
    }
    if (x == N) ptr[threadIdx.x] = x;
}
Where we now:
Allocate an 64 KiB LDS array per workgroup, and
Use our allocated LDS array instead of a register array
Analyzing this:
$ omniperf analyze -p workloads/occupancy/mi200/ -b 2.1.15 6.2 7.1.5 7.1.6 7.1.7 7.1.8 --dispatch 3
<...>
--------------------------------------------------------------------------------
2. System Speed-of-Light
2.1 Speed-of-Light
╒═════════╤═════════════════════╤════════╤════════════╤═════════╤═══════════════╕
│ Index   │ Metric              │    Avg │ Unit       │    Peak │   Pct of Peak │
╞═════════╪═════════════════════╪════════╪════════════╪═════════╪═══════════════╡
│ 2.1.15  │ Wavefront Occupancy │ 415.52 │ Wavefronts │ 3328.00 │         12.49 │
╘═════════╧═════════════════════╧════════╧════════════╧═════════╧═══════════════╛


--------------------------------------------------------------------------------
6. Workgroup Manager (SPI)
6.2 Workgroup Manager - Resource Allocation
╒═════════╤════════════════════════════════════════╤═══════╤═══════╤═══════╤════════╕
│ Index   │ Metric                                 │   Avg │   Min │   Max │ Unit   │
╞═════════╪════════════════════════════════════════╪═══════╪═══════╪═══════╪════════╡
│ 6.2.0   │ Not-scheduled Rate (Workgroup Manager) │  0.13 │  0.13 │  0.13 │ Pct    │
├─────────┼────────────────────────────────────────┼───────┼───────┼───────┼────────┤
│ 6.2.1   │ Not-scheduled Rate (Scheduler-Pipe)    │ 24.87 │ 24.87 │ 24.87 │ Pct    │
├─────────┼────────────────────────────────────────┼───────┼───────┼───────┼────────┤
│ 6.2.2   │ Scheduler-Pipe Stall Rate              │ 24.84 │ 24.84 │ 24.84 │ Pct    │
├─────────┼────────────────────────────────────────┼───────┼───────┼───────┼────────┤
│ 6.2.3   │ Scratch Stall Rate                     │  0.00 │  0.00 │  0.00 │ Pct    │
├─────────┼────────────────────────────────────────┼───────┼───────┼───────┼────────┤
│ 6.2.4   │ Insufficient SIMD Waveslots            │  0.00 │  0.00 │  0.00 │ Pct    │
├─────────┼────────────────────────────────────────┼───────┼───────┼───────┼────────┤
│ 6.2.5   │ Insufficient SIMD VGPRs                │  0.00 │  0.00 │  0.00 │ Pct    │
├─────────┼────────────────────────────────────────┼───────┼───────┼───────┼────────┤
│ 6.2.6   │ Insufficient SIMD SGPRs                │  0.00 │  0.00 │  0.00 │ Pct    │
├─────────┼────────────────────────────────────────┼───────┼───────┼───────┼────────┤
│ 6.2.7   │ Insufficient CU LDS                    │ 96.47 │ 96.47 │ 96.47 │ Pct    │
├─────────┼────────────────────────────────────────┼───────┼───────┼───────┼────────┤
│ 6.2.8   │ Insufficient CU Barriers               │  0.00 │  0.00 │  0.00 │ Pct    │
├─────────┼────────────────────────────────────────┼───────┼───────┼───────┼────────┤
│ 6.2.9   │ Reached CU Workgroup Limit             │  0.00 │  0.00 │  0.00 │ Pct    │
├─────────┼────────────────────────────────────────┼───────┼───────┼───────┼────────┤
│ 6.2.10  │ Reached CU Wavefront Limit             │  0.00 │  0.00 │  0.00 │ Pct    │
╘═════════╧════════════════════════════════════════╧═══════╧═══════╧═══════╧════════╛


--------------------------------------------------------------------------------
7. Wavefront
7.1 Wavefront Launch Stats
╒═════════╤════════════════╤══════════╤══════════╤══════════╤═══════════╕
│ Index   │ Metric         │      Avg │      Min │      Max │ Unit      │
╞═════════╪════════════════╪══════════╪══════════╪══════════╪═══════════╡
│ 7.1.5   │ VGPRs          │    96.00 │    96.00 │    96.00 │ Registers │
├─────────┼────────────────┼──────────┼──────────┼──────────┼───────────┤
│ 7.1.6   │ AGPRs          │     0.00 │     0.00 │     0.00 │ Registers │
├─────────┼────────────────┼──────────┼──────────┼──────────┼───────────┤
│ 7.1.7   │ SGPRs          │    80.00 │    80.00 │    80.00 │ Registers │
├─────────┼────────────────┼──────────┼──────────┼──────────┼───────────┤
│ 7.1.8   │ LDS Allocation │ 65536.00 │ 65536.00 │ 65536.00 │ Bytes     │
╘═════════╧════════════════╧══════════╧══════════╧══════════╧═══════════╛
We see that our VGPR allocation has gone down to 96 registers, but now we see our 64KiB LDS allocation (7.1.8). In addition, we see a similar non-schedule rate (6.2.1) and stall rate (6.2.2) as in our VGPR example. However, our occupancy limiter has now shifted from VGPRs (6.2.5) to LDS (6.2.7).
We note that although we see the around the same scheduler/stall rates (with our LDS limiter), our wave occupancy (2.1.15) is significantly lower (\(\sim12\%\))! This is important to remember: the occupancy limiter metrics in the resource allocation section tell you what the limiter was, but not how much the occupancy was limited. These metrics should always be analyzed in concert with the wavefront occupancy metric!
SGPR limited#
Finally, we modify our kernel once more to make it limited by SGPRs:
constexpr int sgprlim = 1;
__launch_bounds__(1024, 8)
__global__ void sgprbound(int N, double* ptr) {
    double intermediates[sgprlim];
    for (int i = 0 ; i < sgprlim; ++i) intermediates[i] = i;
    double x = ptr[0];
    #pragma unroll 1
    for (int i = 0; i < 100; ++i) {
        x += sin(pow(intermediates[(i - 1) % sgprlim], intermediates[i % sgprlim]));
        intermediates[i % sgprlim] = x;
    }
    if (x == N) ptr[0] = x;
}
The major changes here are to: - make as much as possible provably
uniform across the wave (notice the lack of threadIdx.x in the
intermediates initialization and elsewhere), - addition of
__launch_bounds__(1024, 8), which reduces our maximum VGPRs to 64
(such that 8 waves can fit per SIMD), but causes some register spills
(i.e., scratch usage), and - lower the bound (here we
use sgprlim) of the array to reduce VGPR/Scratch usage.
This results in the following assembly metadata for this kernel:
        .size   _Z9sgprboundiPd, .Lfunc_end3-_Z9sgprboundiPd
                                        ; -- End function
        .section        .AMDGPU.csdata
; Kernel info:
; codeLenInByte = 4872
; NumSgprs: 76
; NumVgprs: 64
; NumAgprs: 0
; TotalNumVgprs: 64
; ScratchSize: 60
; <...>
; AccumOffset: 64
; Occupancy: 8
Analyzing this workload yields:
$ omniperf analyze -p workloads/occupancy/mi200/ -b 2.1.15 6.2 7.1.5 7.1.6 7.1.7 7.1.8 7.1.9 --dispatch 5
<...>
--------------------------------------------------------------------------------
0. Top Stat
╒════╤═════════════════════════╤═════════╤══════════════╤══════════════╤══════════════╤════════╕
│    │ KernelName              │   Count │      Sum(ns) │     Mean(ns) │   Median(ns) │    Pct │
╞════╪═════════════════════════╪═════════╪══════════════╪══════════════╪══════════════╪════════╡
│  0 │ sgprbound(int, double*) │    1.00 │ 782069812.00 │ 782069812.00 │ 782069812.00 │ 100.00 │
╘════╧═════════════════════════╧═════════╧══════════════╧══════════════╧══════════════╧════════╛


--------------------------------------------------------------------------------
2. System Speed-of-Light
2.1 Speed-of-Light
╒═════════╤═════════════════════╤═════════╤════════════╤═════════╤═══════════════╕
│ Index   │ Metric              │     Avg │ Unit       │    Peak │   Pct of Peak │
╞═════════╪═════════════════════╪═════════╪════════════╪═════════╪═══════════════╡
│ 2.1.15  │ Wavefront Occupancy │ 3291.76 │ Wavefronts │ 3328.00 │         98.91 │
╘═════════╧═════════════════════╧═════════╧════════════╧═════════╧═══════════════╛


--------------------------------------------------------------------------------
6. Workgroup Manager (SPI)
6.2 Workgroup Manager - Resource Allocation
╒═════════╤════════════════════════════════════════╤═══════╤═══════╤═══════╤════════╕
│ Index   │ Metric                                 │   Avg │   Min │   Max │ Unit   │
╞═════════╪════════════════════════════════════════╪═══════╪═══════╪═══════╪════════╡
│ 6.2.0   │ Not-scheduled Rate (Workgroup Manager) │  7.72 │  7.72 │  7.72 │ Pct    │
├─────────┼────────────────────────────────────────┼───────┼───────┼───────┼────────┤
│ 6.2.1   │ Not-scheduled Rate (Scheduler-Pipe)    │ 15.17 │ 15.17 │ 15.17 │ Pct    │
├─────────┼────────────────────────────────────────┼───────┼───────┼───────┼────────┤
│ 6.2.2   │ Scheduler-Pipe Stall Rate              │  7.38 │  7.38 │  7.38 │ Pct    │
├─────────┼────────────────────────────────────────┼───────┼───────┼───────┼────────┤
│ 6.2.3   │ Scratch Stall Rate                     │ 39.76 │ 39.76 │ 39.76 │ Pct    │
├─────────┼────────────────────────────────────────┼───────┼───────┼───────┼────────┤
│ 6.2.4   │ Insufficient SIMD Waveslots            │ 26.32 │ 26.32 │ 26.32 │ Pct    │
├─────────┼────────────────────────────────────────┼───────┼───────┼───────┼────────┤
│ 6.2.5   │ Insufficient SIMD VGPRs                │ 26.32 │ 26.32 │ 26.32 │ Pct    │
├─────────┼────────────────────────────────────────┼───────┼───────┼───────┼────────┤
│ 6.2.6   │ Insufficient SIMD SGPRs                │ 25.52 │ 25.52 │ 25.52 │ Pct    │
├─────────┼────────────────────────────────────────┼───────┼───────┼───────┼────────┤
│ 6.2.7   │ Insufficient CU LDS                    │  0.00 │  0.00 │  0.00 │ Pct    │
├─────────┼────────────────────────────────────────┼───────┼───────┼───────┼────────┤
│ 6.2.8   │ Insufficient CU Barriers               │  0.00 │  0.00 │  0.00 │ Pct    │
├─────────┼────────────────────────────────────────┼───────┼───────┼───────┼────────┤
│ 6.2.9   │ Reached CU Workgroup Limit             │  0.00 │  0.00 │  0.00 │ Pct    │
├─────────┼────────────────────────────────────────┼───────┼───────┼───────┼────────┤
│ 6.2.10  │ Reached CU Wavefront Limit             │  0.00 │  0.00 │  0.00 │ Pct    │
╘═════════╧════════════════════════════════════════╧═══════╧═══════╧═══════╧════════╛


--------------------------------------------------------------------------------
7. Wavefront
7.1 Wavefront Launch Stats
╒═════════╤════════════════════╤═══════╤═══════╤═══════╤════════════════╕
│ Index   │ Metric             │   Avg │   Min │   Max │ Unit           │
╞═════════╪════════════════════╪═══════╪═══════╪═══════╪════════════════╡
│ 7.1.5   │ VGPRs              │ 64.00 │ 64.00 │ 64.00 │ Registers      │
├─────────┼────────────────────┼───────┼───────┼───────┼────────────────┤
│ 7.1.6   │ AGPRs              │  0.00 │  0.00 │  0.00 │ Registers      │
├─────────┼────────────────────┼───────┼───────┼───────┼────────────────┤
│ 7.1.7   │ SGPRs              │ 80.00 │ 80.00 │ 80.00 │ Registers      │
├─────────┼────────────────────┼───────┼───────┼───────┼────────────────┤
│ 7.1.8   │ LDS Allocation     │  0.00 │  0.00 │  0.00 │ Bytes          │
├─────────┼────────────────────┼───────┼───────┼───────┼────────────────┤
│ 7.1.9   │ Scratch Allocation │ 60.00 │ 60.00 │ 60.00 │ Bytes/workitem │
╘═════════╧════════════════════╧═══════╧═══════╧═══════╧════════════════╛
Here we see that our wavefront launch stats (7.1) have changed to
reflect the metadata seen in the --save-temps output. Of particular
interest, we see:
The SGPR allocation (7.1.7) is 80 registers, slightly more than the 76 requested by the compiler due to allocation granularity, and
We have a “scratch”, that is, private memory, allocation of 60 bytes per work-item.
Analyzing the resource allocation block (6.2) we now see that for the first time, the “Not-scheduled Rate (Workgroup Manager)” metric (6.2.0) has become non-zero. This is because the workgroup manager is responsible for management of scratch, which we see also contributes to our occupancy limiters in the “Scratch Stall Rate” (6.2.3). Note that the sum of the workgroup manager not-scheduled rate and the scheduler-pipe non-scheduled rate is still \(\sim25\%\), as in our previous examples.
Next, we see that the scheduler-pipe stall rate (6.2.2), that is, how often we could not schedule a workgroup to a CU, was only about \(\sim8\%\). This hints that perhaps, our kernel is not particularly occupancy limited by resources. Indeed, checking the wave occupancy metric (2.1.15) shows that this kernel is reaching nearly 99% occupancy.
Finally, we inspect the occupancy limiter metrics and see a roughly even split between waveslots (6.2.4), VGPRs (6.2.5), and SGPRs (6.2.6) along with the scratch stalls (6.2.3) previously mentioned.
This is yet another reminder to view occupancy holistically. While these metrics tell you why a workgroup cannot be scheduled, they do not tell you what your occupancy was (consult wavefront occupancy) nor whether increasing occupancy will be beneficial to performance.