Standalone GUI analysis#
Omniperf’s standalone analysis GUI is a lightweight web page that you can generate straight from the command line. The standalone analysis GUI is an alternative to the CLI if you want to explore profiling results visually, but without the additional setup requirements or server-side overhead of Omniperf’s detailed Grafana interface option. This analysis option is implemented as a simple Flask application that lets you view results from your preferred web browser.
Note
A point on port forwarding: the standalone GUI analyzer publishes its
web-based interface on port 8050 by default. On production HPC systems
where profiling jobs run under the control of a resource manager, additional
SSH tunneling between the desired web browser host (such as a login node or
remote workstation) and compute host may be required. Alternatively, you
might find it more convenient to download profiled workloads to perform
analysis on a local system.
See the FAQ for more details on SSH tunneling.
Launch the standalone GUI analyzer#
To launch the Omniperf GUI analyzer, include the --gui flag with your
desired analysis command. For example:
$ omniperf analyze -p workloads/vcopy/MI200/ --gui

  ___                  _                  __
 / _ \ _ __ ___  _ __ (_)_ __   ___ _ __ / _|
| | | | '_ ` _ \| '_ \| | '_ \ / _ \ '__| |_
| |_| | | | | | | | | | | |_) |  __/ |  |  _|
 \___/|_| |_| |_|_| |_|_| .__/ \___|_|  |_|
                        |_|

Analysis mode = web_ui
[analysis] deriving Omniperf metrics...
Dash is running on http://0.0.0.0:8050/

 * Serving Flask app 'omniperf_analyze.analysis_webui' (lazy loading)
 * Environment: production
   WARNING: This is a development server. Do not use it in a production deployment.
   Use a production WSGI server instead.
 * Debug mode: off
 * Running on all addresses (0.0.0.0)
   WARNING: This is a development server. Do not use it in a production deployment.
 * Running on http://127.0.0.1:8050
 * Running on http://10.228.33.172:8050 (Press CTRL+C to quit)
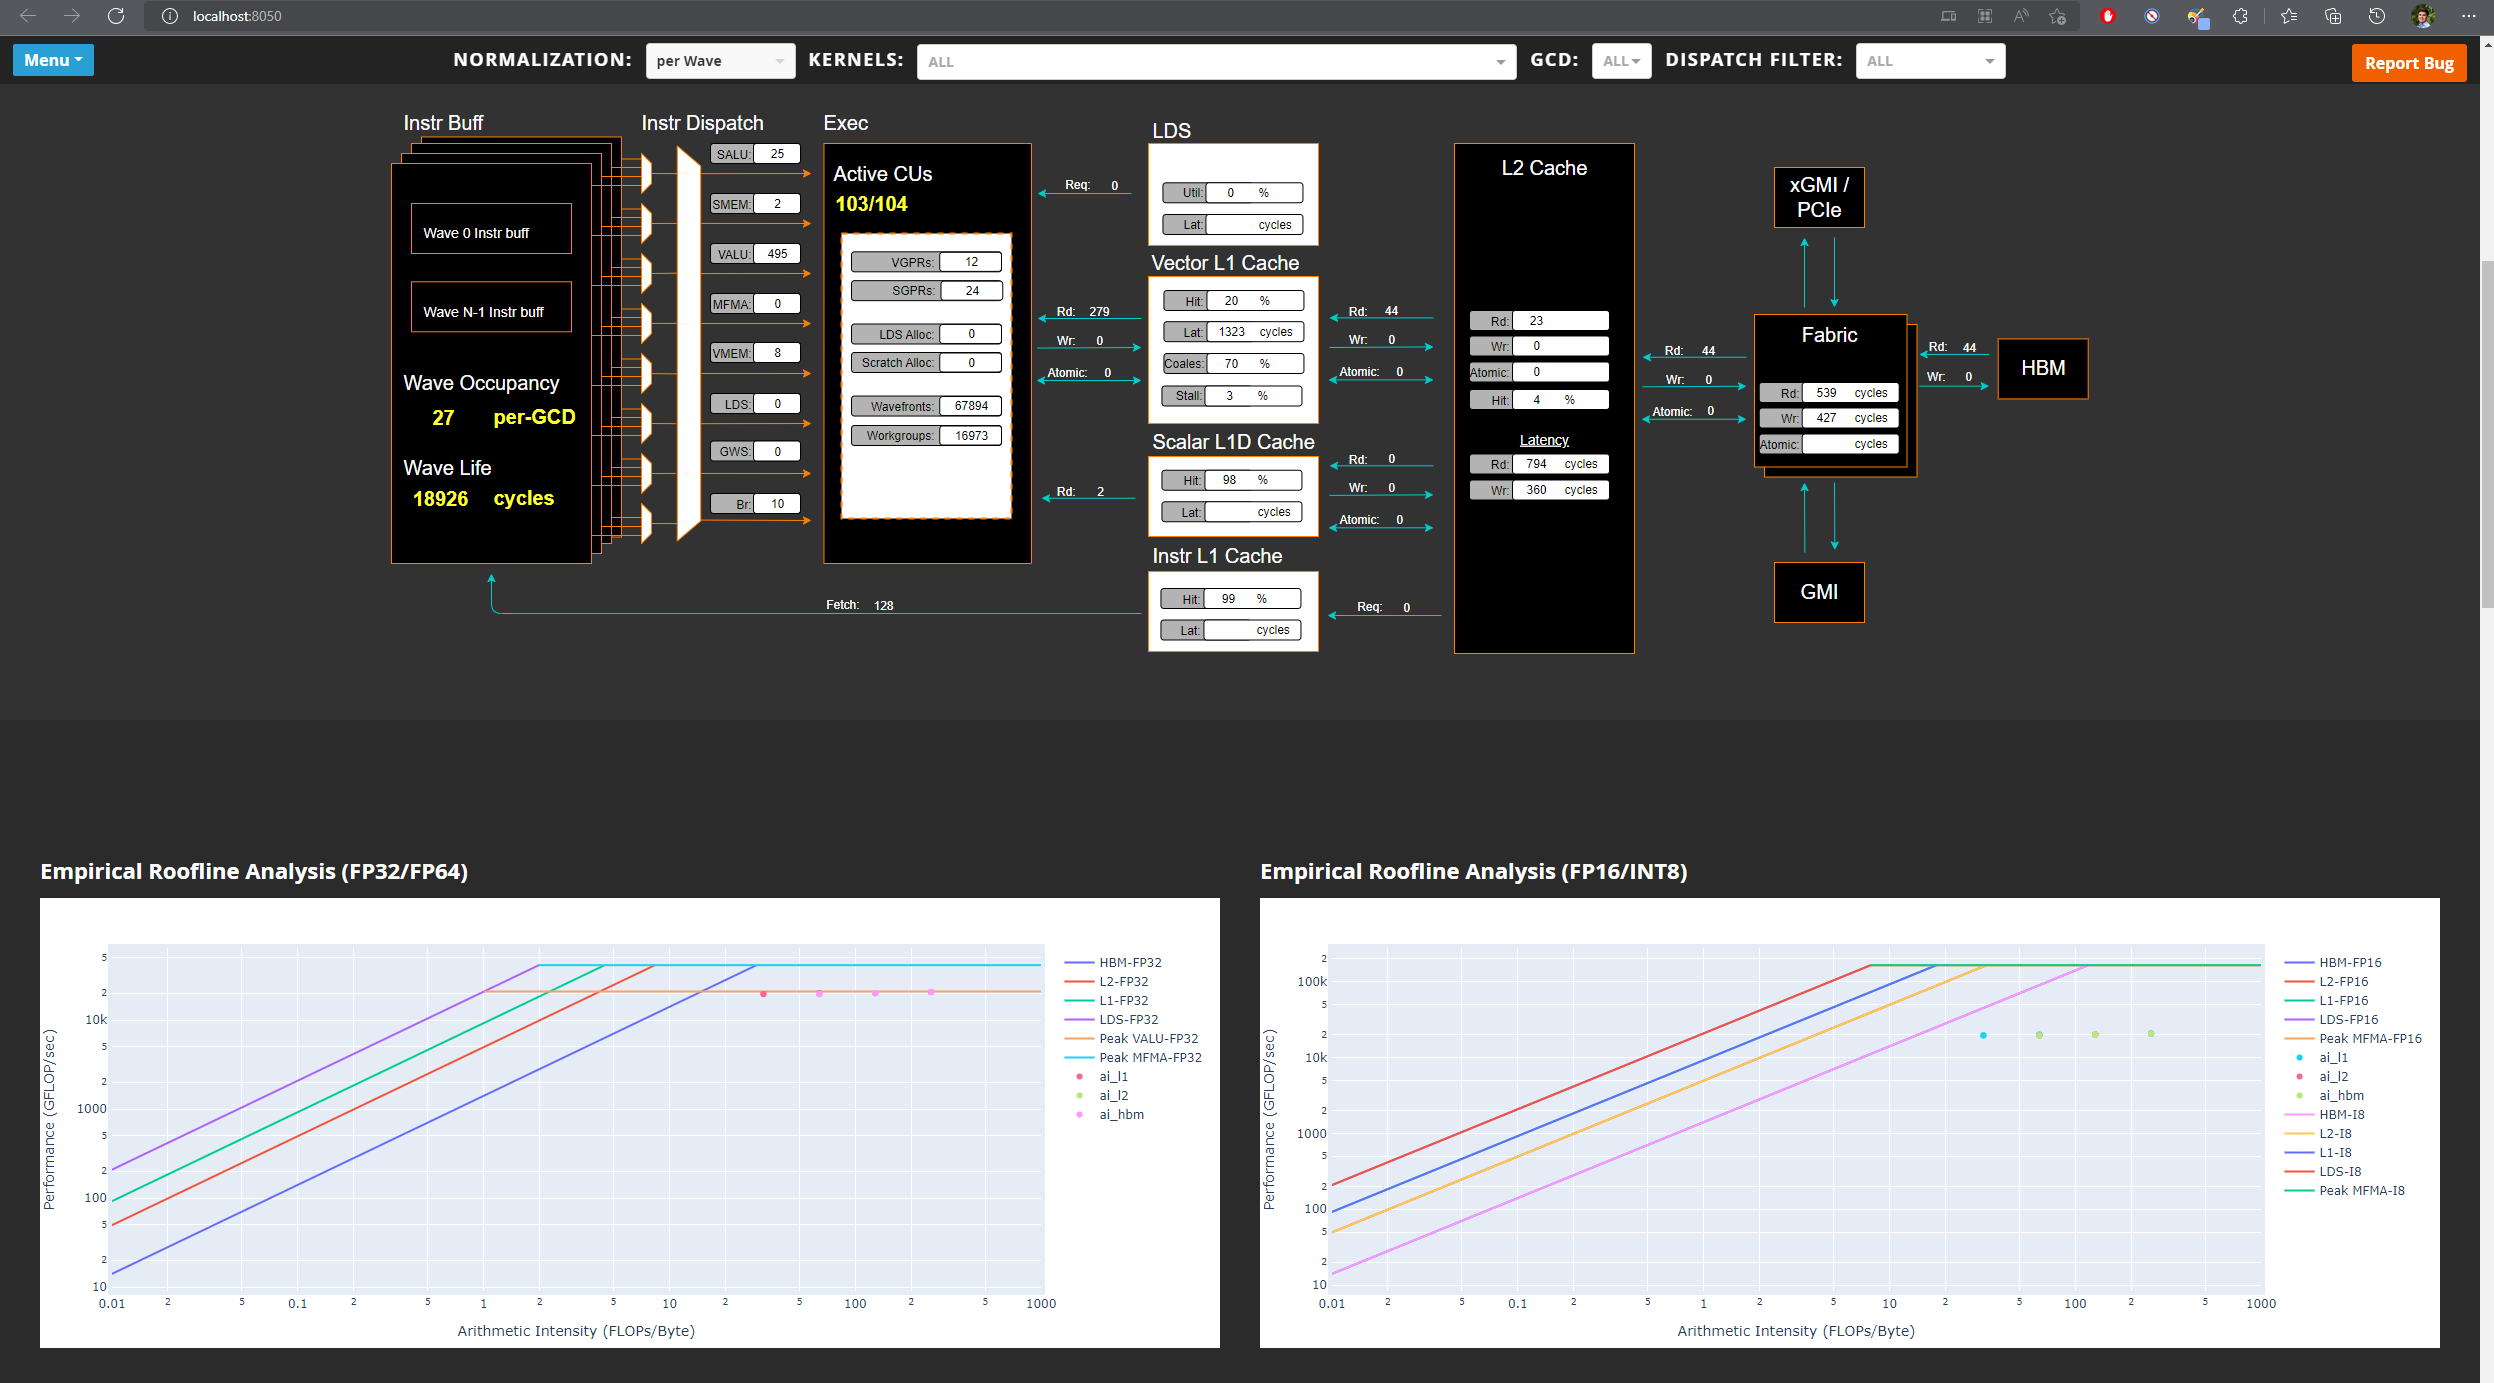
At this point, you can launch your web browser of choice and navigate to
http://localhost:8050/ to view the analysis interface.
Tip
To launch the standalone GUI analyzer web app on a port other than 8050,
include the optional argument --gui <desired port>.
When no filters are applied, you’ll see five basic sections derived from your application’s profiling data:
Memory Chart Analysis
Empirical Roofline Analysis
Top Stats (Top Kernel Statistics)
System Info
System Speed-of-Light
To dive deeper, use the dropdown menus at the top of the screen to isolate particular kernels or dispatches. You should see the web page update with metrics specific to your selected filters.
Once a filter is applied, you’ll see several additional sections become available with detailed metrics specific to that area of AMD hardware. These detailed sections mirror the data displayed in Omniperf’s Grafana interface.