Shader engine (SE)#
The compute units on a CDNA™ accelerator are grouped together into a higher-level organizational unit called a shader engine (SE):
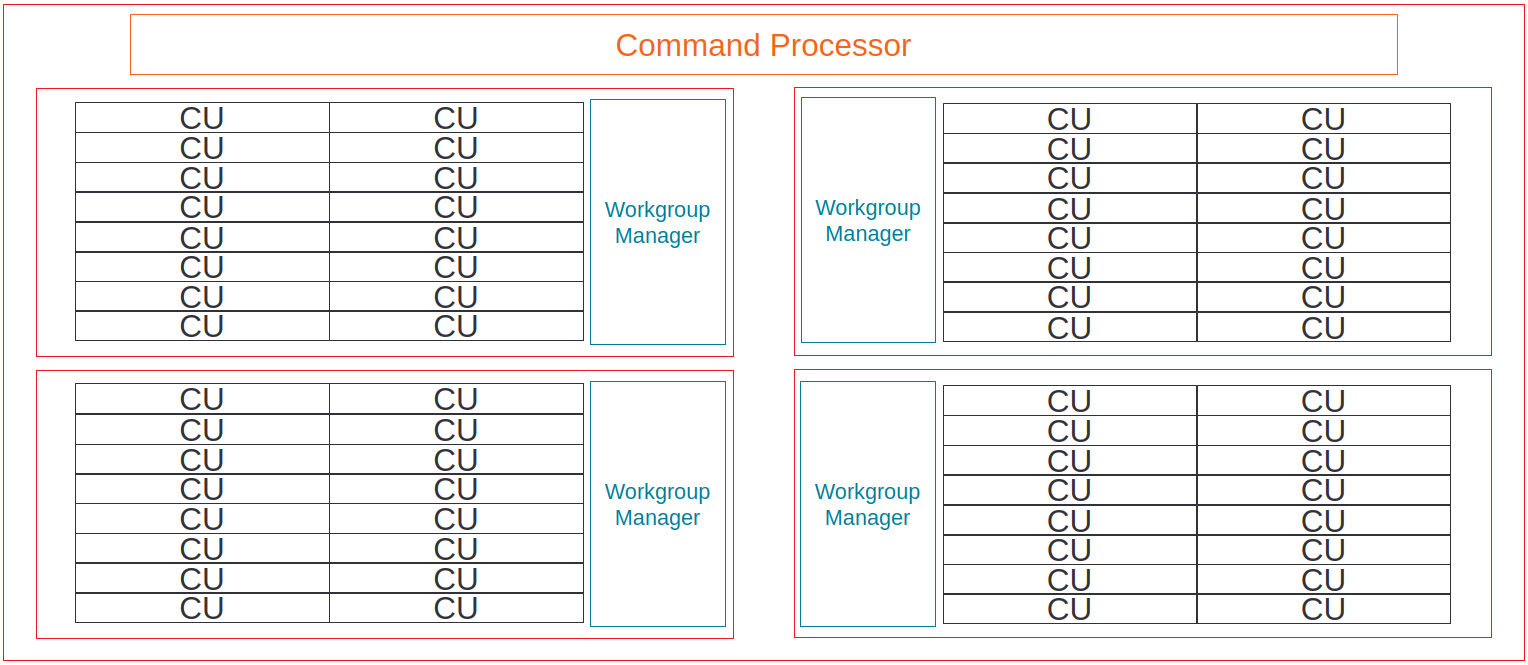
Fig. 51 Example of CU-grouping into shader engines on AMD Instinct MI-series accelerators.#
The number of CUs on a SE varies from chip to chip – see for example Introduction to AMD GPU Programming with HIP (slide 20). In addition, newer accelerators such as the AMD Instinct™ MI 250X have 8 SEs per accelerator.
For the purposes of Omniperf, we consider resources that are shared between multiple CUs on a single SE as part of the SE’s metrics.
These include:
Scalar L1 data cache (sL1D)#
The Scalar L1 Data cache (sL1D) can cache data accessed from scalar load instructions (and scalar store instructions on architectures where they exist) from wavefronts in the CUs. The sL1D is shared between multiple CUs (The AMD GCN Architecture - A Crash Course (slide 36)) – the exact number of CUs depends on the architecture in question (3 CUs in GCN™ GPUs and MI100, 2 CUs in MI2XX) – and is backed by the L2 cache.
In typical usage, the data in the sL1D is comprised of:
Kernel arguments, such as pointers, non-populated grid and block dimensions, and others
HIP’s
__constant__memory, when accessed in a provably uniform manner [1]Other memory, when accessed in a provably uniform manner, and the backing memory is provably constant [1]
Scalar L1D Speed-of-Light#
Warning
The theoretical maximum throughput for some metrics in this section are
currently computed with the maximum achievable clock frequency, as reported
by rocminfo, for an accelerator. This may not be realistic for all
workloads.
The Scalar L1D speed-of-light chart shows some key metrics of the sL1D cache as a comparison with the peak achievable values of those metrics:
Metric |
Description |
Unit |
|---|---|---|
Bandwidth |
The number of bytes looked up in the sL1D cache, as a percent of the peak theoretical bandwidth. Calculated as the ratio of sL1D requests over the total sL1D cycles. |
Percent |
Cache Hit Rate |
The percent of sL1D requests that hit [2] on a previously loaded line in the cache. Calculated as the ratio of the number of sL1D requests that hit over the number of all sL1D requests. |
Percent |
sL1D-L2 BW |
The number of bytes requested by the sL1D from the L2 cache, as a percent of the peak theoretical sL1D → L2 cache bandwidth. Calculated as the ratio of the total number of requests from the sL1D to the L2 cache over the total sL1D-L2 interface cycles. |
Percent |
Scalar L1D cache accesses#
This panel gives more detail on the types of accesses made to the sL1D, and the hit/miss statistics.
Metric |
Description |
Unit |
|---|---|---|
Requests |
The total number of requests, of any size or type, made to the sL1D per normalization unit. |
Requests per normalization unit |
Hits |
The total number of sL1D requests that hit on a previously loaded cache line, per normalization unit. |
Requests per normalization unit |
Misses - Non Duplicated |
The total number of sL1D requests that missed on a cache line that was not already pending due to another request, per normalization unit. See Scalar L1D Speed-of-Light for more detail. |
Requests per normalization unit |
Misses - Duplicated |
The total number of sL1D requests that missed on a cache line that was already pending due to another request, per normalization unit. See Scalar L1D Speed-of-Light for more detail. |
Requests per normalization unit |
Cache Hit Rate |
Indicates the percent of sL1D requests that hit on a previously loaded line the cache. The ratio of the number of sL1D requests that hit [2] over the number of all sL1D requests. |
Percent |
Read Requests (Total) |
The total number of sL1D read requests of any size, per normalization unit. |
Requests per normalization unit |
Atomic Requests |
The total number of sL1D atomic requests of any size, per normalization unit. Typically unused on CDNA accelerators. |
Requests per normalization unit |
Read Requests (1 DWord) |
The total number of sL1D read requests made for a single dword of data (4B), per normalization unit. |
Requests per normalization unit |
Read Requests (2 DWord) |
The total number of sL1D read requests made for a two dwords of data (8B), per normalization unit. |
Requests per normalization unit |
Read Requests (4 DWord) |
The total number of sL1D read requests made for a four dwords of data (16B), per normalization unit. |
Requests per normalization unit |
Read Requests (8 DWord) |
The total number of sL1D read requests made for a eight dwords of data (32B), per normalization unit. |
Requests per normalization unit |
Read Requests (16 DWord) |
The total number of sL1D read requests made for a sixteen dwords of data (64B), per normalization unit. |
Requests per normalization unit |
sL1D ↔ L2 Interface#
This panel gives more detail on the data requested across the sL1D↔ L2 interface.
Metric |
Description |
Unit |
|---|---|---|
sL1D-L2 BW |
The total number of bytes read from, written to, or atomically updated across the sL1D↔:doc:L2 <l2-cache> interface, per normalization unit. Note that sL1D writes and atomics are typically unused on current CDNA accelerators, so in the majority of cases this can be interpreted as an sL1D→L2 read bandwidth. |
Bytes per normalization unit |
Read Requests |
The total number of read requests from sL1D to the L2, per normalization unit. |
Requests per normalization unit |
Write Requests |
The total number of write requests from sL1D to the L2, per normalization unit. Typically unused on current CDNA accelerators. |
Requests per normalization unit |
Atomic Requests |
The total number of atomic requests from sL1D to the L2, per normalization unit. Typically unused on current CDNA accelerators. |
Requests per normalization unit |
Stall Cycles |
The total number of cycles the sL1D↔ L2 interface was stalled, per normalization unit. |
Cycles per normalization unit |
Footnotes
L1 Instruction Cache (L1I)#
As with the sL1D, the L1 Instruction (L1I) cache is shared between multiple CUs on a shader-engine, where the precise number of CUs sharing a L1I depends on the architecture in question (The AMD GCN Architecture - A Crash Course (slide 36)) and is backed by the L2 cache. Unlike the sL1D, the instruction cache is read-only.
L1I Speed-of-Light#
Warning
The theoretical maximum throughput for some metrics in this section are
currently computed with the maximum achievable clock frequency, as reported
by rocminfo, for an accelerator. This may not be realistic for all
workloads.
The L1 Instruction Cache speed-of-light chart shows some key metrics of the L1I cache as a comparison with the peak achievable values of those metrics:
Metric |
Description |
Unit |
|---|---|---|
Bandwidth |
The number of bytes looked up in the L1I cache, as a percent of the peak theoretical bandwidth. Calculated as the ratio of L1I requests over the total L1I cycles. |
Percent |
Cache Hit Rate |
The percent of L1I requests that hit on a previously loaded line the cache. Calculated as the ratio of the number of L1I requests that hit [3] over the number of all L1I requests. |
Percent |
L1I-L2 BW |
The percent of the peak theoretical L1I → L2 cache request bandwidth achieved. Calculated as the ratio of the total number of requests from the L1I to the L2 cache over the total L1I-L2 interface cycles. |
Percent |
Instruction Fetch Latency |
The average number of cycles spent to fetch instructions to a CU. |
Cycles |
L1I cache accesses#
This panel gives more detail on the hit/miss statistics of the L1I:
Metric |
Description |
Unit |
|---|---|---|
Requests |
The total number of requests made to the L1I per normalization-unit. |
Requests per normalization unit. |
Hits |
The total number of L1I requests that hit on a previously loaded cache line, per normalization-unit. |
Requests per normalization unit |
Misses - Non Duplicated |
The total number of L1I requests that missed on a cache line that were not already pending due to another request, per normalization-unit. See note in L1I Speed-of-Light for more detail. |
Requests per normalization unit. |
Misses - Duplicated |
The total number of L1I requests that missed on a cache line that were already pending due to another request, per normalization-unit. See note in L1I Speed-of-Light for more detail. |
Requests per normalization unit |
Cache Hit Rate |
The percent of L1I requests that hit [3] on a previously loaded line the cache. Calculated as the ratio of the number of L1I requests that hit over the number of all L1I requests. |
Percent |
L1I - L2 interface#
This panel gives more detail on the data requested across the L1I-L2 interface.
Metric |
Description |
Unit |
|---|---|---|
L1I-L2 BW |
The total number of bytes read across the L1I-L2 interface, per normalization unit. |
Bytes per normalization unit |
Footnotes
Workgroup manager (SPI)#
The workgroup manager (SPI) is the bridge between the command processor and the compute units. After the command processor processes a kernel dispatch, it will then pass the dispatch off to the workgroup manager, which then schedules workgroups onto the compute units. As workgroups complete execution and resources become available, the workgroup manager will schedule new workgroups onto compute units. The workgroup manager’s metrics therefore are focused on reporting the following:
Utilizations of various parts of the accelerator that the workgroup manager interacts with (and the workgroup manager itself)
How many workgroups were dispatched, their size, and how many resources they used
Percent of scheduler opportunities (cycles) where workgroups failed to dispatch, and
Percent of scheduler opportunities (cycles) where workgroups failed to dispatch due to lack of a specific resource on the CUs (for instance, too many VGPRs allocated)
This gives you an idea of why the workgroup manager couldn’t schedule more wavefronts onto the device, and is most useful for workloads that you suspect to be limited by scheduling or launch rate.
As discussed in Command processor, the command processor on AMD Instinct MI-series architectures contains four hardware scheduler-pipes, each with eight software threads (AMD Radeon Next Generation GPU Architecture - Vega10 (slide 19)). Each scheduler-pipe can issue a kernel dispatch to the workgroup manager to schedule concurrently. Therefore, some workgroup manager metrics are presented relative to the utilization of these scheduler-pipes (for instance, whether all four are issuing concurrently).
Note
Current versions of the profiling libraries underlying Omniperf attempt to serialize concurrent kernels running on the accelerator, as the performance counters on the device are global (that is, shared between concurrent kernels). This means that these scheduler-pipe utilization metrics are expected to reach (for example) a maximum of one pipe active – only 25%.
Workgroup manager utilizations#
This section describes the utilization of the workgroup manager, and the hardware components it interacts with.
Metric |
Description |
Unit |
|---|---|---|
Accelerator utilization |
The percent of cycles in the kernel where the accelerator was actively doing any work. |
Percent |
Scheduler-pipe utilization |
The percent of total scheduler-pipe cycles in the kernel where the scheduler-pipes were actively doing any work. Note: this value is expected to range between 0% and 25%. See Workgroup manager (SPI). |
Percent |
Workgroup manager utilization |
The percent of cycles in the kernel where the workgroup manager was actively doing any work. |
Percent |
Shader engine utilization |
The percent of total shader engine cycles in the kernel where any CU in a shader-engine was actively doing any work, normalized over all shader-engines. Low values (e.g., << 100%) indicate that the accelerator was not fully saturated by the kernel, or a potential load-imbalance issue. |
Percent |
SIMD utilization |
The percent of total SIMD cycles in the kernel where any SIMD on a CU was actively doing any work, summed over all CUs. Low values (less than 100%) indicate that the accelerator was not fully saturated by the kernel, or a potential load-imbalance issue. |
Percent |
Dispatched workgroups |
The total number of workgroups forming this kernel launch. |
Workgroups |
Dispatched wavefronts |
The total number of wavefronts, summed over all workgroups, forming this kernel launch. |
Wavefronts |
VGPR writes |
The average number of cycles spent initializing VGPRs at wave creation. |
Cycles/wave |
SGPR Writes |
The average number of cycles spent initializing SGPRs at wave creation. |
Cycles/wave |
Resource allocation#
This panel gives more detail on how workgroups and wavefronts were scheduled onto compute units, and what occupancy limiters they hit – if any. When analyzing these metrics, you should also take into account their achieved occupancy – such as wavefront occupancy. A kernel may be occupancy limited by LDS usage, for example, but may still achieve high occupancy levels such that improving occupancy further may not improve performance. See Occupancy limiters example for details.
Metric |
Description |
Unit |
|---|---|---|
Not-scheduled rate (Workgroup Manager) |
The percent of total scheduler-pipe cycles in the kernel where a workgroup could not be scheduled to a CU due to a bottleneck within the workgroup manager rather than a lack of a CU or SIMD with sufficient resources. Note: this value is expected to range between 0-25%. See note in workgroup manager description. |
Percent |
Not-scheduled rate (Scheduler-Pipe) |
The percent of total scheduler-pipe cycles in the kernel where a workgroup could not be scheduled to a CU due to a bottleneck within the scheduler-pipes rather than a lack of a CU or SIMD with sufficient resources. Note: this value is expected to range between 0-25%, see note in workgroup manager description. |
Percent |
Scheduler-Pipe Stall Rate |
The percent of total scheduler-pipe cycles in the kernel where a workgroup could not be scheduled to a CU due to occupancy limitations (like a lack of a CU or SIMD with sufficient resources). Note: this value is expected to range between 0-25%, see note in workgroup manager description. |
Percent |
Scratch Stall Rate |
The percent of total shader-engine cycles in the kernel where a workgroup could not be scheduled to a CU due to lack of private (a.k.a., scratch) memory slots. While this can reach up to 100%, note that the actual occupancy limitations on a kernel using private memory are typically quite small (for example, less than 1% of the total number of waves that can be scheduled to an accelerator). |
Percent |
Insufficient SIMD Waveslots |
The percent of total SIMD cycles in the kernel where a workgroup could not be scheduled to a SIMD due to lack of available waveslots. |
Percent |
Insufficient SIMD VGPRs |
The percent of total SIMD cycles in the kernel where a workgroup could not be scheduled to a SIMD due to lack of available VGPRs. |
Percent |
Insufficient SIMD SGPRs |
The percent of total SIMD cycles in the kernel where a workgroup could not be scheduled to a SIMD due to lack of available SGPRs. |
Percent |
Insufficient CU LDS |
The percent of total CU cycles in the kernel where a workgroup could not be scheduled to a CU due to lack of available LDS. |
Percent |
Insufficient CU Barriers |
The percent of total CU cycles in the kernel where a workgroup could not be scheduled to a CU due to lack of available barriers. |
Percent |
Reached CU Workgroup Limit |
The percent of total CU cycles in the kernel where a workgroup could not be scheduled to a CU due to limits within the workgroup manager. This is expected to be always be zero on CDNA2 or newer accelerators (and small for previous accelerators). |
Percent |
Reached CU Wavefront Limit |
The percent of total CU cycles in the kernel where a wavefront could not be scheduled to a CU due to limits within the workgroup manager. This is expected to be always be zero on CDNA2 or newer accelerators (and small for previous accelerators). |
Percent |