Using ROCTx#
ROCTx is an AMD tools extension library, a cross platform API for annotating code with markers and ranges. The ROCTx API is written in C++. In certain situations, such as debugging performance issues in large-scale GPU programs, API-level tracing might be too fine-grained to provide an overview of the program execution. In such cases, it is helpful to define specific tasks to be traced. To specify the tasks for tracing, enclose the respective source code with the API calls provided by the ROCTx library. This process is also known as instrumentation.
To use rocprofv3 for marker tracing, including and linking to old ROCTx works but it’s recommended to switch to the new ROCTx to utilize new APIs.
To use the new ROCTx, include header "rocprofiler-sdk-roctx/roctx.h" and link your application with librocprofiler-sdk-roctx.so.
To see the complete list of ROCTx APIs, see public header file "rocprofiler-sdk-roctx/roctx.h".
ROCTx annotations#
ROCTx provides two types of annotations: markers and ranges.
Markers#
Markers are used to insert a marker in the code with a message. Creating markers helps you see when a line of code is executed.
When using ROCTx markers with profiling tools that support Perfetto trace visualization, such as rocprofv3 or rocprof-sys, markers created using roctxMark() appear as arrows in the Perfetto UI timeline. For example, markers like roctxMark("pre-launch") and roctxMark("post-kernel-launch") will be displayed as visual markers pointing to the exact timestamp when that line of code was executed.
To illustrate this, a call to roctxMark("iter") was added after the kernel launch in the timing loop of the daxpy training example code. In the Perfetto trace generated using rocprofv3 --runtime-trace and rocpd2pftrace, visual markers are visible at the end of each kernel launch in the timing loop ROCTx region.
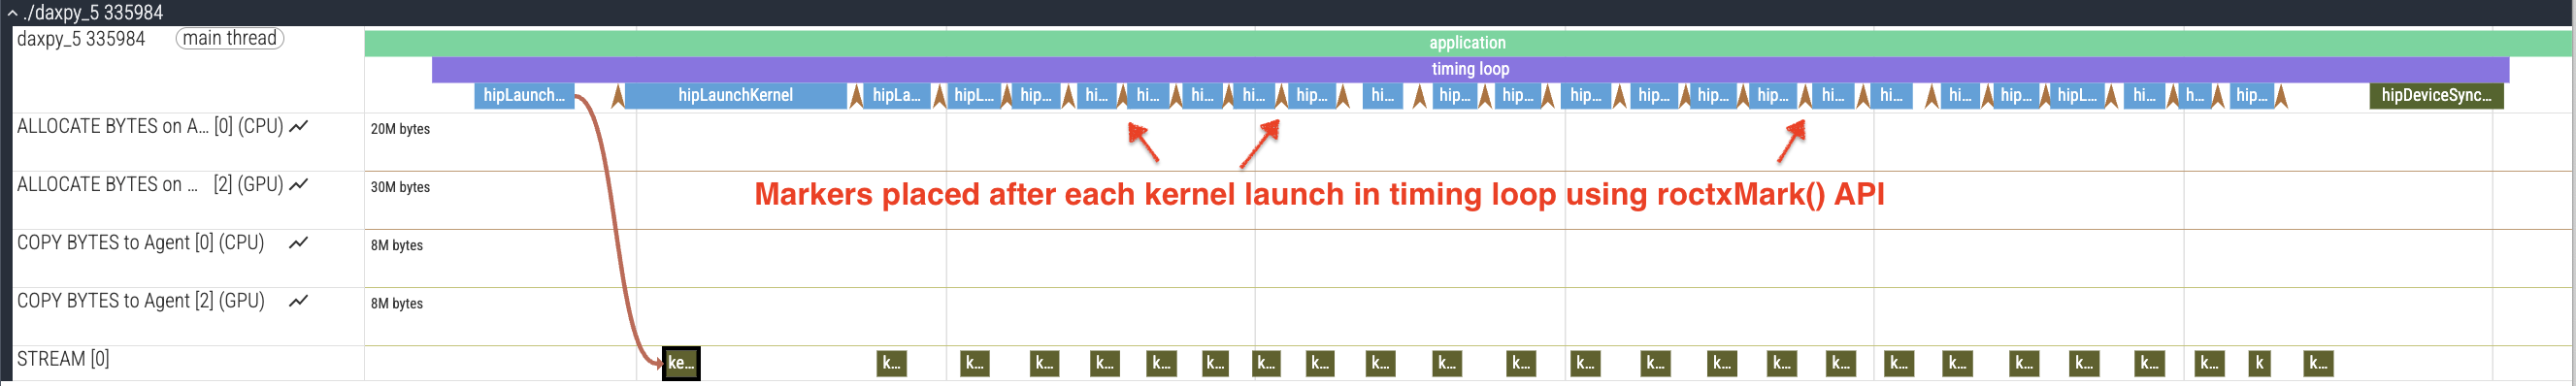
Example of roctxMark() annotations appearing as arrows in the Perfetto UI timeline#
Ranges#
Ranges are used to define the scope of code for instrumentation using enclosing API calls.
A range is a programmer-defined task that has a well-defined start and end code scope.
You can further refine the scope specified within a range using nested ranges. rocprofv3 also reports the timelines for these nested ranges.
These are the two types of ranges:
Push and Pop: These can be nested to form a stack. The Pop call is automatically associated with a prior Push call on the same thread.
Start and End: These may overlap with other ranges arbitrarily. The Start call returns a handle that must be passed to the End call. These ranges can start and end on different threads.
ROCTx APIs#
Here is the list of useful APIs for code instrumentation:
roctxMark: Inserts a marker in the code with a message. Creating marks help you see when a line of code is executed.roctxRangeStart: Starts a range. Different threads can start ranges.roctxRangePush: Starts a new nested range.roctxRangePop: Stops the current nested range.roctxRangeStop: Stops the given range.roctxProfilerPause: Requests any currently running profiling tool to stop data collection.roctxProfilerResume: Requests any currently running profiling tool to resume data collection.roctxGetThreadId: Retrieves the ID for the current thread identical to the ID received usingrocprofiler_get_thread_id(rocprofiler_thread_id_t*).roctxNameOsThread: Labels the current CPU OS thread in the profiling tool output with the provided name.roctxNameHsaAgent: Labels the given HSA agent in the profiling tool output with the provided name.roctxNameHipDevice: Labels the HIP device ID in the profiling tool output with the provided name.roctxNameHipStream: Labels the given HIP stream in the profiling tool output with the provided name.
Using ROCTx in the application#
The following sample code from the MatrixTranspose application shows the usage of ROCTx APIs:
#include <rocprofiler-sdk-roctx/roctx.h>

roctxMark("before hipLaunchKernel");
int rangeId = roctxRangeStart("hipLaunchKernel range");
roctxRangePush("hipLaunchKernel");

// Launching kernel from host
hipLaunchKernelGGL(matrixTranspose, dim3(WIDTH/THREADS_PER_BLOCK_X, WIDTH/THREADS_PER_BLOCK_Y), dim3(THREADS_PER_BLOCK_X, THREADS_PER_BLOCK_Y), 0,0,gpuTransposeMatrix,gpuMatrix, WIDTH);

roctxMark("after hipLaunchKernel");

// Memory transfer from device to host
roctxRangePush("hipMemcpy");

hipMemcpy(TransposeMatrix, gpuTransposeMatrix, NUM * sizeof(float), hipMemcpyDeviceToHost);

roctxRangePop();  // for "hipMemcpy"
roctxRangePop();  // for "hipLaunchKernel"
roctxRangeStop(rangeId);
To trace the API calls enclosed within the range, use:
rocprofv3 --marker-trace --output-format csv -- <application_path>
Running the preceding command generates a marker_api_trace.csv file prefixed with the process ID.
$ cat 210_marker_api_trace.csv
Here are the contents of marker_api_trace.csv file:
Domain |
Function |
Process_Id |
Thread_Id |
Correlation_Id |
Start_Timestamp |
End_Timestamp |
|---|---|---|---|---|---|---|
MARKER_CORE_API |
before hipLaunchKernel |
717 |
717 |
1 |
1520113899312225 |
1520113899312225 |
MARKER_CORE_API |
after hipLaunchKernel |
717 |
717 |
4 |
1520113900128482 |
1520113900128482 |
MARKER_CORE_API |
hipMemcpy |
717 |
717 |
5 |
1520113900141100 |
1520113901483408 |
MARKER_CORE_API |
hipLaunchKernel |
717 |
717 |
3 |
1520113899684965 |
1520113901491622 |
MARKER_CORE_API |
hipLaunchKernel range |
717 |
0 |
2 |
1520113899682208 |
1520113901495882 |
For the description of the fields in the output file, see Output file fields.
roctxProfilerPause and roctxProfilerResume can be used to hide the calls between them. This is useful when you want to hide the calls that are not relevant to your profiling session.
#include <rocprofiler-sdk-roctx/roctx.h>

// Memory transfer from host to device
HIP_API_CALL(hipMemcpy(gpuMatrix, Matrix, NUM * sizeof(float), hipMemcpyHostToDevice));

auto tid = roctx_thread_id_t{};
roctxGetThreadId(&tid);
roctxProfilerPause(tid);
// Memory transfer that should be hidden by profiling tool
HIP_API_CALL(
    hipMemcpy(gpuTransposeMatrix, gpuMatrix, NUM * sizeof(float), hipMemcpyDeviceToDevice));
roctxProfilerResume(tid);

// Launching kernel from host
hipLaunchKernelGGL(matrixTranspose,
                   dim3(WIDTH / THREADS_PER_BLOCK_X, WIDTH / THREADS_PER_BLOCK_Y),
                   dim3(THREADS_PER_BLOCK_X, THREADS_PER_BLOCK_Y),
                   0,
                   0,
                   gpuTransposeMatrix,
                   gpuMatrix,
                   WIDTH);

// Memory transfer from device to host
HIP_API_CALL(
    hipMemcpy(TransposeMatrix, gpuTransposeMatrix, NUM * sizeof(float), hipMemcpyDeviceToHost));
To trace the preceding code, use:
rocprofv3 --marker-trace --hip-trace --output-format csv -- <application_path>
The preceding command generates a hip_api_trace.csv file prefixed with the process ID. The file contains two hipMemcpy calls with the in-between hipMemcpyDeviceToHost call hidden .
"Domain","Function","Process_Id","Thread_Id","Correlation_Id","Start_Timestamp","End_Timestamp"
"HIP_COMPILER_API","__hipRegisterFatBinary",1643920,1643920,1,320301257609216,320301257636427
"HIP_COMPILER_API","__hipRegisterFunction",1643920,1643920,2,320301257650707,320301257678857
"HIP_RUNTIME_API","hipGetDevicePropertiesR0600",1643920,1643920,4,320301258114239,320301337764472
"HIP_RUNTIME_API","hipMalloc",1643920,1643920,5,320301338073823,320301338247374
"HIP_RUNTIME_API","hipMalloc",1643920,1643920,6,320301338248284,320301338399595
"HIP_RUNTIME_API","hipMemcpy",1643920,1643920,7,320301338410995,320301631549262
"HIP_COMPILER_API","__hipPushCallConfiguration",1643920,1643920,10,320301632131175,320301632134215
"HIP_COMPILER_API","__hipPopCallConfiguration",1643920,1643920,11,320301632137745,320301632139735
"HIP_RUNTIME_API","hipLaunchKernel",1643920,1643920,12,320301632142615,320301632898289
"HIP_RUNTIME_API","hipMemcpy",1643920,1643920,14,320301632901249,320301633934395
"HIP_RUNTIME_API","hipFree",1643920,1643920,15,320301643320908,320301643511479
"HIP_RUNTIME_API","hipFree",1643920,1643920,16,320301643512629,320301643585639
Profiler control with selected regions#
The roctxProfilerPause() and roctxProfilerResume() APIs can be used in two different ways depending on whether the --selected-regions option is used with rocprofv3.
Two modes of operation#
Mode 1: Default behavior (without –selected-regions)
When running rocprofv3 without the --selected-regions option, profiling is enabled as soon as the application starts. The roctxProfilerPause() and roctxProfilerResume() APIs are used to temporarily hide specific sections of code from profiling.
Use case: Profile everything excluding the specific regions.
Profiler starts: Enabled
roctxProfilerPause(): Temporarily stops data collection.roctxProfilerResume(): Resumes data collection.
This mode is demonstrated in the example from the previous section.
Mode 2: Selected regions profiling (with –selected-regions)
When running rocprofv3 with the --selected-regions option, profiling is disabled by default. Data collection takes place only for regions explicitly enclosed within roctxProfilerResume() and roctxProfilerPause() calls.
Use case: Profile only the specific regions, exclude everything else.
Profiler starts: Disabled
roctxProfilerResume(): Starts data collection.roctxProfilerPause(): Stops data collection.All tracing and profiling options collect data only within the marked regions.
Using –selected-regions option#
The --selected-regions option enables profiling only for the explicitly marked code regions. This provides fine-grained control over data collection, allowing you to focus profiling on specific regions of interest in your application.
Important
When --selected-regions is enabled, all the requested tracing or profiling data, such as kernel traces, API traces, memory copy traces, counter collection, and so on, is collected only for the regions enclosed within the roctxProfilerResume() and roctxProfilerPause() calls. This is not limited to marker traces; it controls all profiling activity.
Example of selected regions:
Here is a code sample with explicitly marked code regions within the roctxProfilerResume() and roctxProfilerPause() calls:
#include <rocprofiler-sdk-roctx/roctx.h>

// Initialization code (not profiled when using --selected-regions)
hipMalloc(&gpuMatrix, NUM * sizeof(float));
hipMalloc(&gpuTransposeMatrix, NUM * sizeof(float));

// Start profiling for region 1
roctxProfilerResume(0);

// Region 1: Data transfer and computation (will be profiled)
hipMemcpy(gpuMatrix, Matrix, NUM * sizeof(float), hipMemcpyHostToDevice);
hipLaunchKernelGGL(matrixTranspose,
                   dim3(WIDTH / THREADS_PER_BLOCK_X, WIDTH / THREADS_PER_BLOCK_Y),
                   dim3(THREADS_PER_BLOCK_X, THREADS_PER_BLOCK_Y),
                   0, 0,
                   gpuTransposeMatrix, gpuMatrix, WIDTH);

// Stop profiling
roctxProfilerPause(0);

// Code here is not profiled
someOtherFunction();

// Start profiling for region 2
roctxProfilerResume(0);

// Region 2: Result retrieval (will be profiled)
hipMemcpy(TransposeMatrix, gpuTransposeMatrix, NUM * sizeof(float), hipMemcpyDeviceToHost);

// Stop profiling
roctxProfilerPause(0);

// Cleanup (not profiled)
hipFree(gpuMatrix);
hipFree(gpuTransposeMatrix);
When the preceding code is run with selected regions enabled as shown here:
rocprofv3 --selected-regions --hip-trace --kernel-trace --output-format csv -- <application_path>
This command will collect HIP API traces and kernel traces only for the regions enclosed within roctxProfilerResume(0) and roctxProfilerPause(0). The initialization code, someOtherFunction(), and cleanup code will not be profiled.
Multiple region profiling:
You can instrument your code with multiple roctxProfilerResume() and roctxProfilerPause() pairs throughout the application. For each such pair, the --selected-regions option collects data in each region where profiling is resumed. There is no need to provide a list of regions as all regions enclosed within the API calls will be profiled automatically.
Nested pause-resume pairs:
By default, each roctxProfilerResume() and roctxProfilerPause() call directly toggles profiling on or off. For nested pairs, such as a function with profiling control called from within another profiled region, the innermost call affects the profiling state. To handle nested pairs with reference counting, use the --selected-regions-ref-count option, which uses reference counting for pause and resume calls and only toggles profiling when the outermost pair boundaries are crossed.
Thread-specific control:
For more fine-grained control, you can use thread-specific pause and resume:
roctx_thread_id_t tid;
roctxGetThreadId(&tid);

roctxProfilerResume(tid);  // Resume profiling on current thread only
// ... code to profile ...
roctxProfilerPause(tid);   // Pause profiling on current thread only
When using 0 as the thread ID argument, the control applies to all threads. When using a specific thread ID (obtained via roctxGetThreadId()), the control applies only to that thread.
Combining with other profiling options:
The --selected-regions option works with all tracing and profiling options, such as:
API tracing:
--hip-trace,--hsa-trace,--marker-trace,--rccl-trace, and others.Kernel tracing:
--kernel-trace.Memory tracing:
--memory-copy-trace,--memory-allocation-trace,--scratch-memory-trace.Counter collection:
--pmc.Thread tracing:
--advanced-thread-trace.PC sampling:
--pc-sampling-beta-enabled.
Note
The
--selected-regionsoption can’t be used together with--collection-period. These are mutually exclusive profiling control mechanisms. Use--selected-regionsfor code-based control and--collection-periodfor time-based control.For thread trace (ATT) profiling,
--att --selected-regionscan be used together to control exactly which GPU kernel dispatches are thread-traced, usingroctxProfilerResume(0)androctxProfilerPause(0). See Using thread trace for details.
Comparison summary:
The following table compares the behavior when profiling with and without --selected-regions option:
Aspect |
Without –selected-regions |
With –selected-regions |
|---|---|---|
Initial profiler state |
Enabled (profiling active) |
Disabled (profiling inactive) |
roctxProfilerPause() effect |
Temporarily hides code from profiling |
Stops profiling in a region |
roctxProfilerResume() effect |
Resumes profiling after pause |
Starts profiling in a region |
Use case |
Profiles everything except marked regions |
Profiles only marked regions |
Typical workflow |
Excludes uninteresting regions |
Includes only interesting regions |
Data collected |
All code except paused regions |
Only resumed regions |
Resource naming#
ROCTx provides APIs to rename certain resources in the output generated by the profiling tool. You can pass the desired label for a specific resource in the output as an argument to the API. Note that ROCprofiler-SDK doesn’t provide any explicit support for how profiling tools handle this request. Support for this capability is tool-specific.
The following table lists the APIs available for labeling the given resources:
Resource |
API |
Description |
|---|---|---|
OS thread |
|
Labels the current CPU OS thread with the given name in the output. Note that ROCTx does NOT rename the thread using |
HIP runtime |
roctxNameHipDevice(const char* name, int device_id) roctxNameHipStream(const char* name, const struct ihipStream_t* stream) |
Labels the given HIP device ID with the given name in the output.
Labels the given HIP stream ID with the given name in the output.
|
HSA runtime |
|
Labels the given HSA agent with the given name in the output. |
Using ROCTx in the python application#
ROCTx APIs can be used in a python application using the roctx module. The APIs are available as functions in the module. The API names are prefixed with roctx to avoid name conflicts with other libraries.
The following sample code from the MatrixTranspose application shows the usage of ROCTx APIs in a python application:
import os
import roctx
import random
from roctx.context_decorators import RoctxRange

_prefix = os.path.basename(__file__)

@RoctxRange("matrix_transpose")
def matrix_transpose(matrix):
    nrows = len(matrix)
    ncols = len(matrix[0]) if nrows > 0 else 0
    with RoctxRange(f"transpose(nrows={nrows}, ncols={ncols})"):
        # Transpose the matrix
        transposed = [[matrix[j][i] for j in range(nrows)] for i in range(ncols)]
        return transposed

def generate_matrix(rows, cols):
    with RoctxRange(f"generate_matrix(rows={rows}, cols={cols})"):
        return [[random.randint(0, 100) for _ in range(cols)] for _ in range(rows)]

def run(rows, cols):
    idx = roctx.rangeStart(f"run(rows={rows}, cols={cols})")
    matrix = generate_matrix(rows, cols)
    transposed = matrix_transpose(matrix)
    roctx.rangeStop(idx)
    return matrix, transposed

if __name__ == "__main__":
    import argparse

    parser = argparse.ArgumentParser()
    parser.add_argument("-r", "--rows", type=int, default=4, help="Number of rows")
    parser.add_argument("-c", "--cols", type=int, default=5, help="Number of columns")
    args = parser.parse_args()

    roctx.mark(f"MatrixTranspose: rows={args.rows}, cols={args.cols}")
    with RoctxRange("main"):
        matrix, transposed = run(args.rows, args.cols)
        print(f"[{_prefix}] Original matrix:")
        for row in matrix:
            print(row)
        print(f"\n[{_prefix}] Transposed matrix:")
        for row in transposed:
            print(row)
Before using the roctx module for python application, ensure that the roctx module is built, installed and available in your python environment.
An example to build and install roctx module is as follows:
cmake -B build-sdk -DCMAKE_INSTALL_PREFIX=/opt/rocm -DROCPROFILER_PYTHON_VERSIONS="3.10" -DCMAKE_PREFIX_PATH=/opt/rocm
If you are using a different python version, replace 3.10 with the appropriate version in the above command.
Multiple python versions can be specified in the ROCPROFILER_PYTHON_VERSIONS variable. The roctx module will be built and installed for all the specified python versions.
``cmake -B build-sdk -DCMAKE_INSTALL_PREFIX=/opt/rocm -DROCPROFILER_PYTHON_VERSIONS="3.8;3.9;3.10;3.11;3.12" -DCMAKE_PREFIX_PATH=/opt/rocm``
Based on the python major.minor version and the roctx module install path (“/opt/rocm” in above example), set the PYTHONPATH environment variable to include the path to the roctx module.
export PYTHONPATH="<install-path>/lib/pythonX.Y/site-packages:$PYTHONPATH"
Above example will install the roctx module in /opt/rocm/lib/python3.10/site-packages, set the PYTHONPATH as follows:
export PYTHONPATH=/opt/rocm/lib/python3.10/site-packages:$PYTHONPATH
Once the PYTHONPATH is set, user should be able to import the roctx package:
python3 -c "import roctx"
User can profile the python application which is annotated with ROCTx markers using rocprofv3 as follows:
rocprofv3 --marker-trace --output-format csv -- $(which python) <python_application_path>
The preceding command generates a marker_api_trace.csv file prefixed with the process ID.
Domain |
Function |
Process_Id |
Thread_Id |
Correlation_Id |
Start_Timestamp |
End_Timestamp |
|---|---|---|---|---|---|---|
MARKER_CORE_API |
MatrixTranspose: rows=4, cols=5 |
15964 |
15964 |
1 |
1392141764711512 |
1392141764711512 |
MARKER_CORE_API |
generate_matrix(rows=4, cols=5) |
15964 |
15964 |
4 |
1392141765500646 |
1392141765523276 |
MARKER_CORE_API |
transpose(nrows=4, ncols=5) |
15964 |
15964 |
7 |
1392141765527536 |
1392141765531786 |
MARKER_CORE_API |
matrix_transpose |
15964 |
15964 |
6 |
1392141765525156 |
1392141765532696 |
MARKER_CORE_API |
run(rows=4, cols=5) |
15964 |
15964 |
3 |
1392141765498106 |
1392141765534186 |
MARKER_CORE_API |
main |
15964 |
15964 |
2 |
1392141765494795 |
1392141765574506 |