What is ROCprofiler-SDK?#
ROCprofiler-SDK is a profiling infrastructure for GPU compute applications on ROCm. It provides hardware performance counters, API tracing, PC sampling, thread trace, and streaming performance monitoring through a unified, context-based API. The rocprofv3 command-line tool exposes all of these capabilities without requiring source code changes or tool library development.
This topic orients you to the SDK’s design and services. For step-by-step usage, follow the links to the relevant how-to guides.
Context model#
The context is the central design concept in ROCprofiler-SDK — a bundle of profiling services declared upfront during tool initialization. Profiling overhead is scoped to exactly the services requested; services that aren’t configured impose no interception cost on the application.
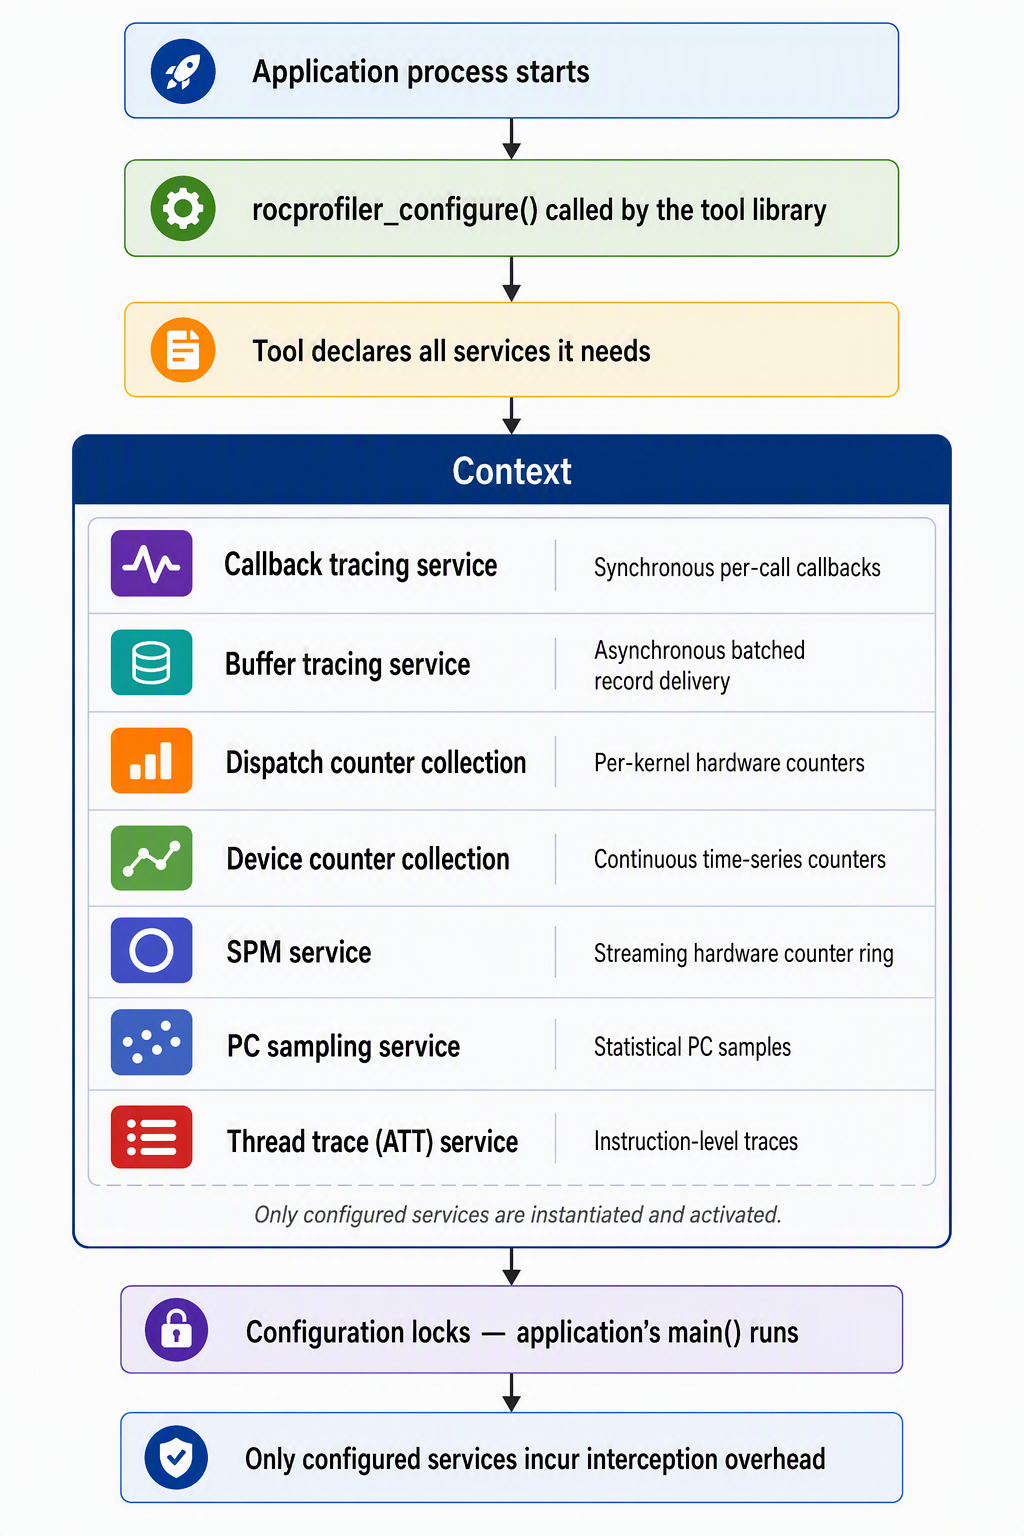
Multiple tools can run simultaneously, each with its own context. ROCprofiler-SDK assigns a priority to each tool at registration, so a lower-priority tool can inspect what higher-priority tools have already configured.
Advanced profiling features#
ATT, PC sampling, and SPM provide hardware-level observability beyond standard counter collection and API tracing.
Advanced Thread Trace (ATT)#
ATT records the complete instruction-level execution history of GPU wavefronts on targeted compute units. It is exposed via rocprofiler-sdk/experimental/thread_trace.h and delivers raw SQTT (Shader Queue Thread Trace) data. The rocprof-trace-decoder library decodes this data for visualization in ROCprof Compute Viewer (RCV).
How ATT differs from counter-based services#
Unlike PMC collection, ATT doesn’t accumulate counter values — it records every instruction issued or stalled on the selected compute unit for the duration of the traced dispatch.
The following table highlights the key differences in granularity, data type, and output size across Dispatch PMC, PC sampling, and ATT.
Property |
Dispatch PMC |
PC sampling |
ATT |
|---|---|---|---|
Granularity |
Accumulated per kernel |
Statistical sample per wavefront |
Every instruction on traced CU |
Data type |
Hardware counter values |
PC + execution state snapshot |
Full wavefront execution history |
Kernel serialization required |
Yes |
No |
No (only traced kernels serialized) |
Output size |
Small |
Medium |
Large (raw trace per dispatch) |
Use case |
What fraction of peak? |
Which code is hot? |
Which instruction is stalling, and why? |
Raw .att files are decoded by the rocprof-trace-decoder library into ui_output_agent_{agent_id}_dispatch_{dispatch_id}/ directories containing JSON and CSV files, which RCV reads directly. This output is separate from the --output-format pipeline (which defaults to rocpd for tracing data).
CLI options#
Use --att to enable Advanced Thread Trace. Additional options control kernel filtering, dispatch count, and SQ-block counter streaming (--att-perfcounters, gfx9 only). For the full parameter reference and runnable examples, see rocprofv3 parameters for thread tracing.
Hardware support#
ATT support varies by GPU architecture: AMD Instinct MI200/MI300/MI350 series (CDNA2/CDNA3/CDNA4) have full support for both instruction trace and perfmon streaming, while RDNA2-4 (gfx10-12) are trace-only and don’t support --att-perfcounters. For the full per-architecture matrix, see Supported devices.
ATT is limited to one compute unit per shader engine. For production workloads, use --kernel-include-regex to limit tracing to the target kernel and collect from the minimum number of shader engines needed.
For full usage details, see Using thread trace and ROCprof Trace Decoder and thread trace APIs.
PC sampling#
PC sampling periodically captures the program counter, execution state, and hardware context of active GPU wavefronts. It is exposed in ROCprofiler-SDK via rocprofiler-sdk/pc_sampling.h. Aggregating these program counter snapshots builds a statistical histogram of which code is executing, answering “what code is running?” SPM instead samples hardware counter values at fixed intervals, answering “how are hardware resources utilized over time?”
Note
PC sampling is a beta feature. It requires the environment variable ROCPROFILER_PC_SAMPLING_BETA_ENABLED=1 and can’t be used simultaneously with counter collection services in the same context.
Warning
PC sampling carries a risk of hardware freeze that requires a cold restart.
Sampling methods#
ROCprofiler-SDK supports two PC sampling methods: HOST_TRAP, which uses a software interrupt, and STOCHASTIC, which uses a hardware PMU. The following table compares their properties.
Property |
HOST_TRAP |
STOCHASTIC |
|---|---|---|
Mechanism |
Software interrupt (trap handler) |
Hardware PMU |
Supported hardware |
MI200+ (gfx90a+) |
MI300+ (gfx942+) |
Interval basis |
Time (microseconds) |
Cycles / instructions |
Additional data captured |
PC, exec mask, hardware IDs |
PC, instruction type, stall reason, wave_issued flag |
Recommendation |
MI200 series |
Preferred on gfx942 and later |
STOCHASTIC sampling probes waves actively running on the GPU and records whether each sampled wave issued an instruction at the captured PC, providing stall attribution that HOST_TRAP can’t deliver.
CLI options#
Use --pc-sampling-beta-enabled, --pc-sampling-method, --pc-sampling-unit, and --pc-sampling-interval to enable and configure PC sampling with rocprofv3. For the full option reference, see PC sampling in the CLI options reference.
Use rocprofv3-avail list --pc-sampling or info --pc-sampling to query which PC sampling configurations (methods, units, and interval ranges) each agent supports, without collecting a trace. See Using rocprofv3-avail for full usage details.
Hardware support#
Stochastic PC sampling requires AMD Instinct MI300-series (gfx942) or later; host-trap is supported on MI200-series (gfx90a) and later. For the full per-GPU support matrix, see Supported AMD Instinct GPUs.
Note
PC sampling is disabled by default and requires ROCPROFILER_PC_SAMPLING_BETA_ENABLED=1. This beta feature carries a risk of hardware freeze requiring a cold restart. Stochastic PC sampling is recommended over host-trap starting with gfx942.
For full usage details, see Using PC sampling and ROCprofiler-SDK PC sampling method.
Streaming Performance Monitoring (SPM)#
SPM is a hardware capability on AMD Radeon™ and Instinct™ GPUs that streams counter values continuously into a memory ring buffer at a configurable hardware interval, independent of kernel dispatch boundaries. It is an experimental API in ROCprofiler-SDK, exposed via rocprofiler-sdk/experimental/spm.h. Structs and enums are tagged ROCPROFILER_SDK_EXPERIMENTAL. The top-level rocprofiler-sdk/spm.h reincludes the experimental header and emits a deprecation warning directing users to the experimental path.
How SPM differs from other counter services#
ROCprofiler-SDK provides three hardware counter collection mechanisms. The right choice depends on the granularity and timing requirements of your use case:
Property |
Dispatch PMC |
Device counter collection |
SPM |
|---|---|---|---|
Granularity |
One accumulated value per kernel |
Accumulated over a configurable epoch |
One value per hardware sampling interval |
Timing |
Bounded to dispatch start/end |
User-controlled flush |
Continuous, independent of dispatches |
Kernel serialization required |
Yes |
No |
No |
Concurrent workload support |
No |
Partial |
Yes |
Use case |
Identify expensive kernels; measure peak utilization |
GPU-wide utilization over a time window |
Time-series monitoring, DCGM-style telemetry, overlapping kernels |
SPM captures how hardware resources are utilized over time. This is distinct from PC sampling, which reconstructs an execution histogram from program counter snapshots, and from ATT counter streaming (--att-perfcounters), which embeds SQ-block counter values into the thread trace ring buffer and requires ATT to be active. SPM operates as an independent hardware path.
CLI options#
Use --spm-beta-enabled and --spm <COUNTERS> to enable and configure SPM collection with rocprofv3, or rocprofv3-avail list --spm / list --spm-config to query SPM support per agent. For the full option reference, see CLI options.
Counter listing output includes an SPM column (Supported / Not Supported) alongside each counter’s name, description, and dimensions.
SPM records are written to all output backends: JSON, CSV, rocpd (SQLite3), and stats. Each rocprofiler_spm_counter_record_t includes a ROCPROFILER_SPM_RECORD_FLAG_DISPATCH_END flag that marks dispatch-boundary sentinel records, which carry no counter data.
For full usage details, see Using SPM.
Supported hardware#
Hardware support varies by GPU architecture, firmware version, ROCm release, and feature-gate state. To verify capability on your system, run rocprofv3 -L or rocprofv3-avail. For per-feature hardware support tables, see Hardware support and Hardware support.
Note
Counter collection: On gfx11 and gfx12 architectures (AMD Radeon RX 7000 series and later), counter collection requires a stable power state. Use amd-smi to set the power state before profiling.
Dependencies#
The following table lists the components that ROCprofiler-SDK depends on and their roles.
Component |
Role |
|---|---|
|
Generates PM4/AQL packets for counter collection and thread trace; bundled as a static library inside the SDK |
|
Coordinates intercept table modification across multiple tool libraries |
ROCm runtime (HIP + HSA) |
Provides API interception points |
KFD kernel driver |
Provides hardware access for PC sampling and counter collection |
rocprofv3 — command-line profiling interface#
rocprofv3 is the official CLI for ROCprofiler-SDK. Run your application under rocprofv3 and it produces structured output files with trace data, counter values, or PC samples, without requiring source code changes or recompilation.
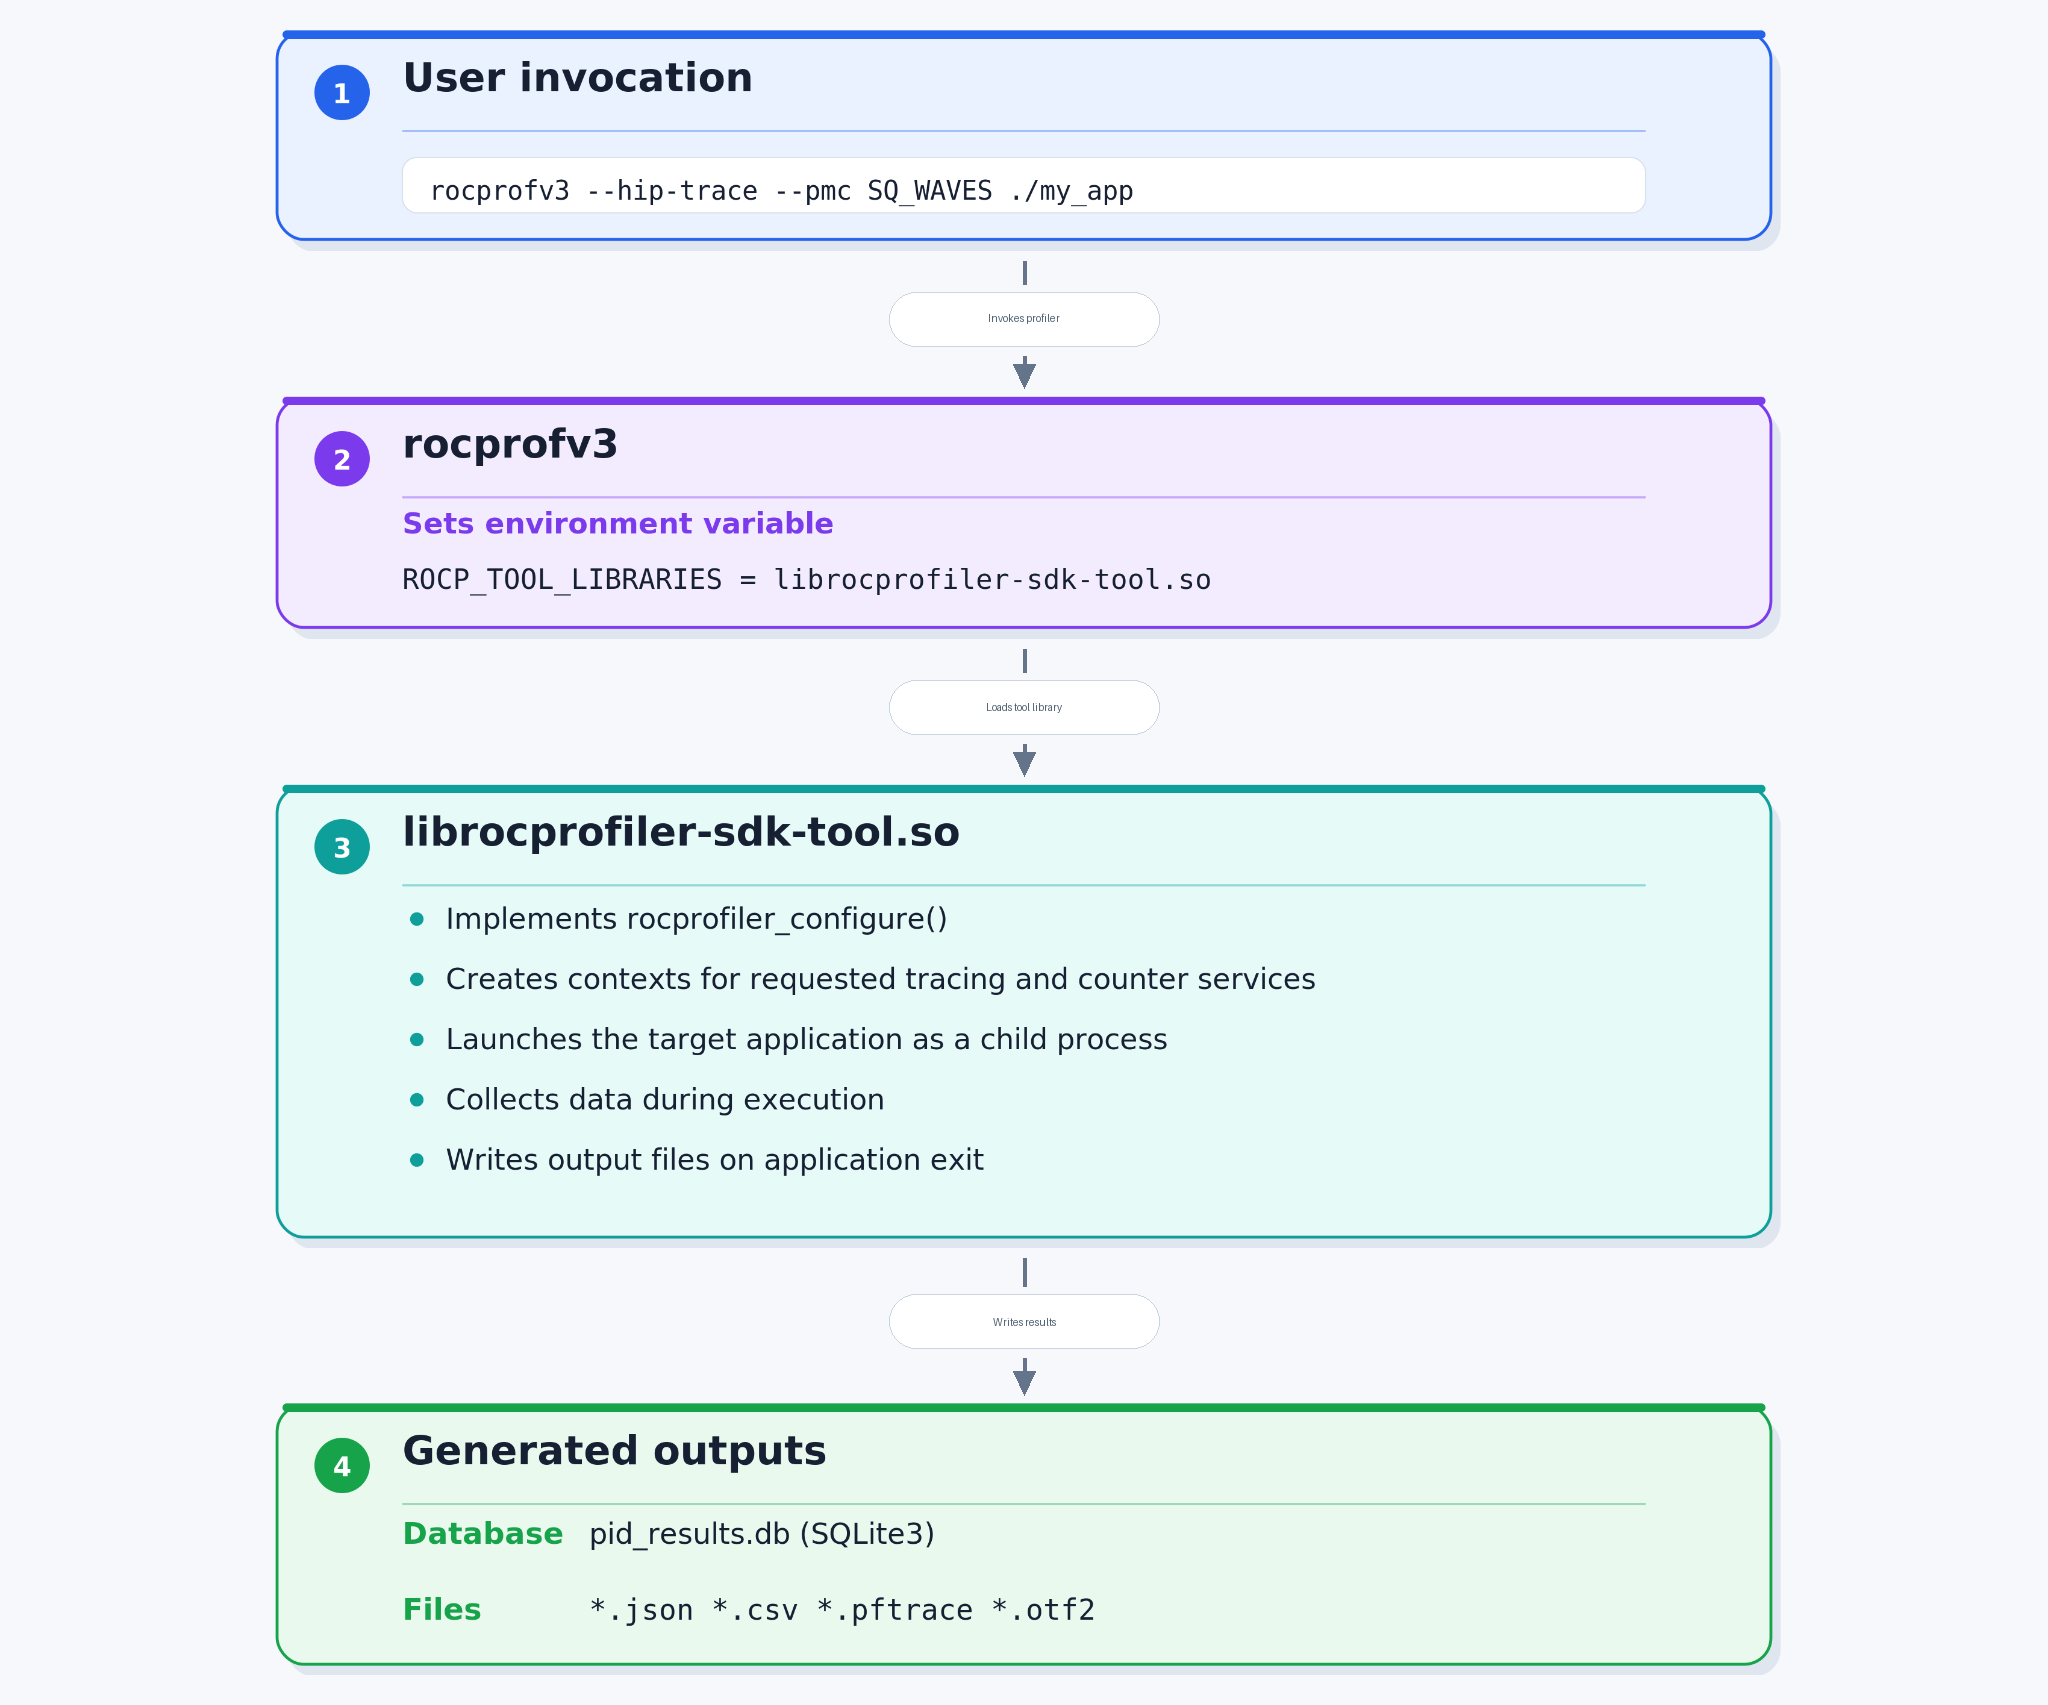
Internally, rocprofv3 sets ROCP_TOOL_LIBRARIES to load librocprofiler-sdk-tool.so, a tool library built on ROCprofiler-SDK. Note that rocprofiler-compute uses ROCprofiler-SDK directly through its own tool library (librocprofiler-compute-tool.so) and doesn’t route through rocprofv3. Similarly, rocprofiler-systems uses ROCprofiler-SDK directly.
A companion tool, rocprofv3-avail, lists all available hardware performance counters, derived metrics, and supported architectures for the installed GPUs.
How it works#
The following figure shows how rocprofv3 loads the tool library, creates profiling contexts, and writes output files after the application exits.
Key CLI options#
The following tables summarize the key rocprofv3 options by category. For the complete CLI reference, see roprofv3 command-line options.
Tracing#
Use these options to collect API and activity traces from the GPU runtime: --sys-trace (full system trace), --hip-trace, --hsa-trace, --kernel-trace, and --rccl-trace. For full descriptions and usage, see Aggregate tracing and Basic tracing in the CLI options reference.
Counter collection#
Use --pmc to collect hardware performance counters. Specify multiple --pmc flags to collect more counters across multiple passes.
For the full option description and usage, see Counter collection in the CLI options reference.
PC sampling (beta)#
For PC sampling CLI options, see PC sampling CLI options.
Thread Trace (ATT)#
For ATT CLI options, see ATT CLI options.
SPM (beta)#
For SPM CLI options, see SPM CLI options.
Process attachment#
Process attachment lets you begin profiling an already-running process, instead of launching it under rocprofv3 from the start, using -p/--pid/--attach. For the full option description, see Dynamic process attachment in the CLI options reference; for prerequisites and a full walkthrough, see Dynamic process attachment using rocprofv3.
Output format options#
The --output-format option lets you specify one or more output formats in a single run. The default output format is rocpd (SQLite3).
For the full description of --output-format, --output-file, and related I/O options, see I/O options in the CLI options reference.
Supported output formats#
The following table describes the supported output formats, their file extensions, and the tools that can open them.
Format |
File extension |
Description |
Viewer |
|---|---|---|---|
rocpd (default) |
|
SQLite3 database containing all trace and counter data; queryable with SQL or convertible using |
SQLite browser, custom scripts |
JSON |
|
Structured JSON records |
Any JSON viewer, custom scripts |
CSV |
|
Flat tabular data for scripted analysis |
Spreadsheet, pandas, R |
PFTrace (Perfetto) |
|
Perfetto protobuf format for interactive timeline visualization |
|
OTF2 |
|
Open Trace Format 2 for HPC trace analysis |
Vampir, Score-P, Cube |
For comprehensive documentation, see Using rocpd output format.