rocprofv3 advanced options#
rocprofv3 provides the following miscellaneous functionalities for improved control and flexibility.
Minimum output data threshold#
The --minimum-output-data option allows you to control the generation of output files by setting a minimum data size threshold. This prevents the creation of empty or very small output files that contain no meaningful profiling data.
When this option is specified, rocprofv3 only generates output files if the collected data size exceeds the specified threshold. This is particularly useful in scenarios where:
You’re profiling applications that may have sporadic GPU activity
You want to avoid processing empty trace files in automated workflows
You’re running batch jobs and only want meaningful results
To specify the minimum output data threshold, use the --minimum-output-data option followed by the size in KB:
rocprofv3 --minimum-output-data 100 --hip-trace --output-format csv -- <application_path>
The preceding command only generates output files if the HIP trace data is larger than 100 KB.
Example scenarios:
Scenario 1: Filtering out applications with minimal GPU activity
# Only generate output if kernel trace data > 50 KB
rocprofv3 --minimum-output-data 50 --kernel-trace --output-format csv -- <application_path>
Scenario 2: Batch profiling with meaningful data collection
# For system tracing, only output files if data > 1 MB
rocprofv3 --minimum-output-data 1024 --sys-trace --output-format pftrace -- <application_path>
Using with input files:
You can also specify this option in YAML or JSON input files:
jobs:
  - hip_trace: true
    kernel_trace: true
    minimum_output_data: 100
    output_format: ["csv", "json"]
    output_directory: "filtered_results"
{
  "jobs": [
    {
      "hip_trace": true,
      "kernel_trace": true,
      "minimum_output_data": 100,
      "output_format": ["csv", "json"],
      "output_directory": "filtered_results"
    }
  ]
}
Important notes:
The threshold applies to the raw profiling data size, not the final output file size
If multiple output formats are specified, the threshold check applies to each format independently
A value of 0 (default) means all output files are generated regardless of size
This option works with all tracing and counter collection modes
This feature is especially valuable in automated testing environments where you want to ensure that only applications with meaningful GPU activity generate profiling outputs, reducing storage overhead and simplifying result analysis.
Signal handler control#
The --disable-signal-handlers option provides control over signal handling behavior in rocprofv3, allowing you to manage how the profiler responds to system signals like SIGSEGV, SIGTERM, and others.
By default, rocprofv3 installs its own signal handlers to ensure proper cleanup and data collection when the application encounters errors or is terminated. However, in some scenarios, you may want the application’s own signal handlers to take precedence.
When --disable-signal-handlers is set to true, rocprofv3 disables the prioritization of its signal handlers over application-installed signal handlers. This means:
If your application has custom signal handlers for SIGSEGV, SIGTERM, or similar signals, those handlers will be executed instead of
rocprofv3’s handlersThe application maintains full control over signal handling behavior
rocprofv3will still attempt to collect and save profiling data when possible
Important note: Even with this option enabled, the underlying glog library may still install signal handlers that provide stack backtraces for debugging purposes.
Basic usage:
rocprofv3 --disable-signal-handlers --hip-trace --output-format csv -- <application_path>
The preceding command disables rocprofv3 signal handler prioritization, allowing the application’s signal handlers to take precedence.
Example scenarios:
Scenario 1: Application with custom crash handling
# For applications that implement custom crash reporting or recovery
rocprofv3 --disable-signal-handlers --sys-trace --output-format pftrace -- ./my_app_with_custom_handlers
Scenario 2: Debugging applications with existing signal handlers
# When debugging applications that rely on specific signal handling behavior
rocprofv3 --disable-signal-handlers --kernel-trace --pmc SQ_WAVES -- ./debug_application
Scenario 3: Integration with testing frameworks
# For test frameworks that need to handle signals for test orchestration
rocprofv3 --disable-signal-handlers --runtime-trace --output-directory test_results -- ./test_suite
Using with input files:
You can also specify this option in YAML or JSON input files:
jobs:
  - hip_trace: true
    kernel_trace: true
    disable_signal_handlers: true
    output_format: ["csv", "json"]
    output_directory: "custom_signal_handling"
{
  "jobs": [
    {
      "hip_trace": true,
      "kernel_trace": true,
      "disable_signal_handlers": true,
      "output_format": ["csv", "json"],
      "output_directory": "custom_signal_handling"
    }
  ]
}
Use this option when:
Your application has custom signal handlers that must execute
You’re integrating with testing frameworks that manage signals
Debugging applications where signal handling behavior is critical
Working with applications that implement custom crash reporting
Avoid this option when:
You want
rocprofv3to provide maximum protection against data lossYour application doesn’t have custom signal handlers
You’re doing standard profiling where signal handling isn’t a concern
Example: Application with a custom segmentation fault (SIGSEGV) handler
#include <signal.h>
#include <stdio.h>

void custom_sigsegv_handler(int sig) {
    printf("Custom SIGSEGV handler called\n");
    // Custom crash reporting logic
    exit(1);
}

int main() {
    signal(SIGSEGV, custom_sigsegv_handler);

    // Application code that might trigger SIGSEGV
    return 0;
}
Use --disable-signal-handlers to ensure your custom handler executes:
rocprofv3 --disable-signal-handlers --hip-trace -- ./app_with_custom_handler
Troubleshooting:
If profiling data appears incomplete with this option enabled, check if your application’s signal handlers are properly saving or flushing data
Consider implementing explicit
rocprofv3cleanup calls in your application’s signal handlers if data integrity is importantMonitor application behavior to ensure custom signal handling doesn’t interfere with profiling data collection
This option provides the flexibility needed for complex applications and testing environments while maintaining rocprofv3’s core profiling functionality.
Library preloading#
The --preload option allows you to specify additional libraries to prepend to the LD_PRELOAD environment variable. This is particularly useful when working with sanitizer libraries, debugging tools, or other instrumentation libraries that need to be loaded before the application starts.
LD_PRELOAD is a powerful mechanism in Linux that allows you to load shared libraries before any other libraries, effectively intercepting and overriding function calls. The --preload option in rocprofv3 provides a convenient way to manage this without manually setting environment variables.
Basic usage:
rocprofv3 --preload /path/to/library.so --hip-trace --output-format csv -- <application_path>
The preceding command preloads the specified library and enables HIP tracing.
Example scenarios:
Scenario 1: Using AddressSanitizer (ASan)
# Preload AddressSanitizer for memory error detection
rocprofv3 --preload /usr/lib/x86_64-linux-gnu/libasan.so.5 --sys-trace -- ./my_application
Scenario 2: Using ThreadSanitizer (TSan)
# Preload ThreadSanitizer for race condition detection
rocprofv3 --preload /usr/lib/x86_64-linux-gnu/libtsan.so.0 --kernel-trace --pmc SQ_WAVES -- ./threaded_app
Scenario 3: Multiple preloaded libraries
# Preload multiple libraries (custom profiler and sanitizer)
rocprofv3 --preload /opt/custom/libprofiler.so /usr/lib/libasan.so --runtime-trace -- ./complex_app
Scenario 4: Using MemorySanitizer (MSan)
# Preload MemorySanitizer for uninitialized memory detection
rocprofv3 --preload /usr/lib/x86_64-linux-gnu/libmsan.so.0 --hip-trace -- ./memory_intensive_app
Using with input files:
You can also specify this option in YAML or JSON input files:
jobs:
  - hip_trace: true
    kernel_trace: true
    preload:
      - "/usr/lib/x86_64-linux-gnu/libasan.so.5"
      - "/opt/custom/libprofiler.so"
    output_format: ["csv"]
{
  "jobs": [
    {
      "hip_trace": true,
      "kernel_trace": true,
      "preload": [
        "/usr/lib/x86_64-linux-gnu/libasan.so.5",
        "/opt/custom/libprofiler.so"
      ],
      "output_format": ["csv"]
    }
  ]
}
Common use cases:
Sanitizer libraries:
- AddressSanitizer (libasan.so) for memory error detection
- ThreadSanitizer (libtsan.so) for race condition detection
- MemorySanitizer (libmsan.so) for uninitialized memory detection
- UndefinedBehaviorSanitizer (libubsan.so) for undefined behavior detection
Debugging and profiling tools:
- Custom memory allocators (jemalloc, tcmalloc)
- Performance profiling libraries
- Custom instrumentation libraries
- Mock libraries for testing
Third-party analysis tools: - Valgrind replacement libraries - Custom logging frameworks - Security analysis tools
Library order considerations:
The order of libraries in --preload matters as they are processed in the order specified:
# Library1 will be loaded before Library2
rocprofv3 --preload /path/to/library1.so /path/to/library2.so --hip-trace -- ./app
Environment variable interaction:
The --preload option works alongside existing LD_PRELOAD settings:
# If LD_PRELOAD is already set, --preload libraries are prepended
export LD_PRELOAD="/existing/library.so"
rocprofv3 --preload /new/library.so --hip-trace -- ./app
# Effective LD_PRELOAD: "/new/library.so:/existing/library.so"
Troubleshooting:
Library not found: Ensure the library path is correct and the library exists
Symbol conflicts: Check for conflicting symbols between preloaded libraries
Performance impact: Sanitizers can significantly slow down execution
Memory usage: Some tools like AddressSanitizer increase memory consumption substantially
ROCm root path configuration#
The --rocm-root option allows you to specify a custom ROCm installation directory instead of using the default relative path detection. This is useful when working with multiple ROCm installations, custom builds, or non-standard installation locations.
By default, rocprofv3 automatically detects the ROCm installation path relative to its own location. However, in some environments, you may need to explicitly specify which ROCm installation to use.
Basic usage:
rocprofv3 --rocm-root /opt/custom-rocm --hip-trace --output-format csv -- <application_path>
The preceding command uses the ROCm installation located at /opt/custom-rocm.
Example scenarios:
Scenario 1: Multiple ROCm versions
# Use ROCm 5.7.0 specifically
rocprofv3 --rocm-root /opt/rocm-5.7.0 --sys-trace -- ./app_for_rocm_5_7

# Use ROCm 6.0.0 for comparison
rocprofv3 --rocm-root /opt/rocm-6.0.0 --sys-trace -- ./app_for_rocm_6_0
Scenario 2: Custom ROCm build
# Use custom ROCm build with debugging symbols
rocprofv3 --rocm-root /home/developer/rocm-debug-build --kernel-trace --pmc SQ_WAVES -- ./debug_app
Scenario 3: Development environment
# Use locally built ROCm for development
rocprofv3 --rocm-root /workspace/rocm-dev --runtime-trace -- ./test_application
Scenario 4: Container environments
# Use ROCm mounted at custom location in container
rocprofv3 --rocm-root /usr/local/rocm --hip-trace -- ./containerized_app
Directory structure requirements:
The specified ROCm root path should contain the standard ROCm directory structure:
/opt/custom-rocm/
├── bin/           # ROCm executables
├── lib/           # ROCm libraries
├── include/       # ROCm headers
├── share/         # Shared resources
└── ...
Using with input files:
This option is typically used from the command line, but can be specified in wrapper scripts:
#!/bin/bash
# profile_with_custom_rocm.sh
ROCM_PATH="/opt/rocm-custom"
rocprofv3 --rocm-root "$ROCM_PATH" -i input.yaml -- "$@"
Environment variable interaction:
The --rocm-root option overrides automatic path detection and environment variables like ROCM_PATH:
# --rocm-root takes precedence over environment variables
export ROCM_PATH="/opt/rocm-default"
rocprofv3 --rocm-root /opt/rocm-override --hip-trace -- ./app
# Uses /opt/rocm-override, not /opt/rocm-default
Validation and troubleshooting:
Path validation: Ensure the specified path contains a valid ROCm installation
Library compatibility: Verify that the ROCm version is compatible with your application
Permission issues: Check read permissions for the ROCm directory
Path format: Use absolute paths to avoid ambiguity
SDK version specification#
The --sdk-version option allows you to specify the exact version number for the ROCProfiler SDK library resolution. This provides the finest level of control over library selection, useful for testing specific versions, development workflows, or ensuring reproducible profiling environments.
This option helps resolve library paths for version-specific libraries like librocprofiler-sdk.so.X.Y.Z where X.Y.Z represents the full semantic version.
Basic usage:
rocprofv3 --sdk-version 1.2.3 --hip-trace --output-format csv -- <application_path>
The preceding command uses librocprofiler-sdk.so.1.2.3 if available.
Example scenarios:
Scenario 1: Exact version testing
# Test with specific patch version for bug verification
rocprofv3 --sdk-version 2.1.5 --kernel-trace -- ./bug_reproduction_case

# Test with fixed version
rocprofv3 --sdk-version 2.1.6 --kernel-trace -- ./bug_verification_case
Scenario 2: Reproducible profiling
# Ensure exact same SDK version for reproducible results
rocprofv3 --sdk-version 2.2.1 --pmc SQ_WAVES GRBM_COUNT --output-format pftrace -- ./benchmark_app
Version format support:
The option supports various version formats:
Semantic versioning:
1.2.3,2.0.0,1.5.10
Library resolution priority:
When --sdk-version is specified, the library resolution follows this order:
librocprofiler-sdk.so.X.Y.Z(exact version match)librocprofiler-sdk.so.X.Y(major.minor match)librocprofiler-sdk.so.X(major version match)Default library (
librocprofiler-sdk.so)
Using with input files:
While typically used from command line, it can be scripted:
#!/bin/bash
# version_matrix_test.sh
VERSIONS=("2.1.0" "2.1.1" "2.1.2" "2.2.0")

for version in "${VERSIONS[@]}"; do
    echo "Testing SDK version $version"
    rocprofv3 --sdk-version "$version" --hip-trace --output-directory "results_$version" -- ./test_app
done
Combined with other version options:
# Combine with soversion for maximum control
rocprofv3 --sdk-version 2.1.5 --sdk-soversion 2 --hip-trace -- ./app

# Combine with custom ROCm root
rocprofv3 --rocm-root /opt/rocm-6.0 --sdk-version 2.2.0 --sys-trace -- ./app
Agent index#
The agent index is a unique identifier for each agent in the system. It is used to identify the agent in the output files. Since, each runtime or tool has an independent representation of the agent’s indices, rocprofv3 provides an option to configure the agent index in the output files.
absolute == node_id: Absolute index of the agent, regardless of cgroups masking. This is a monotonically increasing number, which is incremented for every folder in
/sys/class/kfd/kfd/topology/nodes. For example, Agent-0, Agent-2, Agent-4.relative == logical_node_id: Relative index of the agent accounting for cgroups masking. This is a monotonically increasing number, which is incremented for every folder in
/sys/class/kfd/kfd/topology/nodes/, whose properties file is non-empty. For example, Agent-0, Agent-1, Agent-2.type-relative == logical_node_type_id: Relative index of the agent accounting for cgroups masking, where indexing starts at zero for each agent type. For example, CPU-0, GPU-0, GPU-1.
To set the agent index in the output files, use the --agent-index or -A {absolute,relative,type-relative} option. The default value is relative.
The following example shows how to set the agent index on a system with multiple GPUs and CPUs:
Here is the rocm-smi output:
============================================ ROCm System Management Interface ============================================
====================================================== Concise Info ======================================================
Device  Node  IDs              Temp        Power     Partitions          SCLK    MCLK     Fan  Perf  PwrCap  VRAM%  GPU%
        (DID,     GUID)  (Junction)  (Socket)  (Mem, Compute, ID)
==========================================================================================================================
0       4     0x74a0,   50375  48.0°C      110.0W    NPS1, SPX, 0        98Mhz   1300Mhz  0%   auto  550.0W  0%     0%
1       5     0x74a0,   20890  53.0°C      113.0W    NPS1, SPX, 0        99Mhz   1200Mhz  0%   auto  550.0W  0%     0%
2       6     0x74a0,   44670  52.0°C      125.0W    NPS1, SPX, 0        100Mhz  1300Mhz  0%   auto  550.0W  0%     0%
3       7     0x74a0,   15139  47.0°C      115.0W    NPS1, SPX, 0        100Mhz  1300Mhz  0%   auto  550.0W  0%     0%
==========================================================================================================================
================================================== End of ROCm SMI Log ===================================================
To set the agent index to relative, use:
rocprofv3 --kernel-trace --agent-index=relative --output-format csv -- <application_path>
Here is the generated output file with Agent_Id as “Agent 7”:
$ cat kernel_trace.csv

"Kind","Agent_Id","Queue_Id","Stream_Id","Thread_Id","Dispatch_Id","Kernel_Id","Kernel_Name","Correlation_Id","Start_Timestamp","End_Timestamp","LDS_Block_Size","Scratch_Size","VGPR_Count","Accum_VGPR_Count","SGPR_Count","Workgroup_Size_X","Workgroup_Size_Y","Workgroup_Size_Z","Grid_Size_X","Grid_Size_Y","Grid_Size_Z"
"KERNEL_DISPATCH","Agent 7",17,26,847809,101,49,"void addition_kernel<float>(float*, float const*, float const*, int, int)",101,1551401624448706,1551401624459226,0,0,8,0,16,64,1,1,1024,1024,1
To set the agent index to type-relative, use:
rocprofv3 --kernel-trace --agent-index=type-relative --output-format csv -- <application_path>
Here is the generated output file with Agent_Id as “GPU 3”:
$ cat kernel_trace.csv

"Kind","Agent_Id","Queue_Id","Stream_Id","Thread_Id","Dispatch_Id","Kernel_Id","Kernel_Name","Correlation_Id","Start_Timestamp","End_Timestamp","LDS_Block_Size","Scratch_Size","VGPR_Count","Accum_VGPR_Count","SGPR_Count","Workgroup_Size_X","Workgroup_Size_Y","Workgroup_Size_Z","Grid_Size_X","Grid_Size_Y","Grid_Size_Z"
"KERNEL_DISPATCH","GPU 3",19,29,846827,113,49,"void addition_kernel<float>(float*, float const*, float const*, int, int)",113,1551314943082302,1551314943092222,0,0,8,0,16,64,1,1,1024,1024,1
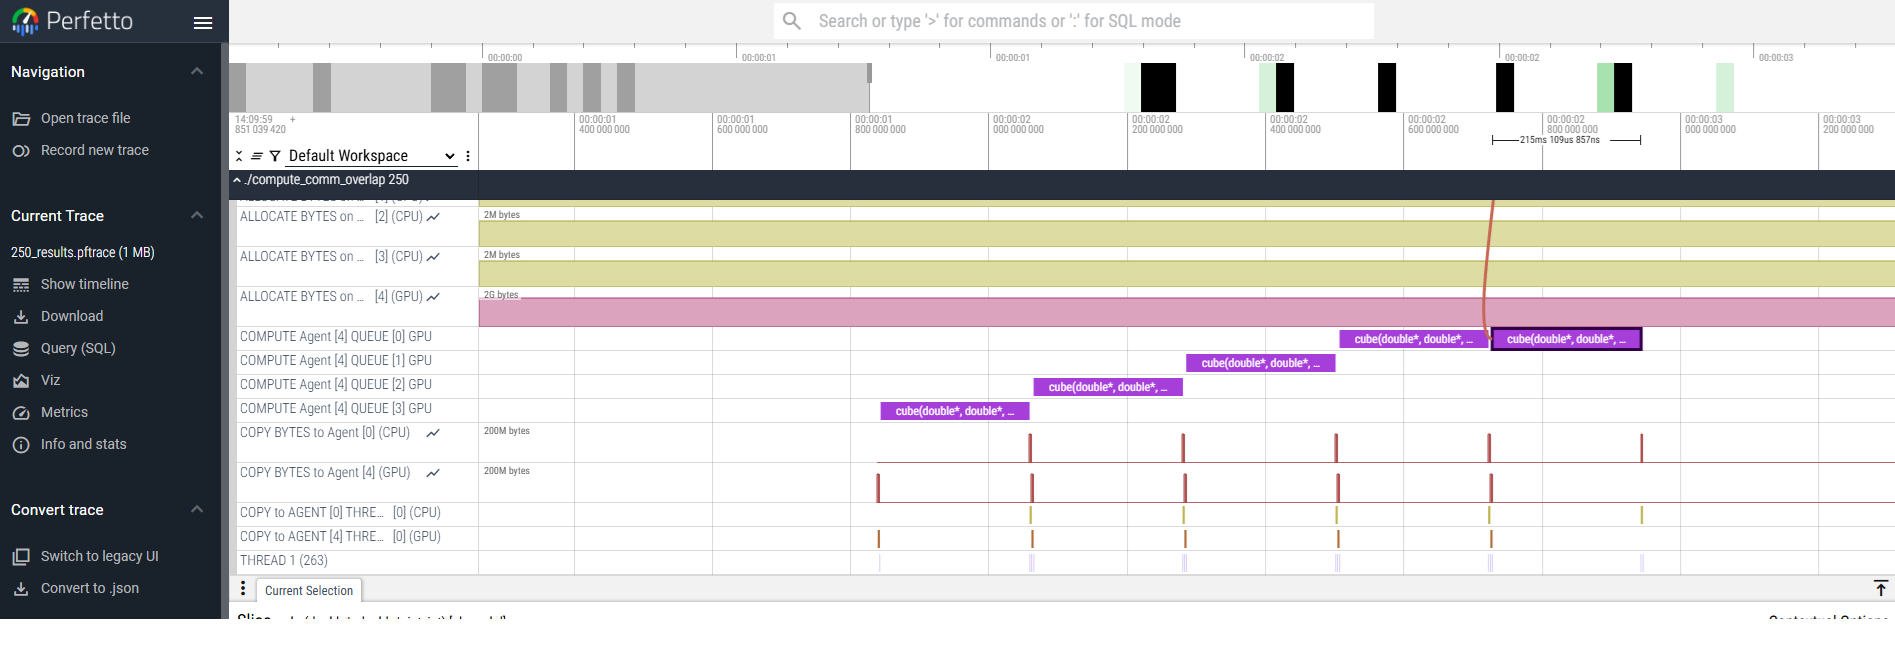
Group by queue#
By default, rocprofv3 shows the HIP streams to which the kernel and memory copy operations were submitted, when outputting a perfetto trace. Whereas, the --group-by-queue option displays the HSA queues to which these kernel and memory operations were submitted.
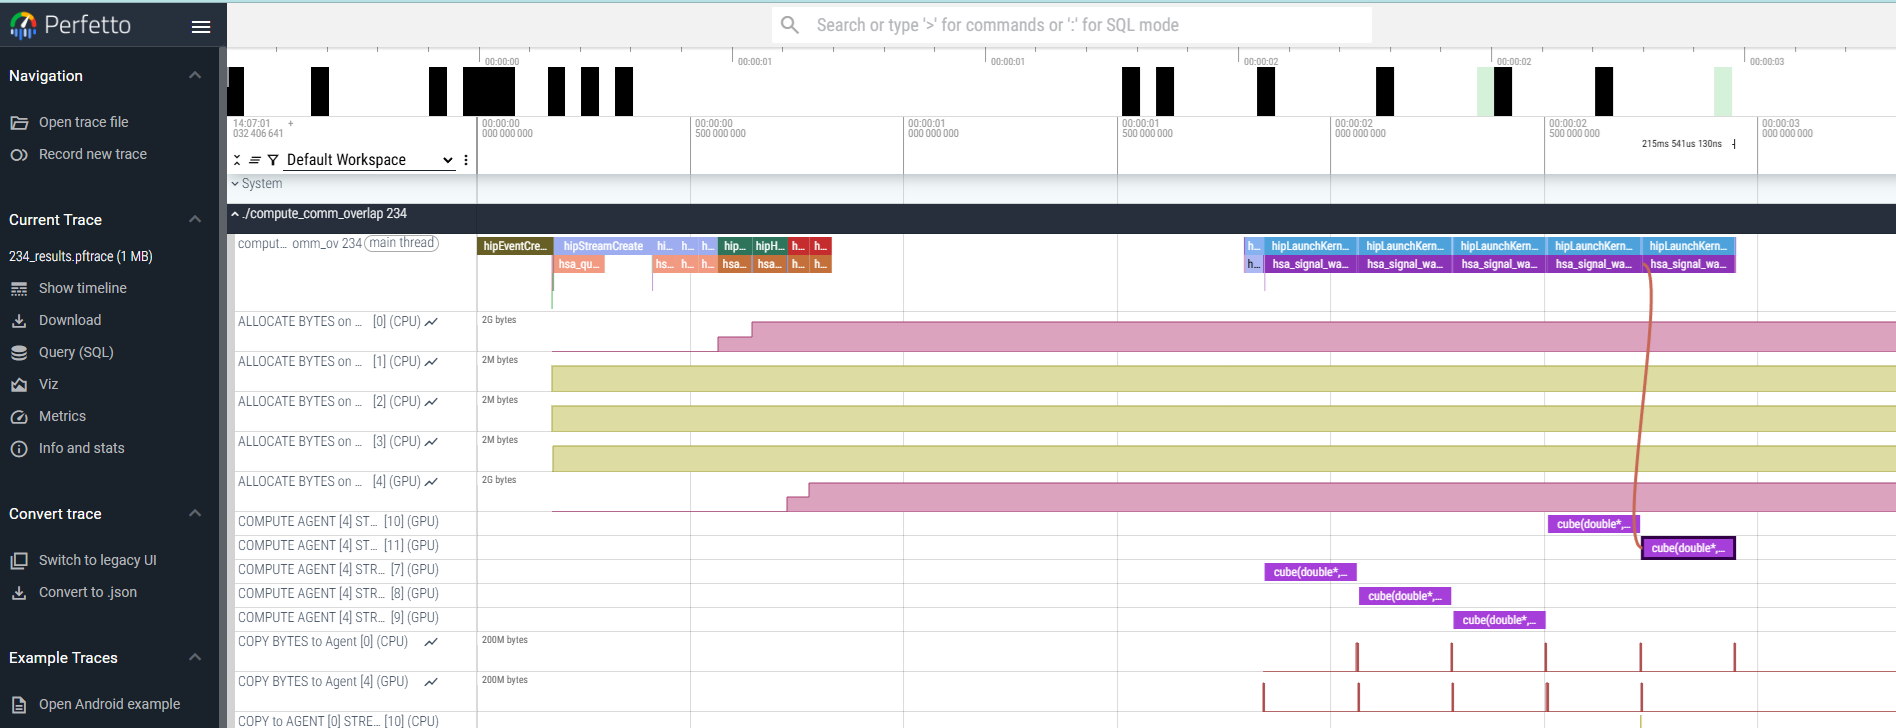
rocprofv3 -s --group-by-queue --output-format pftrace -- <application_path>
The preceding command generates a pftrace file with the kernel and memory copy operations grouped into HSA queues instead of HIP streams.