Profile mode#
The following chapter walks you through ROCm Compute Profiler’s core profiling features by example.
Learn about analysis with ROCm Compute Profiler in Analyze mode. For an overview of ROCm Compute Profiler’s other modes, see Modes.
Profiling#
Use the rocprof-compute executable to acquire all necessary performance monitoring
data through analysis of compute workloads.
Profiling with ROCm Compute Profiler yields the following benefits.
Automate counter collection: ROCm Compute Profiler handles all of your profiling via pre-configured input files.
Profiling output format: ROCm Compute Profile can adjust the output format of underlying rocprof tool which changes the output format of raw performance counter data in the workload folder created during profiling. Supported output formats are
json,csv, androcpd. The default output format iscsv.
Note
The default output format will be changed to rocpd in a future release of ROCm Compute Profiler.
Filtering: Apply runtime filters to speed up the profiling process.
Standalone roofline: Isolate a subset of built-in metrics or build your own profiling configuration.
Run rocprof-compute profile -h for more details. See
Basic usage.
Profiling example#
The ROCm/rocprofiler-compute repository
includes source code for a sample GPU compute workload, vcopy.cpp. A copy of
this file is available in the share/sample subdirectory after a normal
ROCm Compute Profiler installation, or via the $ROCPROFCOMPUTE_SHARE/sample directory when
using the supplied modulefile.
The examples in this section use a compiled version of the vcopy workload to
demonstrate the use of ROCm Compute Profiler in MI accelerator performance analysis. Unless
otherwise noted, the performance analysis is done on the
MI200 platform.
Workload compilation#
The following example demonstrates compilation of vcopy.
$ hipcc vcopy.cpp -o vcopy
$ ls
vcopy   vcopy.cpp
$ ./vcopy -n 1048576 -b 256
vcopy testing on GCD 0
Finished allocating vectors on the CPU
Finished allocating vectors on the GPU
Finished copying vectors to the GPU
sw thinks it moved 1.000000 KB per wave
Total threads: 1048576, Grid Size: 4096 block Size:256, Wavefronts:16384:
Launching the  kernel on the GPU
Finished executing kernel
Finished copying the output vector from the GPU to the CPU
Releasing GPU memory
Releasing CPU memory
The following sample command profiles the vcopy workload.
 $ rocprof-compute profile --name vcopy -- ./vcopy -n 1048576 -b 256

                                  __                                       _
  _ __ ___   ___ _ __  _ __ ___  / _|       ___ ___  _ __ ___  _ __  _   _| |_ ___
 | '__/ _ \ / __| '_ \| '__/ _ \| |_ _____ / __/ _ \| '_ ` _ \| '_ \| | | | __/ _ \
 | | | (_) | (__| |_) | | | (_) |  _|_____| (_| (_) | | | | | | |_) | |_| | ||  __/
 |_|  \___/ \___| .__/|_|  \___/|_|        \___\___/|_| |_| |_| .__/ \__,_|\__\___|
                |_|                                           |_|

 rocprofiler-compute version: 2.0.0
 Profiler choice: rocprofv1
 Path: /home/auser/repos/rocprofiler-compute/sample/workloads/vcopy/MI200
 Target: MI200
 Command: ./vcopy -n 1048576 -b 256
 Kernel Selection: None
 Dispatch Selection: None
 Hardware Blocks: All

 ~~~~~~~~~~~~~~~~~~~~~~~~~~~~~~~~
 Collecting Performance Counters
 ~~~~~~~~~~~~~~~~~~~~~~~~~~~~~~~~

 [profiling] Current input file: /home/auser/repos/rocprofiler-compute/sample/workloads/vcopy/MI200/perfmon/SQ_IFETCH_LEVEL.txt
    |-> [rocprof] RPL: on '240312_174329' from '/opt/rocm-5.2.1' in '/home/auser/repos/rocprofiler-compute/src/rocprof-compute'
    |-> [rocprof] RPL: profiling '""./vcopy -n 1048576 -b 256""'
    |-> [rocprof] RPL: input file '/home/auser/repos/rocprofiler-compute/sample/workloads/vcopy/MI200/perfmon/SQ_IFETCH_LEVEL.txt'
    |-> [rocprof] RPL: output dir '/tmp/rpl_data_240312_174329_692890'
    |-> [rocprof] RPL: result dir '/tmp/rpl_data_240312_174329_692890/input0_results_240312_174329'
    |-> [rocprof] ROCProfiler: input from "/tmp/rpl_data_240312_174329_692890/input0.xml"
    |-> [rocprof] gpu_index =
    |-> [rocprof] kernel =
    |-> [rocprof] range =
    |-> [rocprof] 6 metrics
    |-> [rocprof] GRBM_COUNT, GRBM_GUI_ACTIVE, SQ_WAVES, SQ_IFETCH, SQ_IFETCH_LEVEL, SQ_ACCUM_PREV_HIRES
    |-> [rocprof] vcopy testing on GCD 0
    |-> [rocprof] Finished allocating vectors on the CPU
    |-> [rocprof] Finished allocating vectors on the GPU
    |-> [rocprof] Finished copying vectors to the GPU
    |-> [rocprof] sw thinks it moved 1.000000 KB per wave
    |-> [rocprof] Total threads: 1048576, Grid Size: 4096 block Size:256, Wavefronts:16384:
    |-> [rocprof] Launching the  kernel on the GPU
    |-> [rocprof] Finished executing kernel
    |-> [rocprof] Finished copying the output vector from the GPU to the CPU
    |-> [rocprof] Releasing GPU memory
    |-> [rocprof] Releasing CPU memory
    |-> [rocprof]
   |-> [rocprof] ROCPRofiler: 1 contexts collected, output directory /tmp/rpl_data_240312_174329_692890/input0_results_240312_174329
     |-> [rocprof] File '/home/auser/repos/rocprofiler-compute/sample/workloads/vcopy/MI200/SQ_IFETCH_LEVEL.csv' is generating
    |-> [rocprof]
 [profiling] Current input file: /home/auser/repos/rocprofiler-compute/sample/workloads/vcopy/MI200/perfmon/SQ_INST_LEVEL_LDS.txt

 ...

 [roofline] Checking for roofline.csv in /home/auser/repos/rocprofiler-compute/sample/workloads/vcopy/MI200
 [roofline] No roofline data found. Generating...
 Empirical Roofline Calculation
 Copyright © 2022  Advanced Micro Devices, Inc. All rights reserved.
 Total detected GPU devices: 4
 GPU Device 0: Profiling...
  99% [||||||||||||||||||||||||||||||||||||||||||||||||||||||||||| ]
HBM BW, GPU ID: 0, workgroupSize:256, workgroups:2097152, experiments:100, traffic:8589934592 bytes, duration:6.2 ms, mean:1388.0 GB/sec, stdev=3.1 GB/sec
   99% [||||||||||||||||||||||||||||||||||||||||||||||||||||||||||| ]
L2 BW, GPU ID: 0, workgroupSize:256, workgroups:8192, experiments:100, traffic:687194767360 bytes, duration:136.5 ms, mean:5020.8 GB/sec, stdev=16.5 GB/sec
   99% [||||||||||||||||||||||||||||||||||||||||||||||||||||||||||| ]
L1 BW, GPU ID: 0, workgroupSize:256, workgroups:16384, experiments:100, traffic:26843545600 bytes, duration:2.9 ms, mean:9229.5 GB/sec, stdev=2.9 GB/sec
   99% [||||||||||||||||||||||||||||||||||||||||||||||||||||||||||| ]
 LDS BW, GPU ID: 0, workgroupSize:256, workgroups:16384, experiments:100, traffic:33554432000 bytes, duration:1.9 ms, mean:17645.6 GB/sec, stdev=20.1 GB/sec
  99% [||||||||||||||||||||||||||||||||||||||||||||||||||||||||||| ]
 Peak FLOPs (FP32), GPU ID: 0, workgroupSize:256, workgroups:16384, experiments:100, FLOP:274877906944, duration:13.078 ms, mean:20986.9 GFLOPS, stdev=310.8 GFLOPS
  99% [||||||||||||||||||||||||||||||||||||||||||||||||||||||||||| ]
 Peak FLOPs (FP64), GPU ID: 0, workgroupSize:256, workgroups:16384, experiments:100, FLOP:137438953472, duration:6.7 ms, mean:20408.029297.1 GFLOPS, stdev=2.7 GFLOPS
  99% [||||||||||||||||||||||||||||||||||||||||||||||||||||||||||| ]
 Peak MFMA FLOPs (BF16), GPU ID: 0, workgroupSize:256, workgroups:16384, experiments:100, FLOP:2147483648000, duration:12.6 ms, mean:170280.0 GFLOPS, stdev=22.3 GFLOPS
  99% [||||||||||||||||||||||||||||||||||||||||||||||||||||||||||| ]
 Peak MFMA FLOPs (F16), GPU ID: 0, workgroupSize:256, workgroups:16384, experiments:100, FLOP:2147483648000, duration:13.0 ms, mean:164733.6 GFLOPS, stdev=24.3 GFLOPS
  99% [||||||||||||||||||||||||||||||||||||||||||||||||||||||||||| ]
 Peak MFMA FLOPs (F32), GPU ID: 0, workgroupSize:256, workgroups:16384, experiments:100, FLOP:536870912000, duration:13.0 ms, mean:41399.6 GFLOPS, stdev=4.1 GFLOPS
  99% [||||||||||||||||||||||||||||||||||||||||||||||||||||||||||| ]
 Peak MFMA FLOPs (F64), GPU ID: 0, workgroupSize:256, workgroups:16384, experiments:100, FLOP:268435456000, duration:6.5 ms, mean:41379.2 GFLOPS, stdev=4.4 GFLOPS
  99% [||||||||||||||||||||||||||||||||||||||||||||||||||||||||||| ]
 Peak MFMA IOPs (I8), GPU ID: 0, workgroupSize:256, workgroups:16384, experiments:100, IOP:2147483648000, duration:12.9 ms, mean:166281.9 GOPS, stdev=2495.9 GOPS
 GPU Device 1: Profiling...
 ...
 GPU Device 2: Profiling...
 ...
 GPU Device 3: Profiling...
 ...
Tip
To reduce verbosity of profiling output try the --quiet flag. This hides
rocprof output and activates a progress bar.
Notice the two main stages in ROCm Compute Profiler’s default profiling routine.
The first stage collects all the counters needed for ROCm Compute Profiler analysis (omitting any filters you have provided).
The second stage collects data for the roofline analysis (this stage can be disabled using
--no-roof).
At the end of profiling, you can find all resulting csv files in a
SoC-specific target directory; for
example:
“MI300A” or “MI300X” for the AMD Instinct™ MI300 family of accelerators
“MI200” for the AMD Instinct MI200 family of accelerators
“MI100” for the AMD Instinct MI100 family of accelerators
The SoC names are generated as a part of ROCm Compute Profiler, and do not always distinguish between different accelerators in the same family; for instance, an Instinct MI210 vs an Instinct MI250.
Note
Additionally, you will notice a few extra files. An SoC parameters file,
sysinfo.csv, is created to reflect the target device settings. All
profiling output is stored in log.txt. Roofline-specific benchmark
results are stored in roofline.csv and roofline plots are outputted into PDFs as
empirRoof_gpu-0_[datatype1]_..._[datatypeN].pdf where data types requested through
--roofline-data-type option are listed in the file name.
$ ls workloads/vcopy/MI200/
total 112
total 60
-rw-r--r-- 1 auser agroup 27937 Mar  1 15:15 log.txt
drwxr-xr-x 1 auser agroup     0 Mar  1 15:15 perfmon
-rw-r--r-- 1 auser agroup 26175 Mar  1 15:15 pmc_perf.csv
-rw-r--r-- 1 auser agroup  1708 Mar  1 15:17 roofline.csv
-rw-r--r-- 1 auser agroup   519 Mar  1 15:15 SQ_IFETCH_LEVEL.csv
-rw-r--r-- 1 auser agroup   456 Mar  1 15:15 SQ_INST_LEVEL_LDS.csv
-rw-r--r-- 1 auser agroup   474 Mar  1 15:15 SQ_INST_LEVEL_SMEM.csv
-rw-r--r-- 1 auser agroup   474 Mar  1 15:15 SQ_INST_LEVEL_VMEM.csv
-rw-r--r-- 1 auser agroup   599 Mar  1 15:15 SQ_LEVEL_WAVES.csv
-rw-r--r-- 1 auser agroup   650 Mar  1 15:15 sysinfo.csv
-rw-r--r-- 1 auser agroup   399 Mar  1 15:15 timestamps.csv
Profiling output format#
Use the --format-rocprof-output <format> profile mode option to specify the output format
of the underlying rocprof tool. The following formats are supported:
csvformat:Ask underlying rocprof tool to dump raw performance counter data in csv format.
The generated csv files across multiple runs of rocprof are processed and dumped into the workload directory as csv files.
Multiple csv files are merged into single pmc_perf.csv file in workload directory.
jsonformat:Ask underlying rocprof tool to dump raw performance counter data in json format.
The generated json files across multiple runs of rocprof are processed and dumped into the workload directory as csv files.
Multiple csv files are merged into single pmc_perf.csv file in workload directory.
rocpdformat:Ask underlying rocprof tool to dump raw performance counter data in rocpd format.
Multiple
rocpddatabase files containding counter collection data are merged into a single csv under the workload folder. The database files are then removed.Use
--retain-rocpd-outputprofile mode option to preserve therocpddatabase(s) in the workload folder. This is useful for custom analysis of profiling data.
Filtering#
To reduce profiling time and the counters collected, you should use profiling filters. Profiling filters and their functionality depend on the underlying profiler being used. While ROCm Compute Profiler is profiler-agnostic, this following is a detailed description of profiling filters available when using ROCm Compute Profiler with ROCProfiler.
Filtering options#
-b,--block <block-name>Allows system profiling on one or more selected analysis report blocks to speed up the profiling process. See Analysis report block filtering.
-k,--kernel <kernel-substr>Allows for kernel filtering. Usage is equivalent with the current
rocprofutility. See Kernel filtering.-d,--dispatch <dispatch-id>Allows for dispatch ID filtering. Usage is equivalent with the current
rocprofutility. See Dispatch filtering.
Tip
Be cautious when combining different profiling filters in the same call. Conflicting filters may result in error.
For example, filtering a dispatch, but that dispatch doesn’t match your kernel name filter.
Analysis report block filtering#
You can profile specific hardware report blocks to speed up the profiling process. In ROCm Compute Profiler, the term analysis report block refers to a section of the analysis report which focuses on metrics associated with a hardware component or a group of hardware components. All profiling results are accumulated in the same target directory without overwriting those for other hardware components. This enables incremental profiling and analysis.
The following example only gathers hardware counters used to calculate metrics
for Compute Unit - Instruction Mix (block 10) and Wavefront Launch Statistics
(block 7) sections of the analysis report, while skipping over all other hardware counters.
$ rocprof-compute profile --name vcopy -b 10 7 -- ./vcopy -n 1048576 -b 256

                                 __                                       _
 _ __ ___   ___ _ __  _ __ ___  / _|       ___ ___  _ __ ___  _ __  _   _| |_ ___
| '__/ _ \ / __| '_ \| '__/ _ \| |_ _____ / __/ _ \| '_ ` _ \| '_ \| | | | __/ _ \
| | | (_) | (__| |_) | | | (_) |  _|_____| (_| (_) | | | | | | |_) | |_| | ||  __/
|_|  \___/ \___| .__/|_|  \___/|_|        \___\___/|_| |_| |_| .__/ \__,_|\__\___|
               |_|                                           |_|

rocprofiler-compute version: 2.0.0
Profiler choice: rocprofv1
Path: /home/auser/repos/rocprofiler-compute/sample/workloads/vcopy/MI200
Target: MI200
Command: ./vcopy -n 1048576 -b 256
Kernel Selection: None
Dispatch Selection: None
Hardware Blocks: []
Report Sections: ['10', '7']

~~~~~~~~~~~~~~~~~~~~~~~~~~~~~~~~
Collecting Performance Counters
~~~~~~~~~~~~~~~~~~~~~~~~~~~~~~~~
...
It is also possible to collect individual metrics from the analysis report by providing metric ids.
The following example only collects the counters required to calculate Total VALU FLOPs (metric id 11.1.0) and LDS Utilization (metric id 12.1.0).
$ rocprof-compute profile --name vcopy -b 11.1.1 12.1.1 -- ./vcopy -n 1048576 -b 256

                                 __                                       _
 _ __ ___   ___ _ __  _ __ ___  / _|       ___ ___  _ __ ___  _ __  _   _| |_ ___
| '__/ _ \ / __| '_ \| '__/ _ \| |_ _____ / __/ _ \| '_ ` _ \| '_ \| | | | __/ _ \
| | | (_) | (__| |_) | | | (_) |  _|_____| (_| (_) | | | | | | |_) | |_| | ||  __/
|_|  \___/ \___| .__/|_|  \___/|_|        \___\___/|_| |_| |_| .__/ \__,_|\__\___|
               |_|                                           |_|

rocprofiler-compute version: 2.0.0
Profiler choice: rocprofv1
Path: /home/auser/repos/rocprofiler-compute/sample/workloads/vcopy/MI200
Target: MI200
Command: ./vcopy -n 1048576 -b 256
Kernel Selection: None
Dispatch Selection: None
Hardware Blocks: []
Report Sections: ['11.1.0', '12.1.0']

~~~~~~~~~~~~~~~~~~~~~~~~~~~~~~~~
Collecting Performance Counters
~~~~~~~~~~~~~~~~~~~~~~~~~~~~~~~~
...
To see a list of available hardware report blocks, use the --list-metrics option.
$ rocprof-compute profile --list-metrics

                                 __                                       _
 _ __ ___   ___ _ __  _ __ ___  / _|       ___ ___  _ __ ___  _ __  _   _| |_ ___
| '__/ _ \ / __| '_ \| '__/ _ \| |_ _____ / __/ _ \| '_ ` _ \| '_ \| | | | __/ _ \
| | | (_) | (__| |_) | | | (_) |  _|_____| (_| (_) | | | | | | |_) | |_| | ||  __/
|_|  \___/ \___| .__/|_|  \___/|_|        \___\___/|_| |_| |_| .__/ \__,_|\__\___|
               |_|                                           |_|

0 -> Top Stats
1 -> System Info
2 -> System Speed-of-Light
      2.1 -> Speed-of-Light
               2.1.0 -> VALU FLOPs
               2.1.1 -> VALU IOPs
               2.1.2 -> MFMA FLOPs (F8)
...
5 -> Command Processor (CPC/CPF)
      5.1 -> Command Processor Fetcher
               5.1.0 -> CPF Utilization
               5.1.1 -> CPF Stall
               5.1.2 -> CPF-L2 Utilization
      5.2 -> Packet Processor
               5.2.0 -> CPC Utilization
               5.2.1 -> CPC Stall Rate
               5.2.5 -> CPC-UTCL1 Stall
...
6 -> Workgroup Manager (SPI)
      6.1 -> Workgroup Manager Utilizations
               6.1.0 -> Accelerator Utilization
               6.1.1 -> Scheduler-Pipe Utilization
               6.1.2 -> Workgroup Manager Utilization
Kernel filtering#
Kernel filtering is based on the name of the kernels you want to isolate. Use a kernel name substring list to isolate desired kernels.
The following example demonstrates profiling isolating the kernel matching
substring vecCopy.
$ rocprof-compute profile --name vcopy -k vecCopy -- ./vcopy -n 1048576 -b 256

                                 __                                       _
 _ __ ___   ___ _ __  _ __ ___  / _|       ___ ___  _ __ ___  _ __  _   _| |_ ___
| '__/ _ \ / __| '_ \| '__/ _ \| |_ _____ / __/ _ \| '_ ` _ \| '_ \| | | | __/ _ \
| | | (_) | (__| |_) | | | (_) |  _|_____| (_| (_) | | | | | | |_) | |_| | ||  __/
|_|  \___/ \___| .__/|_|  \___/|_|        \___\___/|_| |_| |_| .__/ \__,_|\__\___|
               |_|                                           |_|

rocprofiler-compute version: 2.0.0
Profiler choice: rocprofv1
Path: /home/auser/repos/rocprofiler-compute/sample/workloads/vcopy/MI200
Target: MI200
Command: ./vcopy -n 1048576 -b 256
Kernel Selection: ['vecCopy']
Dispatch Selection: None
Hardware Blocks: All

~~~~~~~~~~~~~~~~~~~~~~~~~~~~~~~~
Collecting Performance Counters
~~~~~~~~~~~~~~~~~~~~~~~~~~~~~~~~
...
Dispatch filtering#
Dispatch filtering is based on the global dispatch index of kernels in a run.
The following example profiles only the first kernel dispatch in the execution of the application (note zero-based indexing).
$ rocprof-compute profile --name vcopy -d 0 -- ./vcopy -n 1048576 -b 256

                                 __                                       _
 _ __ ___   ___ _ __  _ __ ___  / _|       ___ ___  _ __ ___  _ __  _   _| |_ ___
| '__/ _ \ / __| '_ \| '__/ _ \| |_ _____ / __/ _ \| '_ ` _ \| '_ \| | | | __/ _ \
| | | (_) | (__| |_) | | | (_) |  _|_____| (_| (_) | | | | | | |_) | |_| | ||  __/
|_|  \___/ \___| .__/|_|  \___/|_|        \___\___/|_| |_| |_| .__/ \__,_|\__\___|
               |_|                                           |_|

rocprofiler-compute version: 2.0.0
Profiler choice: rocprofv1
Path: /home/auser/repos/rocprofiler-compute/sample/workloads/vcopy/MI200
Target: MI200
Command: ./vcopy -n 1048576 -b 256
Kernel Selection: None
Dispatch Selection: ['0']
Hardware Blocks: All

~~~~~~~~~~~~~~~~~~~~~~~~~~~~~~~~
Collecting Performance Counters
~~~~~~~~~~~~~~~~~~~~~~~~~~~~~~~~
...
Standalone roofline#
Roofline analysis occurs on any profile mode run, provided --no-roof option is not included.
You don’t need to include any additional roofline-specific options for roofline analysis.
If you want to focus only on roofline-specific performance data and reduce the time it takes to profile, you can use the --roof-only option.
This option limits the profiling to just the roofline performance counters.
Roofline options#
--sort <desired_sort>Allows you to specify whether you would like to overlay top kernel or top dispatch data in your roofline plot.
-m,--mem-level <cache_level>Allows you to specify specific levels of cache to include in your roofline plot.
--device <gpu_id>Allows you to specify a device ID to collect performance data from when running a roofline benchmark on your system.
--roofline-data-type <datatype>Allows you to specify data types that you want plotted in the roofline PDF output(s). Selecting more than one data type will overlay the results onto the same plot. Default: FP32
Note
For more information on data types supported based on the GPU architecture, see Performance model
To distinguish different kernels in your .pdf roofline plot use
--kernel-names. This will give each kernel a unique marker identifiable from
the plot’s key.
Roofline only#
The following example demonstrates profiling roofline data only:
$ rocprof-compute profile --name vcopy --roof-only -- ./vcopy -n 1048576 -b 256

...
[roofline] Checking for roofline.csv in /home/auser/repos/rocprofiler-compute/sample/workloads/vcopy/MI200
[roofline] No roofline data found. Generating...
Checking for roofline.csv in /home/auser/repos/rocprofiler-compute/sample/workloads/vcopy/MI200
Empirical Roofline Calculation
Copyright © 2022  Advanced Micro Devices, Inc. All rights reserved.
Total detected GPU devices: 4
GPU Device 0: Profiling...
 99% [||||||||||||||||||||||||||||||||||||||||||||||||||||||||||| ]
 ...
Empirical Roofline PDFs saved!
An inspection of our workload output folder shows .pdf plots were generated
successfully.
$ ls workloads/vcopy/MI200/
total 48
-rw-r--r-- 1 auser agroup 13331 Mar  1 16:05 empirRoof_gpu-0_FP32.pdf
drwxr-xr-x 1 auser agroup     0 Mar  1 16:03 perfmon
-rw-r--r-- 1 auser agroup  1101 Mar  1 16:03 pmc_perf.csv
-rw-r--r-- 1 auser agroup  1715 Mar  1 16:05 roofline.csv
-rw-r--r-- 1 auser agroup   650 Mar  1 16:03 sysinfo.csv
-rw-r--r-- 1 auser agroup   399 Mar  1 16:03 timestamps.csv
Note
ROCm Compute Profiler currently captures roofline profiling for all data types, and you can reduce the clutter in the PDF outputs by filtering the data type(s). Selecting multiple data types will overlay the results into the same PDF. To generate results in separate PDFs for each data type from the same workload run, you can re-run the profiling command with each data type as long as the
roofline.csvfile still exists in the workload folder.
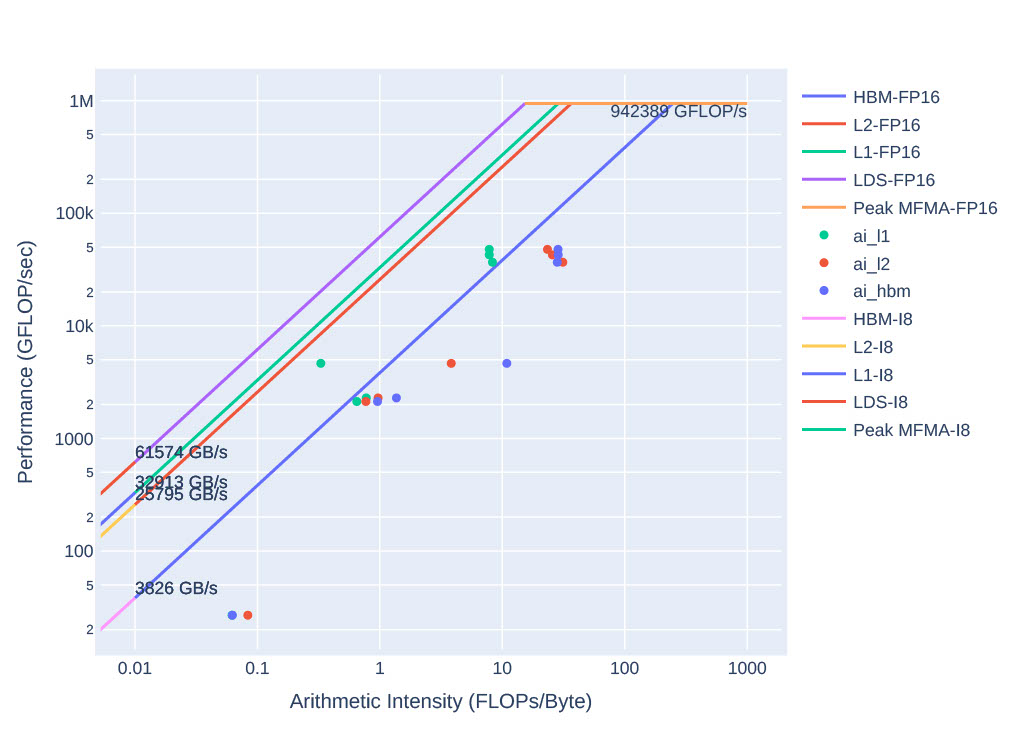
The following image is a sample empirRoof_gpu-0_FP32.pdf roofline
plot.