Using PC sampling in ROCm Compute Profiler#
Program Counter (PC) sampling service for GPU profiling is a profiling technique that periodically samples the program counter during the GPU kernel execution to understand code execution patterns and hotspots.
ROCm Compute Profiler supports Host Trap PC sampling and Stochastic (Hardware-Based) PC sampling. Host Trap PC sampling is enabled for AMD Instinct MI200 series and later accelerators. Stochastic (hardware-based) PC sampling is enabled for AMD Instinct MI300 series and later accelerators. Stochastic PC sampling provides additional information that tells whether a sampled wave issued an instruction for a particular PC. It also provides the reason for not issuing the instruction (stall reason). This type of information is particularly useful for understanding stalls during the kernel execution. The PC sampling can be used with profiling and analysis options.
Profiling options#
For using profiling options for PC sampling the configuration needed are:
--pc-sampling-method: Should be eitherstochasticorhost_trap, (DEFAULT: stochastic)--pc-sampling-interval: For stochastic sampling, the interval is in cycles. The finest granularity is 1 cycle. Forhost_trapsampling, the interval is in microsecond (DEFAULT: 1048576). The interval should be the power of 2. You are recommended try starting from 1048576, and lowering until reaching 65536.
Sample command:
$ rocprof-compute profile -n pc_test -b 21 --no-roof --pc-sampling-method stochastic --pc-sampling-interval 1048576 -VVV -- target_app
Analysis options#
For using analysis options for PC sampling the configuration needed are:
--pc-sampling-sorting-type:offsetorcount. The default option isoffset.offsetis an assembly instruction offset in the code object.
Sample command:
$ rocprof-compute analyze -p workloads/pc_test/MI300A_A1/ -b 21 -k 0 --pc-sampling-sorting-type offset
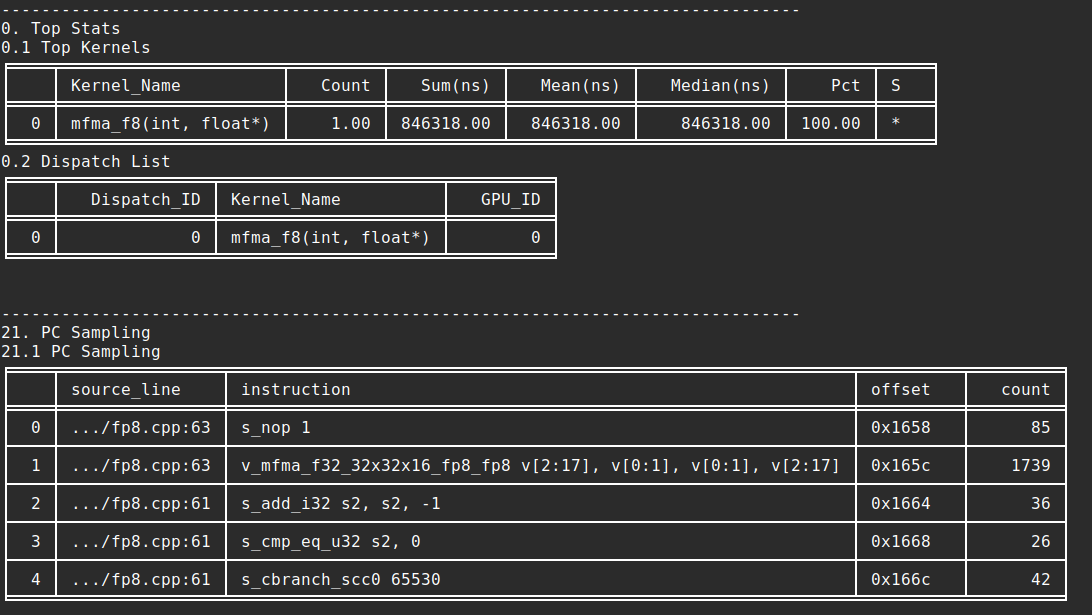
Sample output:
Selecting single kernel host trap PC sampling:
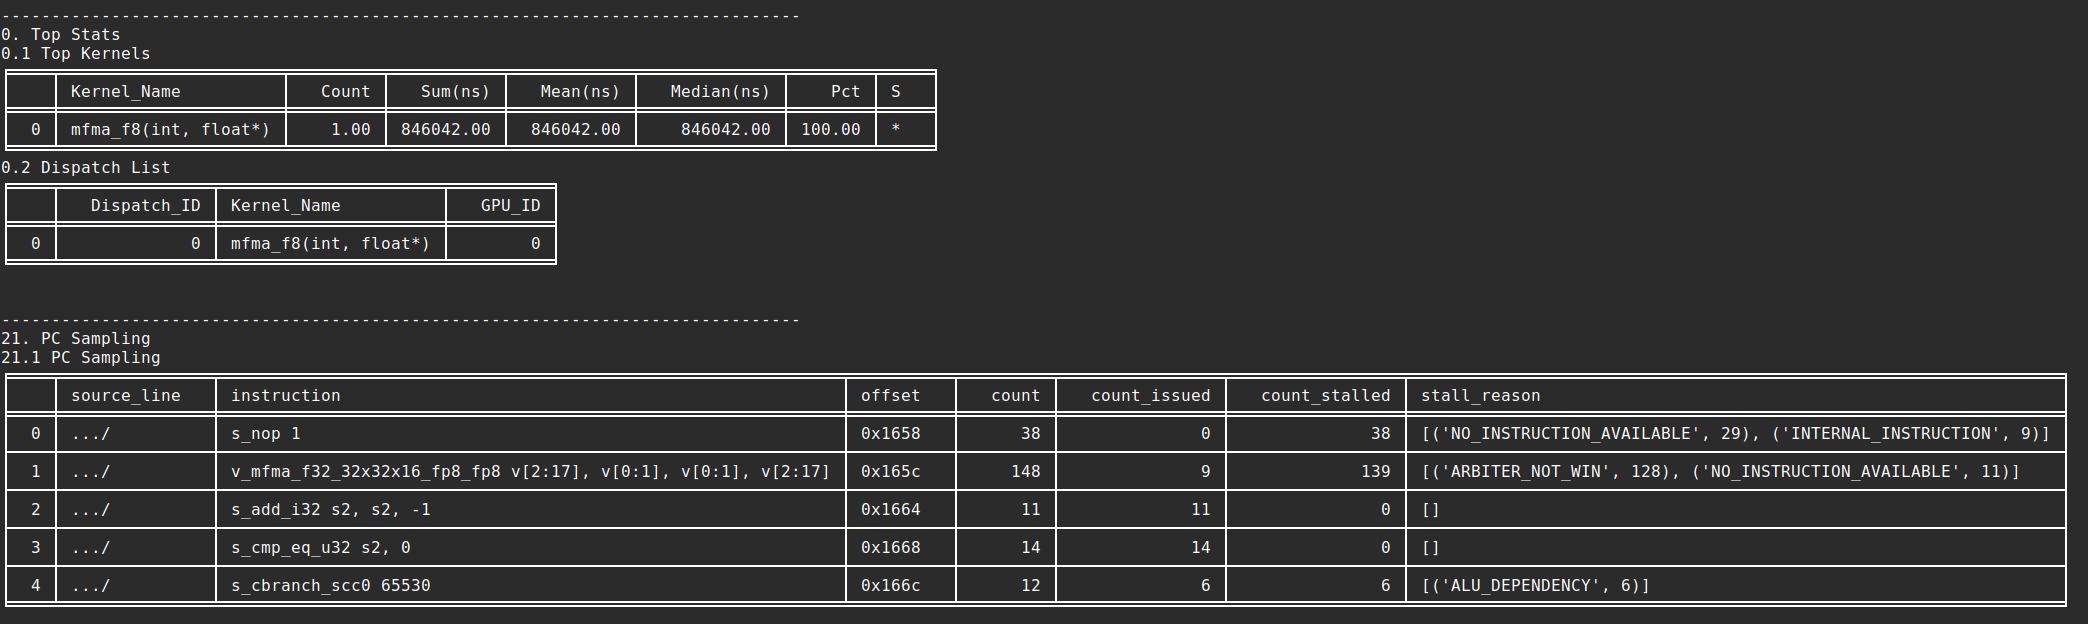
Selecting single kernel stochastic PC sampling:
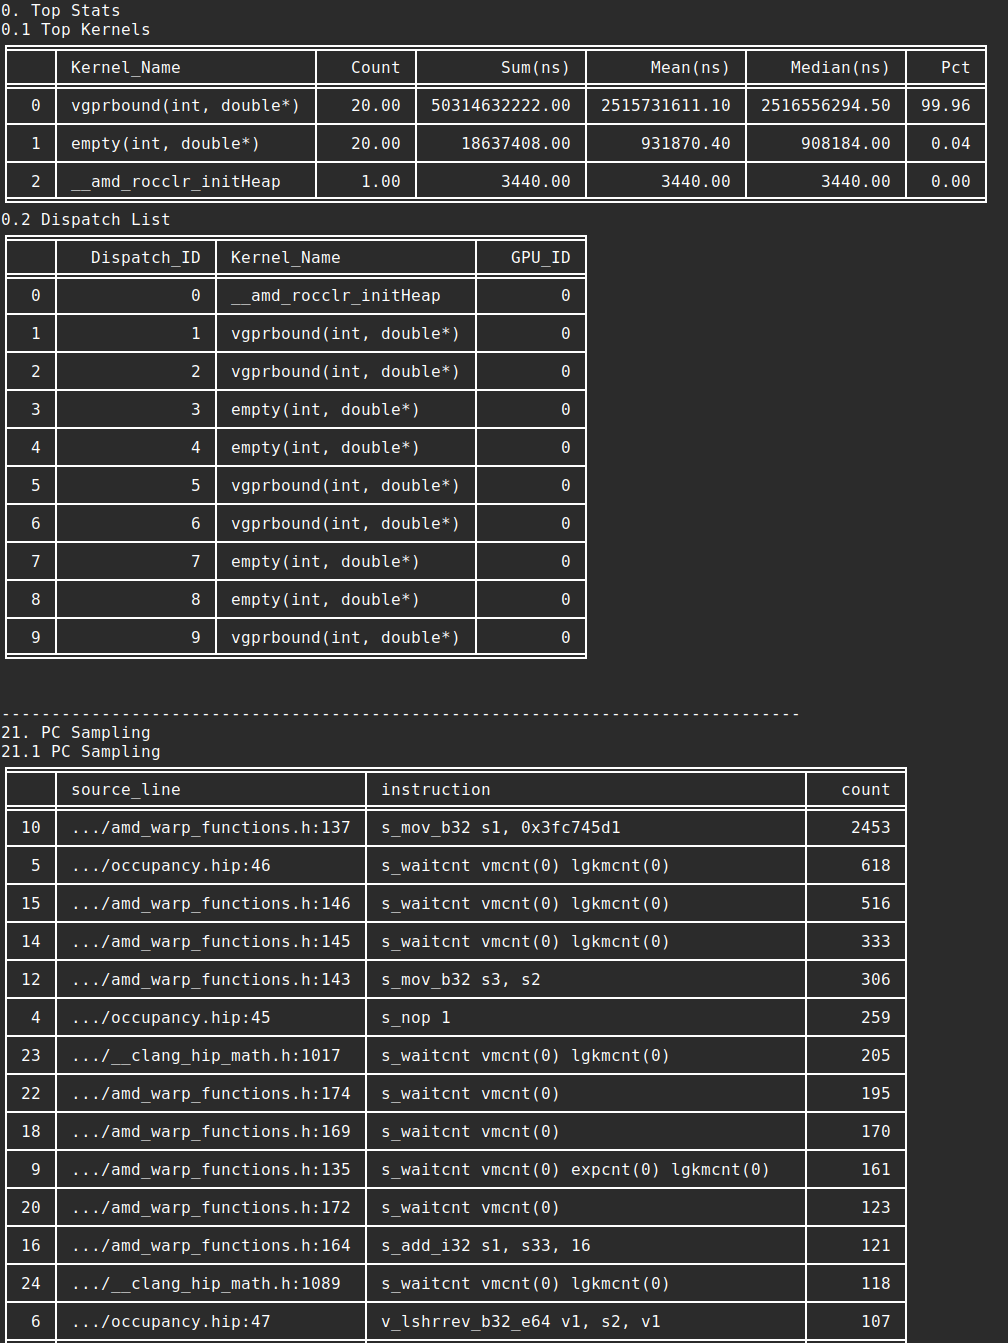
If you don’t filter by kernel, the output will fall back to the original data from rocprofv3 csv output for all the kernels:
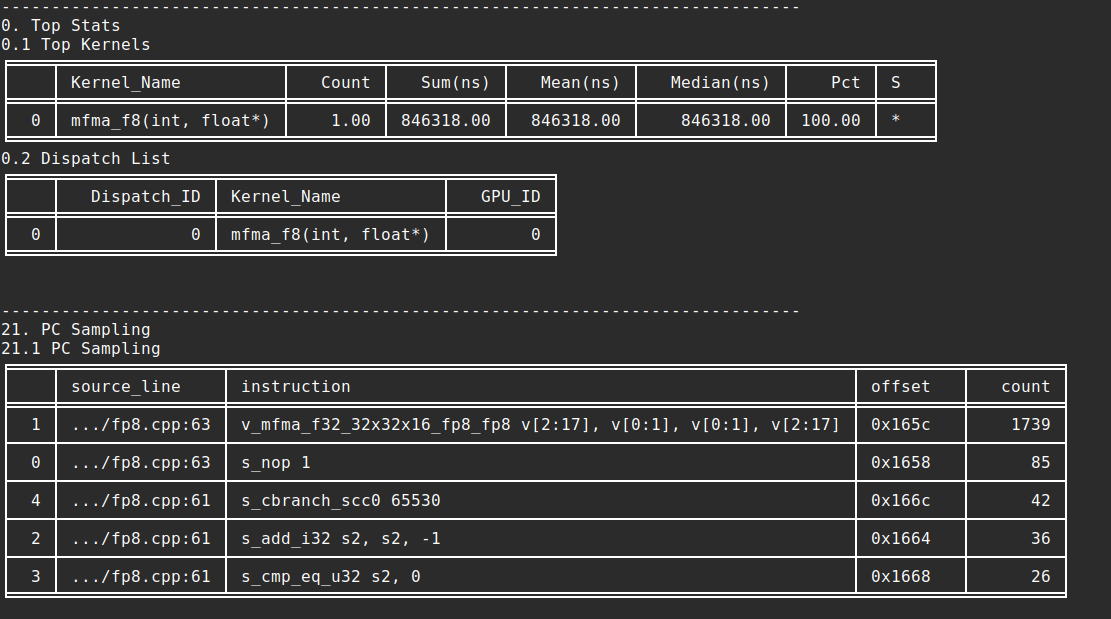
Selecting single kernel sorting by PC count:
Note
PC sampling feature is currently in BETA version. To enable PC sampling, you have to explicitly enable it with block index 21.
To associate PC sampling info back to HIP source code, you need to build the profiling target app with
-gto keep the symbols. Otherwise, PC sampling info will be only associated with assembly lines.