View ROCm Systems Profiler trace data in ROCm Optiq#
2026-07-14
12 min read time
ROCm Optiq provides a detailed view of a trace: a complete record of profiling data captured during an application run, including all event tracks, sample counters, and metadata. It captures what happened, when it happened, and often how long it took.
Traces contain event tracks and counter tracks:
An event track is a horizontal lane in the profiler’s timeline view that displays individual events such as API calls (for example, ROCm functions), kernel dispatches on the GPU, CPU function calls, or other execution units. Each event is shown as a bar positioned according to its start and end timestamps, allowing you to visualize execution order and duration.
A counter track is a timeline track that displays the value of a metric that changes over time. These tracks show a sampled scalar value at a specific timestamp. Examples of information shown in a counter track include:
Processor frequency
Data traffic (bytes sent/received)
Memory usage
Hardware counter values
Thermal readings
Note
See the ROCm Systems Profiler documentation for more information on tracing.
Open a trace file#
ROCm Optiq supports the ROCm .db and .rpd database formats.
.dbfiles are trace files in the ROCm Profile Data (ROCpd) format generated by the ROCprofiler-SDK (rocprofv3) and ROCm Systems Profiler..rpdfiles are trace files in the ROCpd format generated by tools such as RPD tracer.
Select File > Open to open a trace. You can also open files by dragging them into the application window.
Troubleshooting#
If the trace file doesn’t open, the file might be in an unsupported format. Convert the file to a supported format (.db or .rpd) using ROCm scripts.
To generate profiling data in a compatible ROCpd format for ROCm Systems Profiler:
Set the configuration environment to output data in the ROCpd format:
export ROCPROFSYS_USE_ROCPD=ON  # enable rocpd output
export ROCPROFSYS_USE_TRACE=OFF # disabling default Perfetto output
Trace your application with call-stack sampling:
rocprof-sys-sample -- ./your-application
Instrument your application using a binary rewrite:
rocprof-sys-instrument -o your-application.inst -- ./your-application
rocprof-sys-run -- ./your-application.inst
View trace data#
Once you open a trace file, you can view its data from the System Topology View and the Timeline View.
System Topology View#
The System Topology View displays a hierarchical representation of the hardware and software components, including processors, queues, counters, processes, streams, threads, and sampled threads.
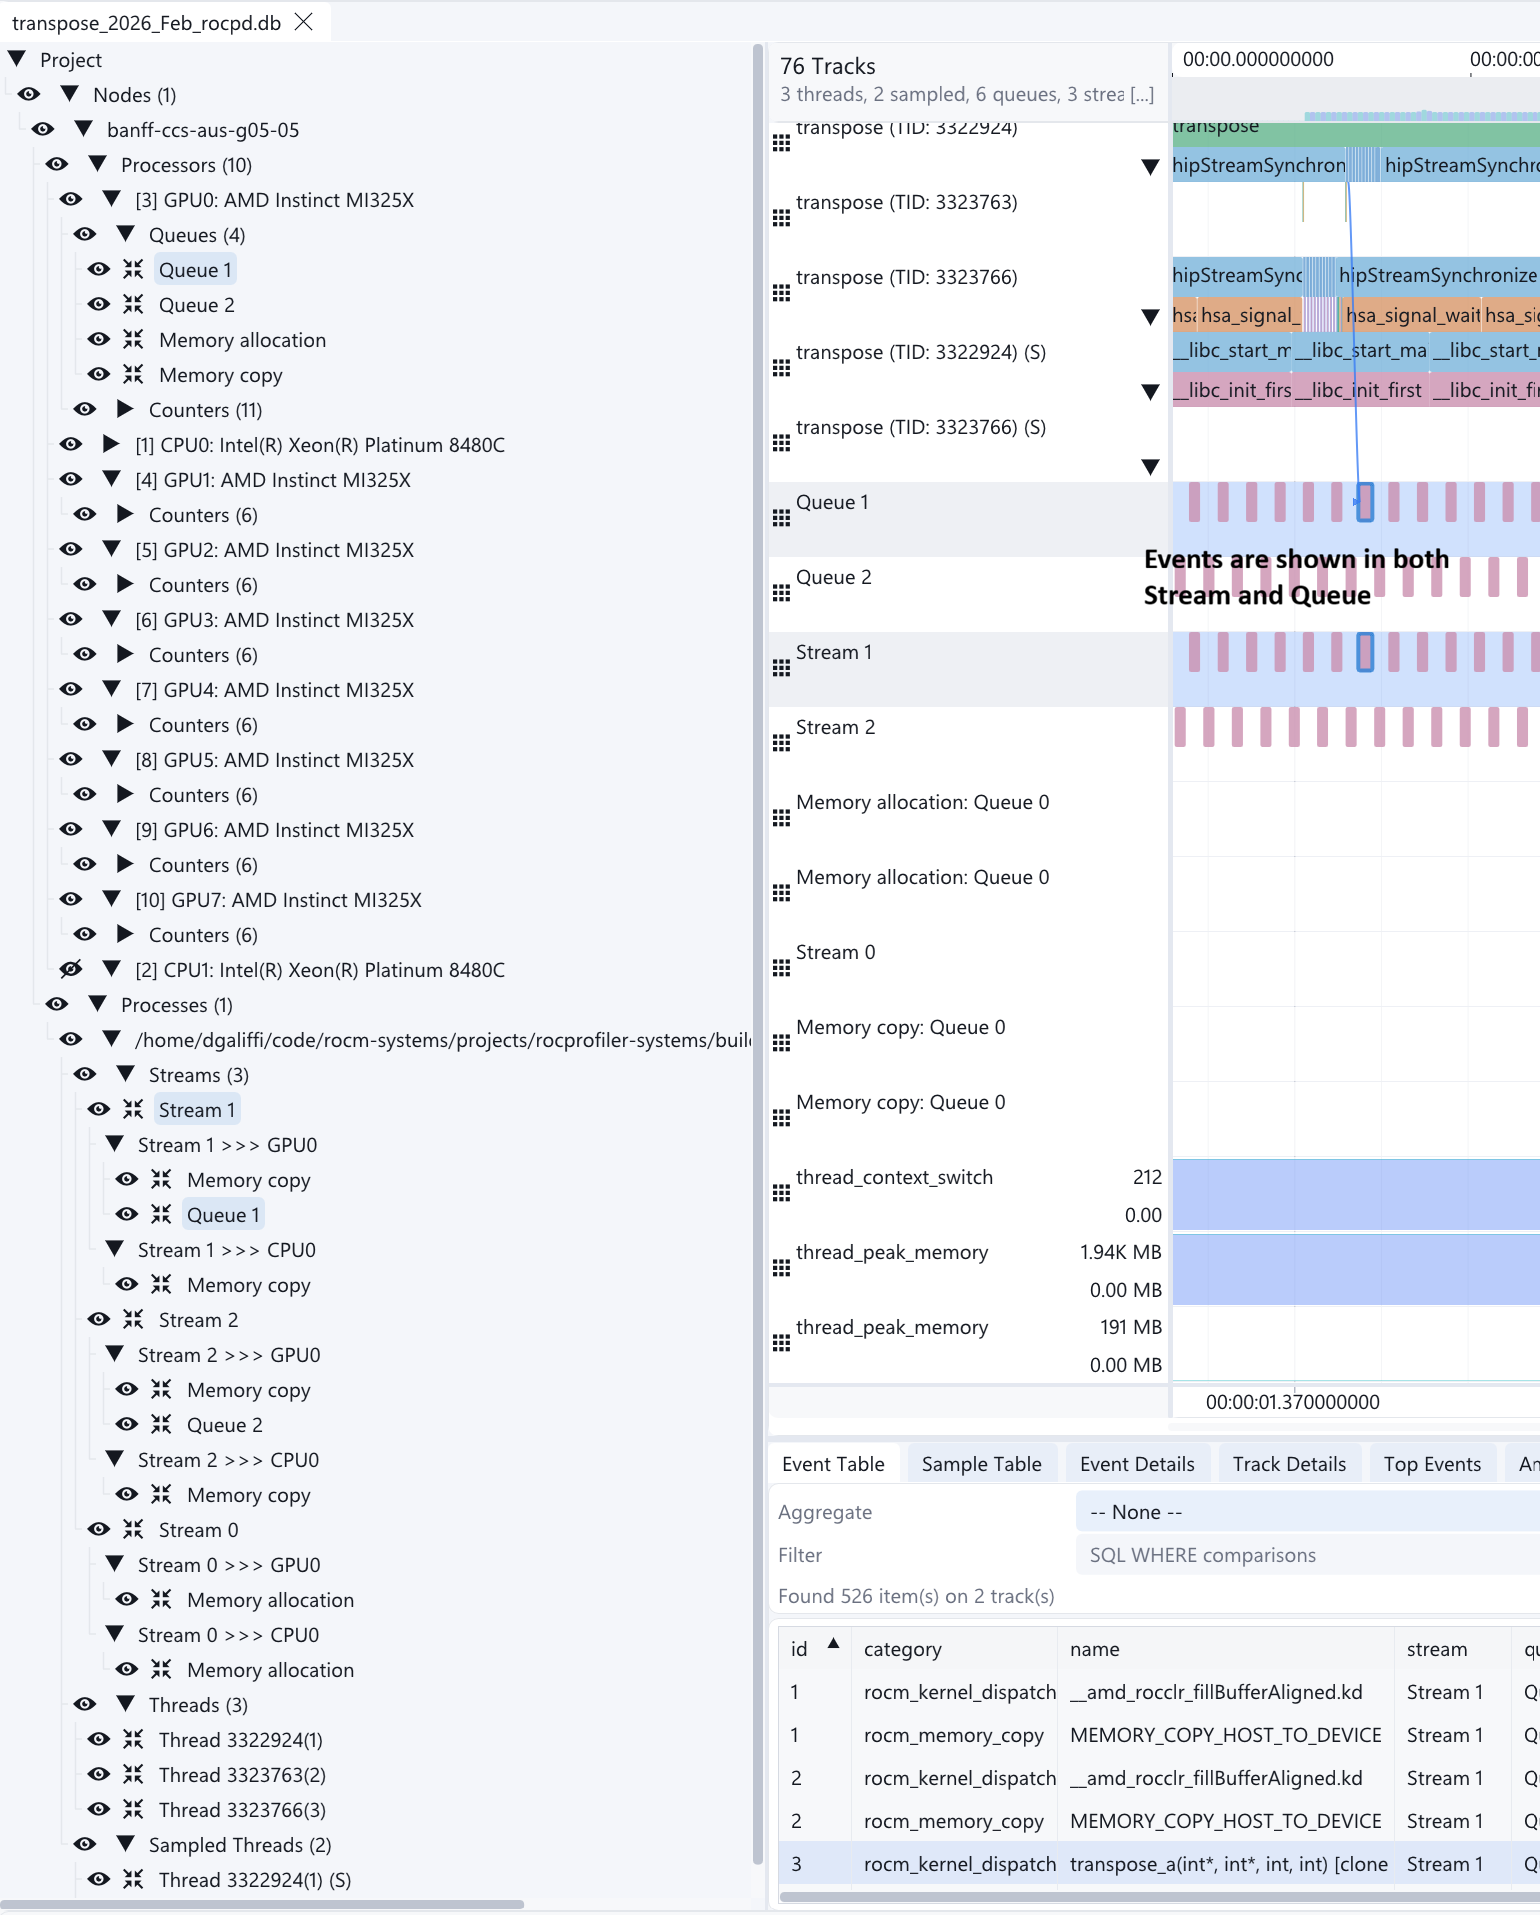
Click
 to show or hide tracks. Hiding a higher-level element automatically hides all underlying queues, streams, and events.
Click
 to go to the track in the Timeline View.
ROCm Optiq displays ROCm events in both Stream view and Queue view simultaneously:
Stream view: Groups events (kernels and memory copies) by the HIP stream to which they were submitted. This view reflects your application’s intended dependencies.
Queue view: Groups the same events by the HSA queue to which they were scheduled. This view reflects what the runtime and hardware actually used.
Timeline View#
The Timeline View displays CPU and GPU activities, events, and performance metrics in chronological order. You can:
Review events such as API calls, kernel dispatches, and more.
See performance counter data as charts displaying the data points.
Zoom, filter, and bookmark data for detailed analysis.
Correlate GPU workloads with in-application CPU events and performance with hardware resource usage to identify and remedy performance blockers.
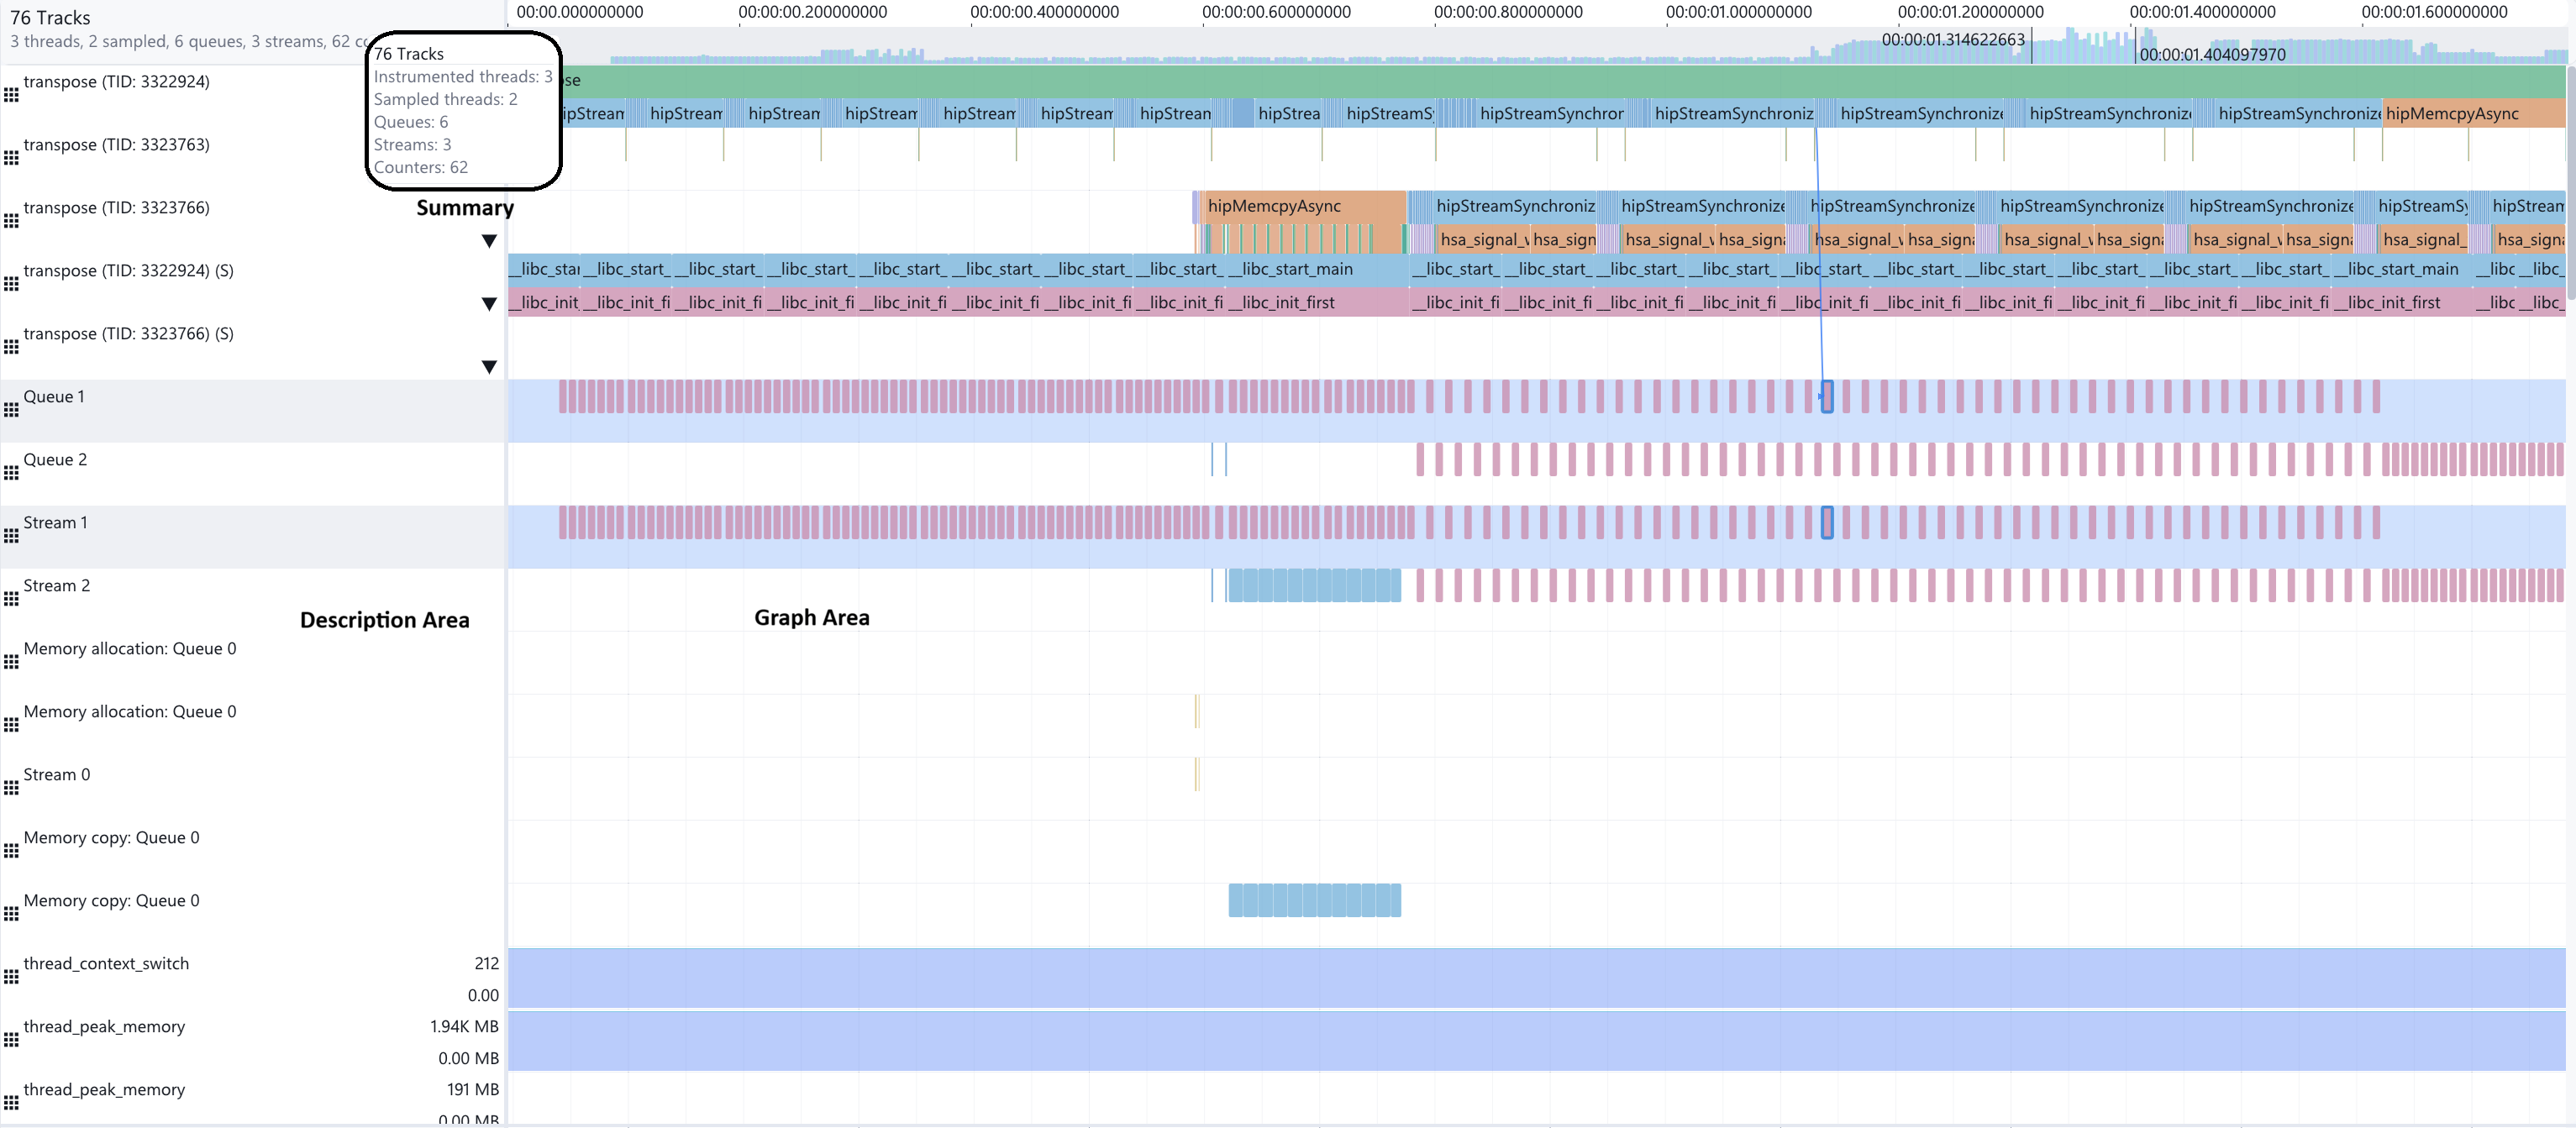
The Timeline View has a Description area that describes a specific category of events or metrics within a profiling trace, and a Graph area where events and counter graphs are plotted:
Use the Timeline View#
The following sections describe how to navigate, select, and customize tracks in the Timeline View.
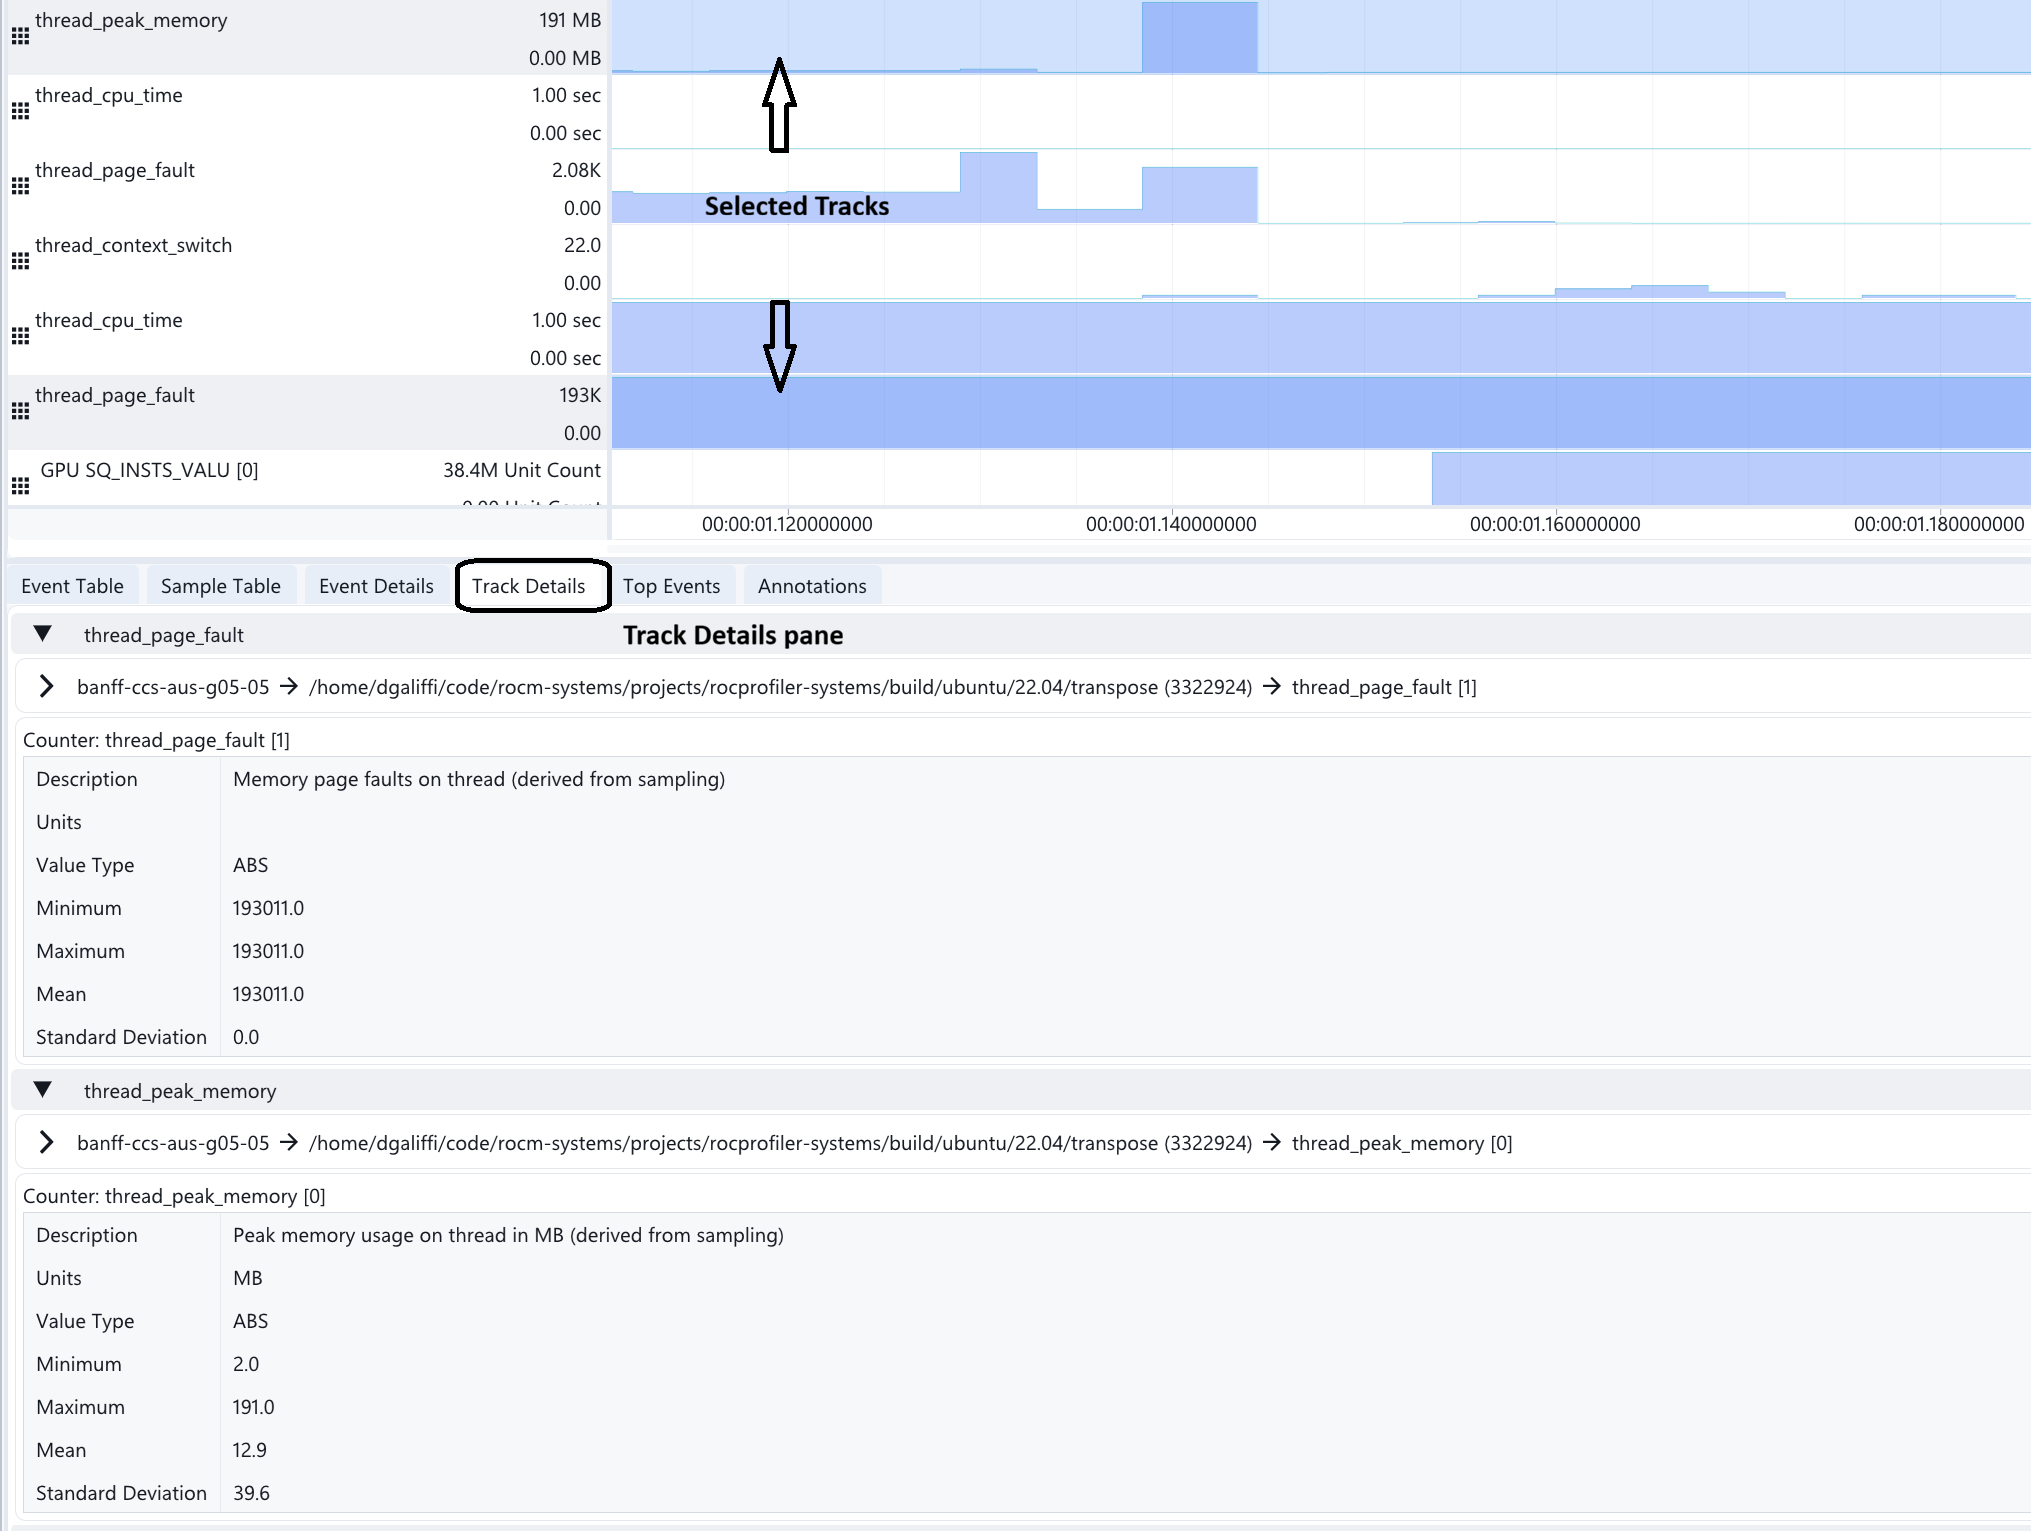
Select a track#
Use the following actions to select tracks in the Timeline View.
Clicking in the Description area selects or deselects the track.
Right-click the track to select Copy track name, Copy track ID, or Track Options.
When a track is selected, the details display in the Track Details pane.
Additionally, depending on the track type, the Event Table or Sample Table tabs in the Advanced Details section will be populated by the contents of the track.
Select an event#
Clicking on an event in the Graph area selects or deselects an event.
Click on an event to select a single event.
Press and hold Ctrl while clicking events to select multiple events. If you click only one event, any previously selected events will be deselected.
When an event is selected, its event details are displayed in the Event Details tab of the Advanced Details section.
Tip
When you hover the mouse pointer over a region with high-density events, the application displays the total number of events in each category.
Resize or reorder tracks#
Use the following actions to resize or reorder tracks.
Resize tracks by dragging the separator lines between tracks.
Reorder tracks by clicking and dragging
 on the left side of the Description area.
Queue Utilization#
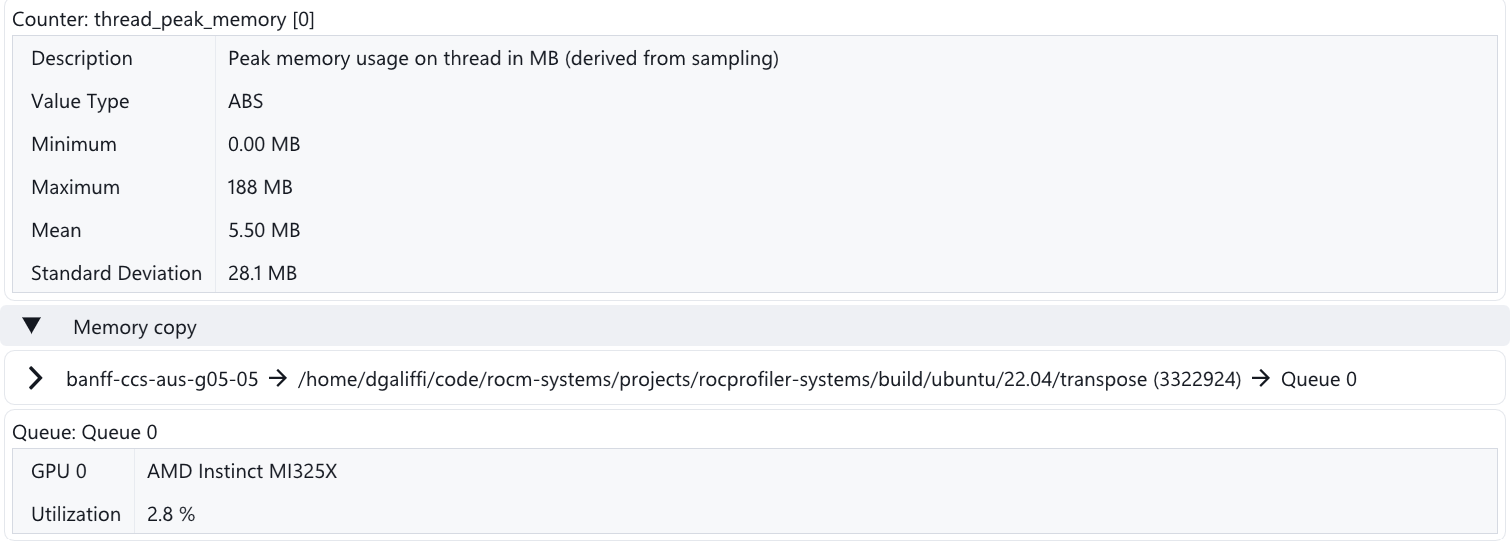
For queue tracks, a Queue Utilization pill displays next to the queue label. It shows the percentage of time the queue was active over the visible time range. When a time-range filter is active, utilization is calculated for the selected range only. The queue utilization is also visible in the Track Details tab.
Sample counter track statistics#
For sample counter tracks, pills showing standard deviation and average display next to the counter label. These can be shown/hidden using the Track Options menu. Additionally, min and max value pills can also be shown/hidden.
Similar to queue utilization, the values in these pills react to reflect the values in the current view or active time-range filter. The Counter statistics are also visible in the Track Details tab.
Measure#
Measure mode lets you measure the elapsed time between two points on the Timeline View, either between timeline points or between specific events.
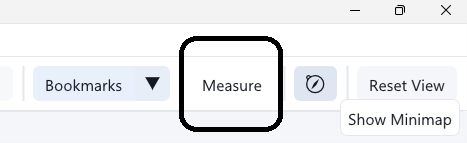
Enable Measure mode from the toolbar or the timeline right-click menu.
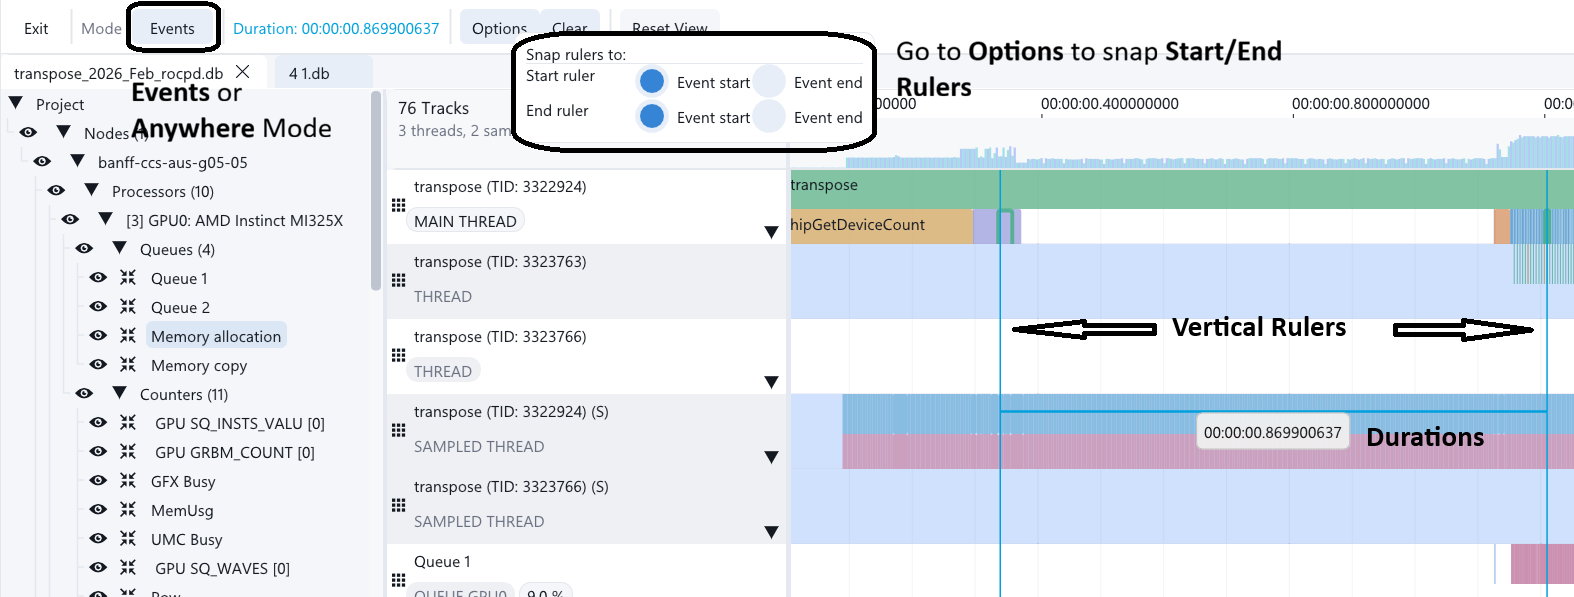
Events mode: Measure duration between two selected events on the timeline. You can snap Start/End Rulers to Event start or Event end.
Anywhere mode: Measure duration between two timeline points. You can drag the rulers horizontally to fine-tune.
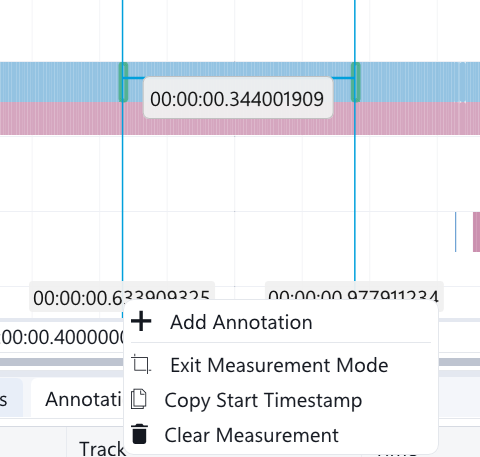
ROCm Optiq draws two vertical rulers with timestamps and shows the duration (time delta) in a label between them.
Right-click a measurement label on the timeline to Copy Start Timestamp, Copy End Timestamp, or Copy Measurement Duration.
Use Reset or Clear measurement to remove the rulers and start a new measurement.
Histogram#
The Histogram provides event density that is normalized across all tracks visible and hidden:

When the Timeline View is zoomed in, the area currently in view is highlighted on the Histogram. The highlighted area in the Histogram can be dragged to scroll the Timeline View.
Advanced Details#
The Advanced Details section provides an in-depth view of profiling data, enabling you to analyze performance metrics and event-specific information. This section provides an interface for multiple data perspectives, offering granular insights through these components:
Event Table: Displays all events within the selected tracks. You can refine your analysis by applying a time-range selection or executing customized SQL-like queries, ensuring targeted event exploration.
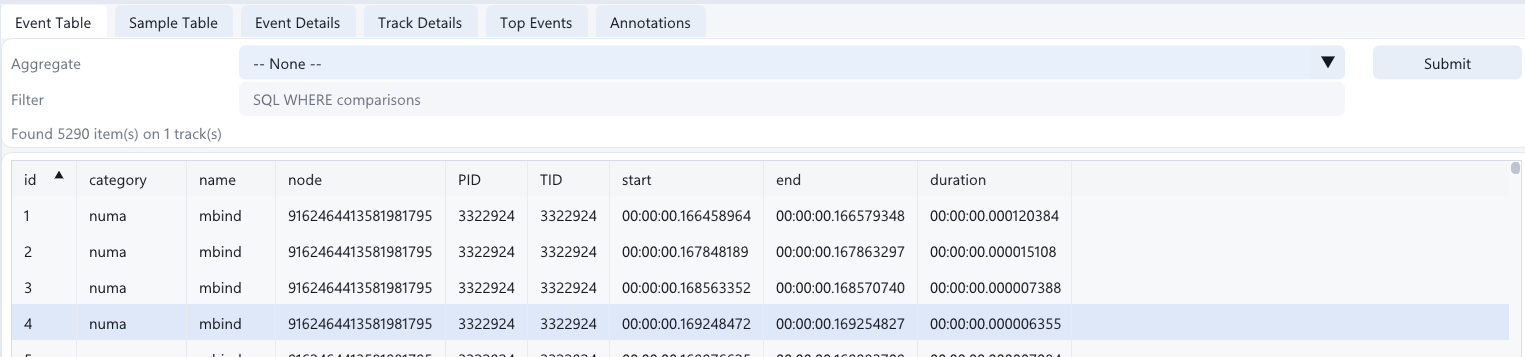
Aggregate: A drop-down groups Event Table results by a selected field (Category, Name, Stream, Queue, Node, PID, or TID). Click Submit to group the results. To remove the grouping, choose —None— and click Submit.
Filter: Enter SQL-like statements to filter the data. For example,
“duration > 2000”displays all events greater than 2000 ns. Click Submit to filter the data.
Tip
Right-click on the column headers to show/hide columns, size a column to fit, or size all columns to fit your screen.
Right-click on a table row and select Go To Event to navigate to the Timeline View to the highlighted event.
Set a time range filter using the Timeline View to filter the rows to data contained within the selected time range.
Sample Table: Presents all performance counter data points associated with the selected tracks. Similar to the Event Table, it supports time-range selection and SQL-like query capabilities for detailed performance analysis. It supports the Aggregate by Column drop-down to group the results by the selected column.
Event Details: Shows extended information about the event that is not shown in the timeline or the Event Table. It shows raw database information such as id, category, duration, associated queue/stream, correlation IDs and API method parameters. It also shows flow, call stack information, and function call arguments, if available.
The Flow Data displays all events logically connected to the selected event in the execution sequence. You can navigate any of the connected events on the timeline, with vertical track centering and highlight feedback, by right clicking and selecting Go To Event. The navigation makes it easier to follow the execution flow across queues and tracks.
The Call Stack Data shows the full call stack hierarchy for providing the calling context that led to that event. This provides understanding about where and why a kernel or function was invoked. The Call Stack Data is displayed in call order, following the execution path. You can open any of the events in the call stack hierarchy by right clicking and choose Go To Event.
You can also right-click on a cell in the Flow Data or Call Stack Data table for copy/export actions.
Track Details: Shows additional information about the track that is not visible on the timeline. It shows the node the track belongs to and its details, the process it belongs to, and the track type (thread, counter, queue, and so on).
The Track Details also show statistics such as queue utilization, counter Minimum, Maximum, Mean, and Standard Deviation.
You can right-click a row or cell of Track Details to Copy Row Data or Copy Cell Data.
Annotations: Displays user-created annotations, enabling easier navigation across critical points within large traces, enhancing collaboration and knowledge sharing. See Add an annotation for more info.
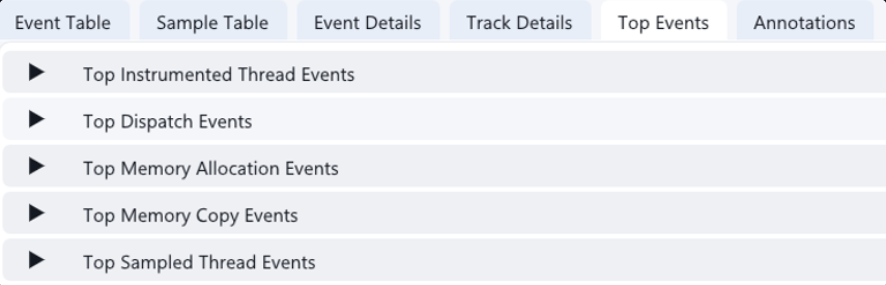
Top Events: Provides analysis for the events of each operation type (instrumented Thread, Sampled thread, Dispatch, memory allocation, memory copy) from the selected tracks aggregated by event name. Available metrics are event count (invocations) and total/average/min/max duration. If you select tracks of different types, each type will be shown in a separate table. Each table has its own System Table instance and can be sorted individually. If you make a time-range selection, Top Events are limited to that selected time-range.
Tip
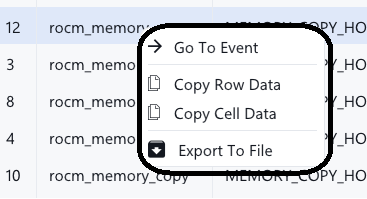
In the Event Table, Event Details, and Top Events tables, right-click a row or cell to Go To Event, Copy Row Data, Copy Cell Data, and Export to File (CSV).
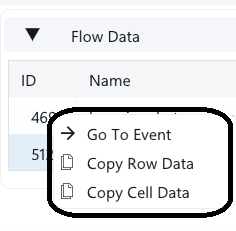
In the Flow Data, and Call Stack tables, right-click a row or cell to Go To Event, Copy Row Data, or Copy Cell Data.
Summary View#
The Summary View displays data from the top 10 kernels by execution time.
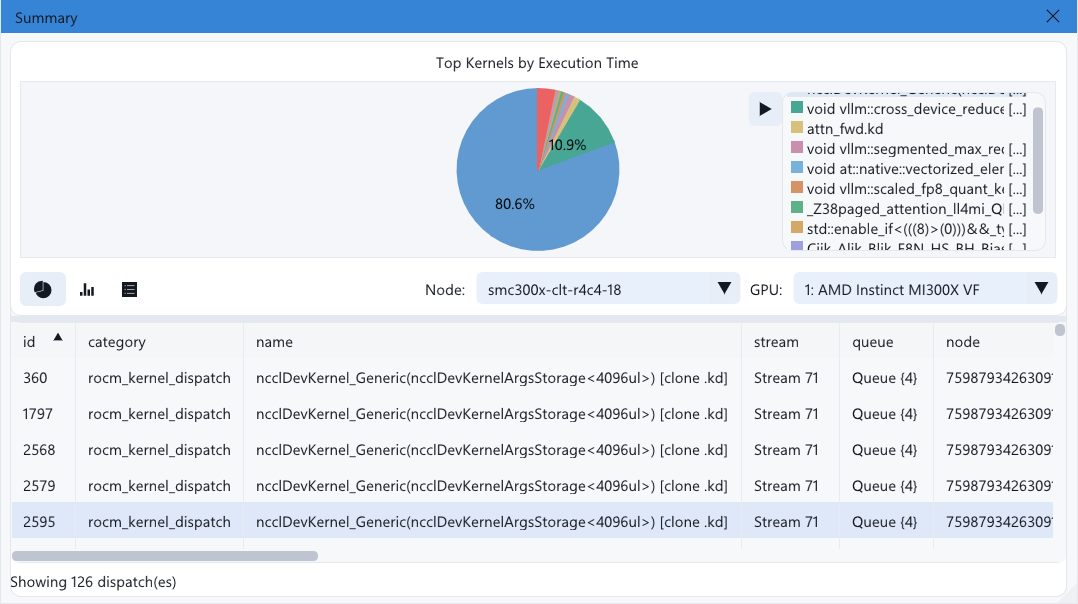
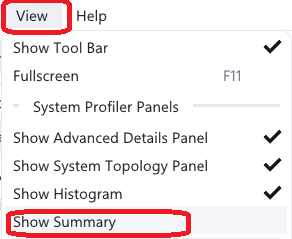
You can access Summary View by clicking View > Show Summary.
There are three ways you can view this data:
A pie chart

A bar chart

A table

You can select one of these views from the  icons in the bottom-left corner.
Once a kernel is selected, the dispatch details display in a table below the chart:
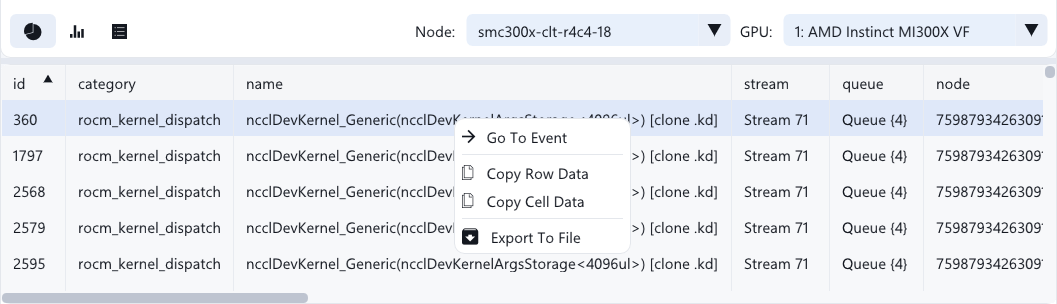
You can also select the Node and GPU from the drop-down menus to focus on the expected node and GPU:


Minimap#
You can open the Minimap by clicking  from the main Toolbar.
The Minimap provides a compact overview that visualizes event density of each track and/or counter values across the entire profiling trace, enabling you to identify hot spots without manually scanning the full timeline.
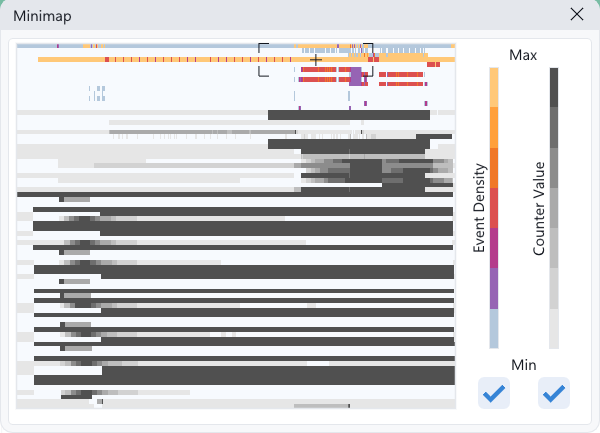
The Minimap provides:
An event density view to quickly identify regions with high volumes of CPU/GPU events.
A counter value view to visualize where sampled performance metrics peak.
Independent toggles to show or hide event density or counter value layers.
The ability to quickly locate performance-critical intervals by highlighting dense regions of events.
The ability to navigate large datasets with ease.
The ability to accelerate root-cause analysis by allowing rapid transitions between coarse-grained overview and fine-grained timeline details.
Search for events#
Search for events using the search box on the main Toolbar.

To search, type a search string and press Enter (search is case-insensitive).
Clicking on a row in the search results will bring the selected event into view on the Timeline View.
Clicking X clears the search results.
The search can match multiple substrings at once. Multiple search tokens must be surrounded by quotation marks without spaces (for example:
“term1””term2”).