Customize your ROCm Optiq project#
2026-07-15
7 min read time
You can customize display settings, filters, bookmarks, and more in your ROCm Optiq projects.
Change settings#
You can adjust the settings in your ROCm Compute Profiler and ROCm Systems Profiler projects.
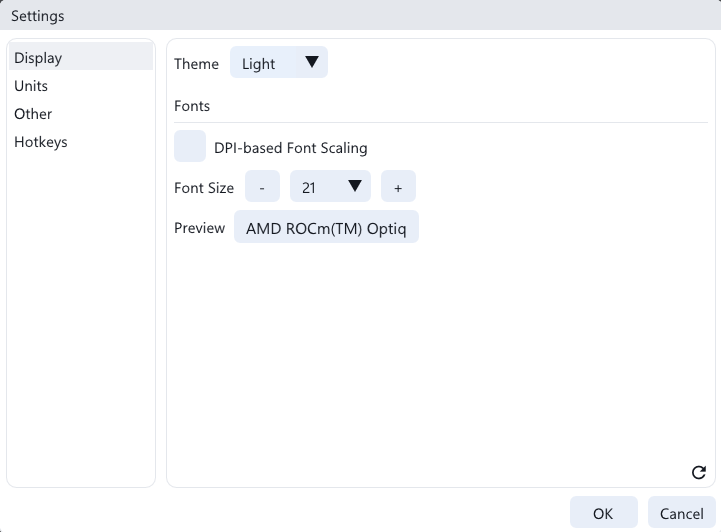
Select Edit > Preferences to adjust these global settings for ROCm Optiq from the Settings menu:
The application theme display (Light or Dark mode).
The font scaling: automatic based on the display DPI, or customized using the font size control:
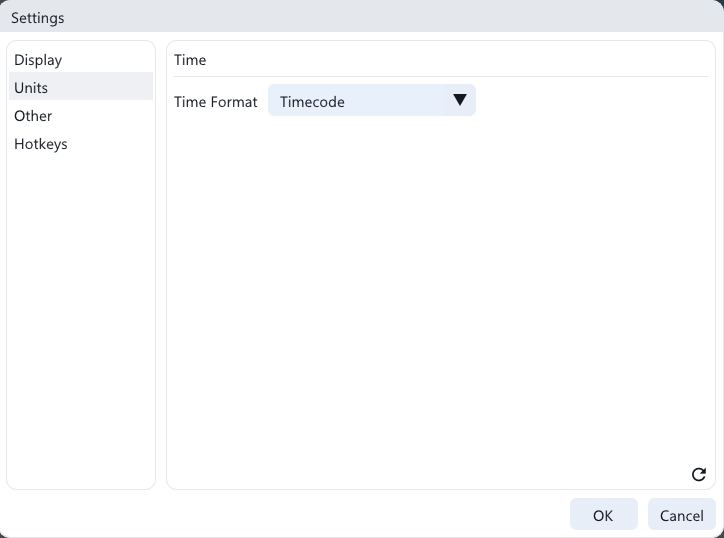
The time unit settings displayed on the Timeline View:
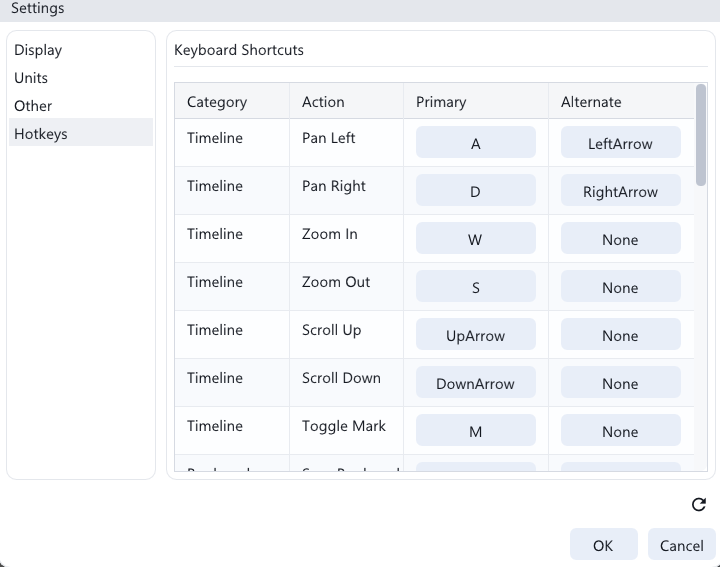
The hotkey settings allow keyboard shortcuts to be redefined:
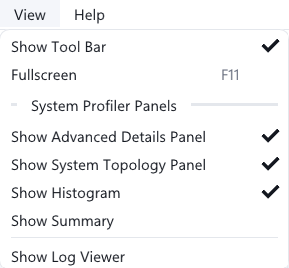
Show/hide panels#
Use the View menu to show and hide application panels.
Customize projects for ROCm Systems Profiler traces#
You can customize the data views of an open ROCm Systems Profiler trace file in ROCm Optiq, including timeline display settings, saved trace selections, added bookmarks/annotations, and more.
Note
These settings only apply to ROCm Systems Profiler trace projects. They don’t apply to ROCm Compute Profiler projects.
Set a time range filter#
Set a time range filter in the Timeline View to limit the data displayed to a specific period.
To set a time range filter, press and hold Ctrl while dragging your mouse in the Timeline View to select a range.
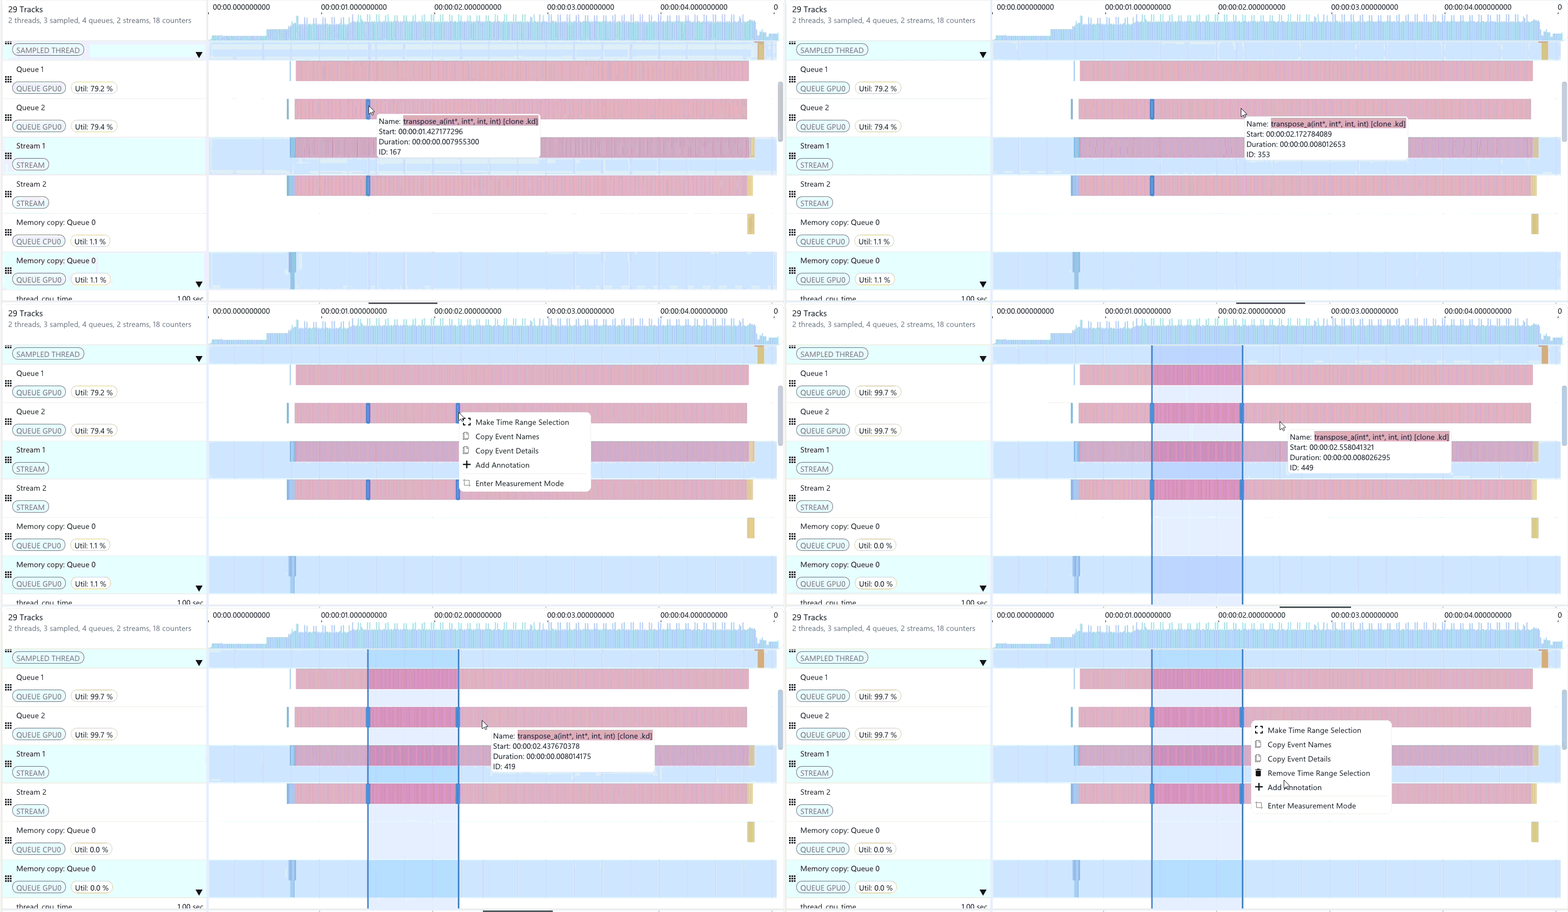
Once a time range is selected, the selection boundaries can be adjusted by dragging them. The active time range filter applies to event and sample counter details in the Advanced Details section.
If one or more events are selected, the Make Time Range Selection option displays on the timeline context menu when you right-click:
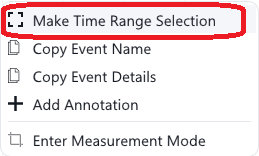
Selecting this sets a time-range filter with boundaries at the event’s start and end times, or at the first start time and last end time if multiple events are selected.
Tip
Press M for a shortcut to Make Time Range Selection when one or more events are selected.
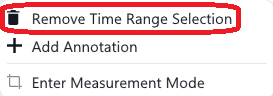
To clear the time range selection, press Esc or right-click and select Remove Selection:
Note
When a time-range filter is active, all events intersecting that time-range remain at full brightness; events outside the range are dimmed.
Save trace selections#
When there’s an active time range filter, select Edit > Save Trace Selection to trim the trace:
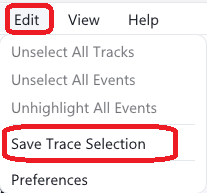
This creates a new trace file containing only the events in the filter.
Add an annotation#
Annotations are customized notes you can add to any area of the Timeline View.
To add an annotation:
Click + from the Annotations section of the toolbar:
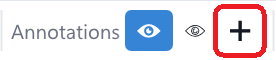
Annotations can also be added by right-clicking on the Timeline View and clicking the Add Annotation context menu option.
The Annotation dialog displays. Provide a title and your note, then click the X button to close the note and create the annotation.
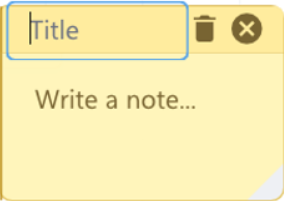
Once saved, the annotation displays as a marker that can be expanded on the timeline.
Annotations are track-bound and follow their tracks when scrolling, reordering, or rearranging the timeline. Expanded notes open as movable floating windows with inline editing; empty notes are discarded automatically. A time guide line appears while a note is hovered or dragged.
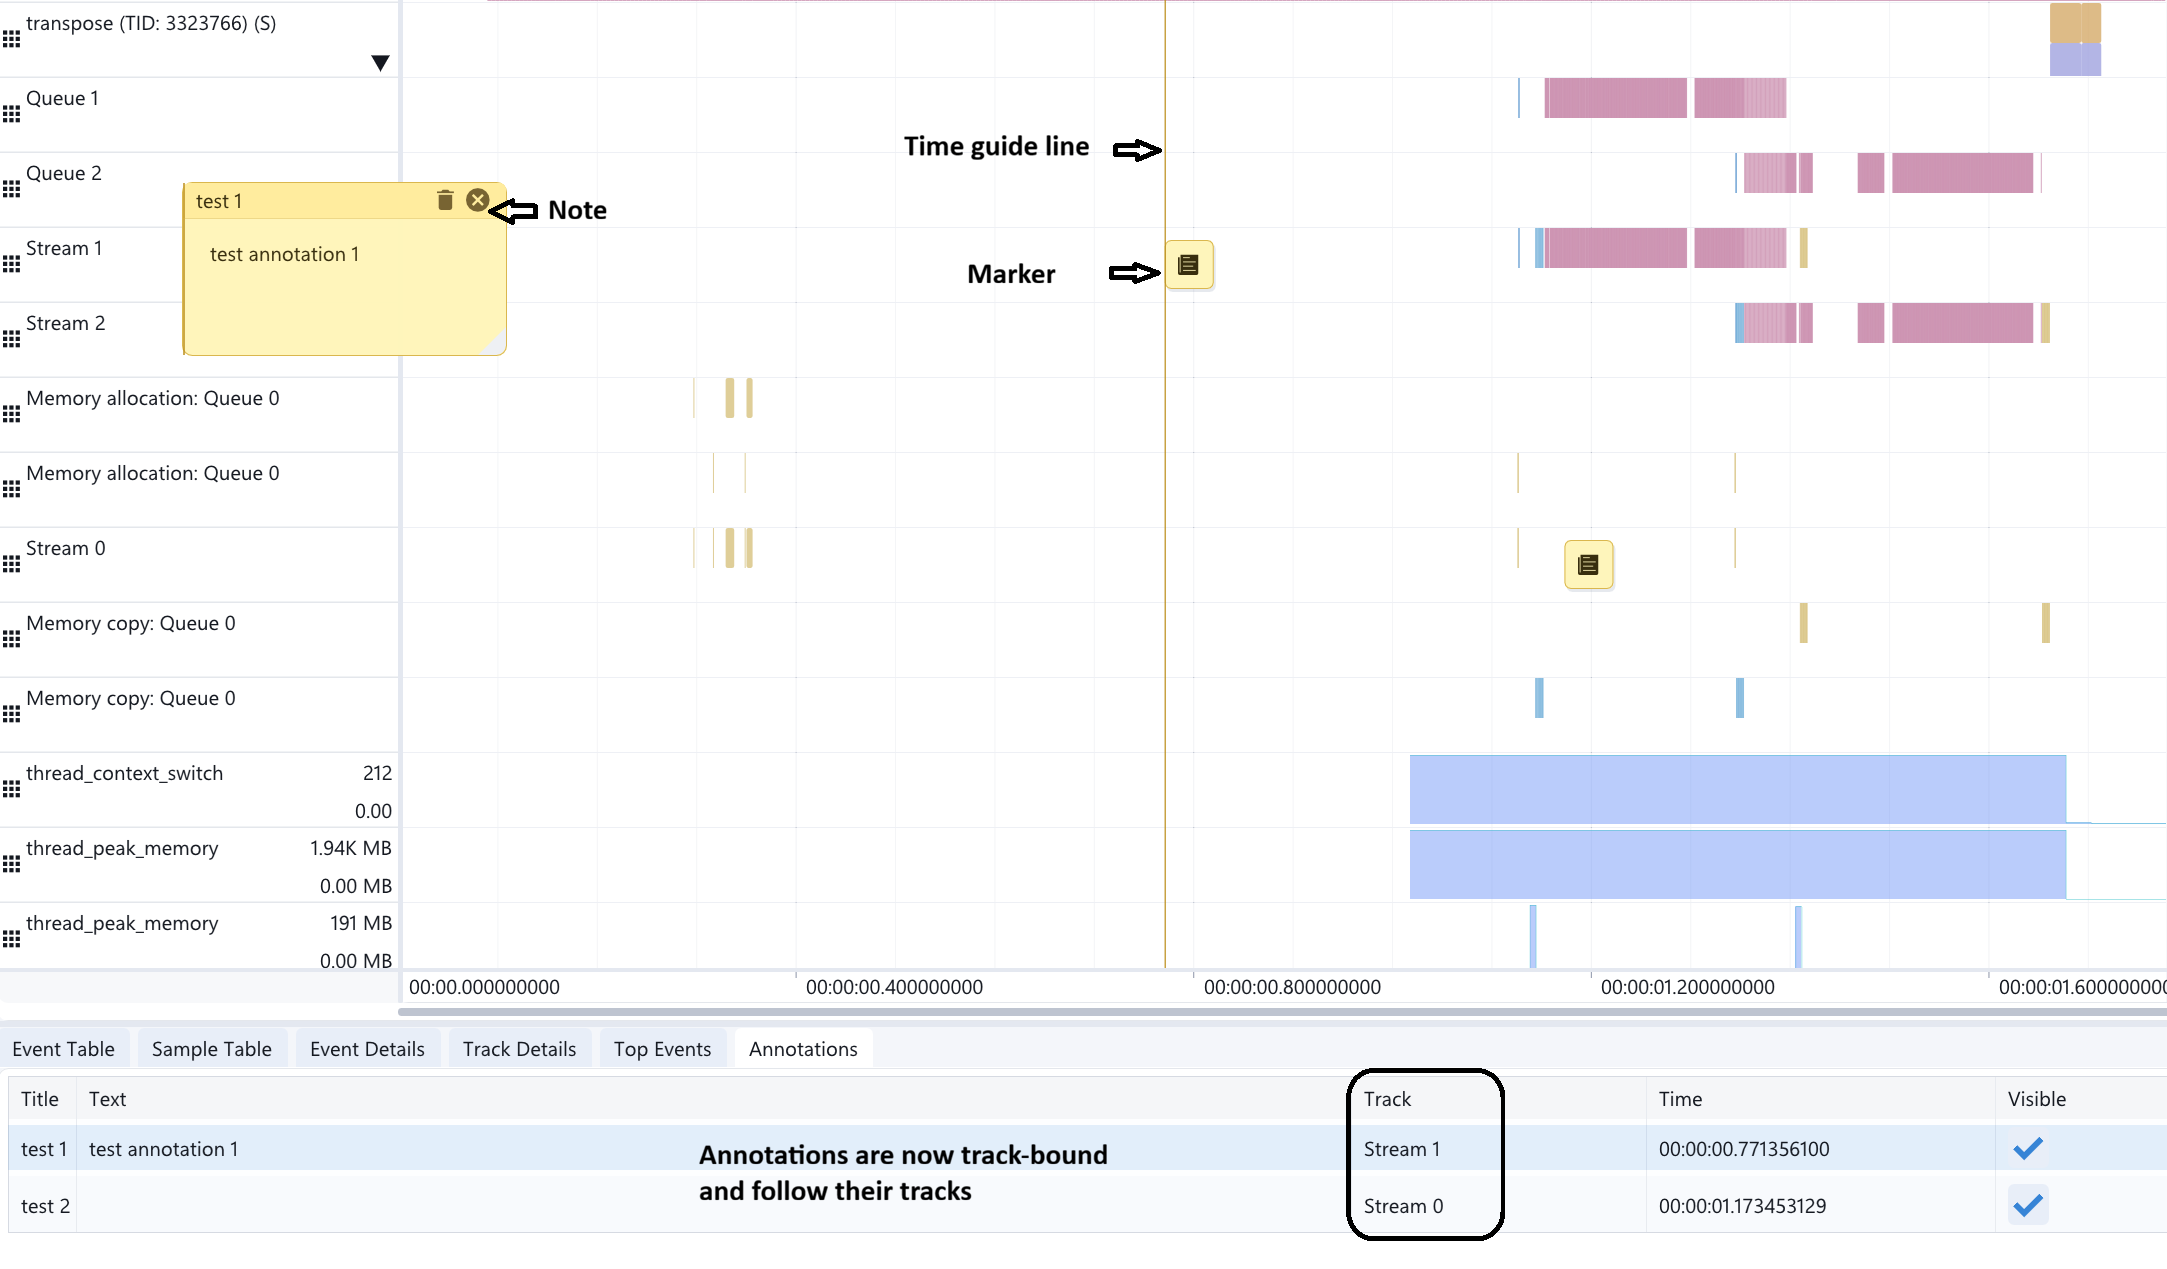
The Annotations tab in the Advanced Details section shows a list of annotations. Each row shows the annotation title, the note, the track it is attached to, its start time, and a checkbox for visibility. Clicking a row brings the selected annotation into view on the timeline.
Tip
Edit or delete the annotation by clicking
 .
.View the complete list of annotations in the Annotations tab of the Advanced Details section.
Check the Visibility option in the Annotations tab to toggle the visibility of individual annotations.
Clicking a row in the annotations list displays the selected annotation.
Create bookmarks#
The current view on the timeline (scroll and zoom position) can be saved to a bookmark for quick navigation.
To create and use a bookmark:
Click + in the
 menu from the main Toolbar.
Select the bookmark number to navigate to it.
Or:
Press Ctrl + any key from 0 - 9 to create a view bookmark. The bookmark saves to an index based on the number used and creates a shortcut.
Press any key from 0 - 9 to restore the view to a stored bookmark from that index number shortcut. For example, if you save a bookmark using Ctrl + 1, pressing 1 restores that bookmark.
Delete bookmarks#
Use the following actions to delete bookmarks or reset the view.
To delete a bookmark, click X to delete a bookmark from the
menu.Click Reset View to return the Timeline View to its original pan and zoom settings.
Customize timeline display options#
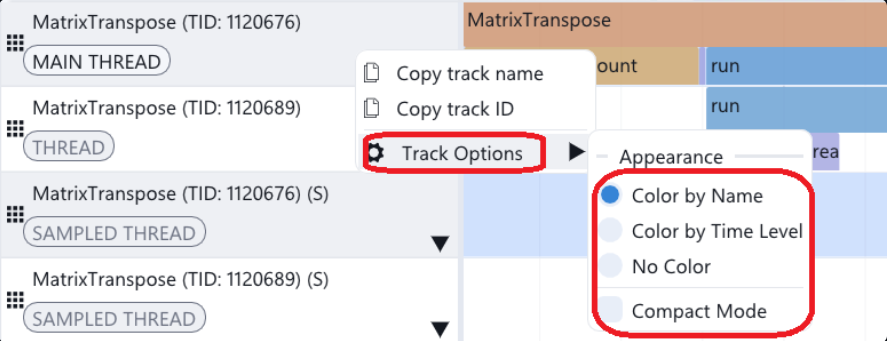
Customize display options for each track by right clicking the Description area to open the track’s context menu. Select Track Options to customize the track’s display options.
For event tracks, you can toggle between Color by Name, Color by Time Level, No Color, and Compact mode.
Color by Name: All events with the same name share a color.
Color by Time Level: Events with the same name but different start times have different colors.
No Color: Events render without name-based coloring.
Compact mode: Shrink event track heights to display tall flame graphs in a smaller area.
For sample counter tracks, you can toggle between Show Counter Boxes, Alternate Counter Coloring, and Highlight Y Range:
Show Counter Boxes: Display as a line only, or fill the area under the line as well.
Alternate Counter Coloring: If the area under the line is filled, alternate the fill color for each sample.
Highlight Y Range: Select an area of the graph to highlight. Choose the minimum and maximum range that you want to highlight. The tool highlights these values on the track region.
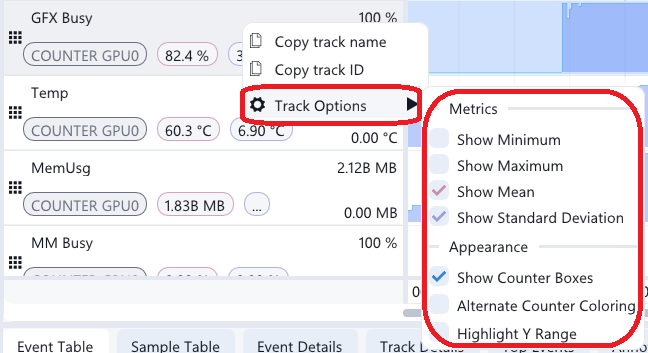
For sample counter tracks, you can set the min and max when showing the tracks:
Click on the value beside the min and max to set/change the scale range.
Click
 to restore the values to their default.

Tip
The context menu when right-clicking a track’s description in Timeline View also provides Copy track name and Copy track ID.
Set the flow rendering display mode#
Use the Flow buttons on the toolbar to show and hide flow information on the Timeline View, or change the flow display mode from Render (fan) to Chain mode.
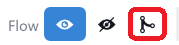
Chain mode displays events in a linked sequence, emphasizing dependencies and execution order. This is useful when analyzing how operations are chained together across queues or streams.

Render mode shows events in a fan-out style, highlighting parallelism and branching. This helps visualize concurrency and how multiple operations originate from a single source.

Note
Chain mode and Render mode are visualization modes for relations. They don’t represent the actual kernel scheduling flow.
Save a project file#
Persist the customizations made to tracks, bookmarks, and annotations by saving the session as a project (.rpv file).
Select File > Save As to create a new project.
Select File > Save to overwrite the currently opened project.
Remove Optiq-specific metadata from an open trace file#
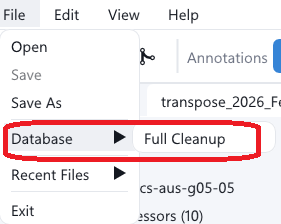
You can remove metadata added by ROCm Optiq during processing trace data by selecting File > Database > Full Cleanup.
Customize projects for ROCm Compute Profiler analysis data#
Presets#
Persist the pinned metric configurations for the Table View and Baseline Comparison by saving them as a preset. To do this, go to Presets, enter a preset name into the New Preset Name field, then click  .
.
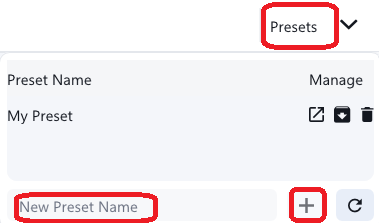
After a preset is saved, you can:
Recall it by clicking
 in the preset’s row.
Overwrite it by clicking
 .
.Delete it by clicking
 .
.