Third party integration#
This section lists available third-party plugins for the RDC tool such as Prometheus, Grafana, and Reliability, Availability and Serviceability (RAS).
Python bindings#
The RDC tool provides a generic Python class RdcReader, which simplifies telemetry gathering by providing the following functionalities:
RdcReadercreates the necessary groups and fieldgroups, watch the fields, and fetch the fields for the telemetry fields specified by the user.RdcReadercan support embedded and standalone mode. The standalone mode can be with or without authentication.In standalone mode, the
RdcReadercan automatically reconnect tordcdif the connection is lost.Restarting
rdcdcan lead to loss of previously created group and fieldgroup. TheRdcReadercan recreate them and watch the fields after reconnecting.If the client is restarted,
RdcReadercan detect the previously created groups and fieldgroups and avoid recreating them.A custom unit converter can be passed to
RdcReaderto override the default RDC unit.
Here is a sample program to monitor the power and GPU utilization using the RdcReader:
from RdcReader import RdcReader
from RdcUtil import RdcUtil
from rdc_bootstrap import *

default_field_ids = [
        rdc_field_t.RDC_FI_POWER_USAGE,
        rdc_field_t.RDC_FI_GPU_UTIL
]

class SimpleRdcReader(RdcReader):
    def __init__(self):
        RdcReader.__init__(self,ip_port=None, field_ids = default_field_ids, update_freq=1000000)
    def handle_field(self, gpu_index, value):
        field_name = self.rdc_util.field_id_string(value.field_id).lower()
        print("%d %d:%s %d" % (value.ts, gpu_index, field_name, value.value.l_int))

if __name__ == '__main__':
    reader = SimpleRdcReader()
while True:
      time.sleep(1)
        reader.process()
In the sample program,
Class
SimpleRdcReaderis derived from theRdcReader.The field
ip_port=NoneinRdcReaderdictates that RDC runs in the embedded mode.SimpleRdcReader::process()fetches fields specified indefault_field_ids.
Note
RdcReader.py can be found in the python_binding folder located at RDC install path.
To run the example, use:
# Ensure that RDC shared libraries are in the library path and
# RdcReader.py is in PYTHONPATH

$ python SimpleReader.py
Prometheus plugin#
The Prometheus plugin helps to monitor events and send alerts. Prometheus installation and integration details are explained in the following sections.
Prometheus plugin installation#
RDC’s Prometheus plugin rdc_prometheus.py can be found in the python_binding folder.
Here are the steps to install Prometheus:
Install Prometheus client:
$ pip install prometheus_client
Run the Prometheus plugin:
$ python rdc_prometheus.py
Verify plugin:
$ curl localhost:5000

gpu_util{gpu_index="0"} 0.0
gpu_clock{gpu_index="0"} 300.0
gpu_memory_total{gpu_index="0"} 4294.0
power_usage{gpu_index="0"} 9.0
gpu_memory_usage{gpu_index="0"} 134.0
By default, the plugin runs in the standalone mode and connects to rdcd at localhost:50051 to fetch fields. Ensure that the plugin uses the same authentication mode as rdcd, for example, if rdcd runs with -u/--unauth option, the plugin must also use --rdc_unauth option.
Useful options:
To run the plugin in unauthenticated mode, use the
--rdc_unauthoption.To use the plugin in the embedded mode without
rdcd, set the--rdc_embeddedoption.To override the default fields that are monitored, use the
--rdc_fieldsoption to specify the list of fields.To fetch field’s list from a file conveniently, use the
--rdc_fields_fileoption, if the field’s list is long.To control how the fields are cached, use the
max_keep_ageandmax_keep_samplesoptions.To see the metrics of the plugin itself, including the plugin process CPU, memory, file descriptor usage, native threads count, process start and uptimes, set
--enable_plugin_monitoringoption.
To view the options provided with the plugin, use --help.
% python rdc_prometheus.py --help
usage: rdc_prometheus.py [-h] [--listen_port LISTEN_PORT] [--rdc_embedded]
  [--rdc_ip_port RDC_IP_PORT] [--rdc_unauth]
  [--rdc_update_freq RDC_UPDATE_FREQ]
  [--rdc_max_keep_age RDC_MAX_KEEP_AGE]
  [--rdc_max_keep_samples RDC_MAX_KEEP_SAMPLES]
  [--rdc_fields RDC_FIELDS [RDC_FIELDS ...]]
  [--rdc_fields_file RDC_FIELDS_FILE]
  [--rdc_gpu_indexes RDC_GPU_INDEXES [RDC_GPU_INDEXES ...]]
  [--enable_plugin_monitoring]

RDC Prometheus plugin.

optional arguments:
  -h, --help  show this help message and exit
  --listen_port LISTEN_PORT
  The listen port of the plugin (default: 5000)
  --rdc_embedded  Run RDC in embedded mode (default: standalone mode)
  --rdc_ip_port RDC_IP_PORT
  The rdcd IP and port in standalone mode (default:
  localhost:50051)
  --rdc_unauth  Set this option if the rdcd is running with unauth in
  standalone mode (default: false)
  --rdc_update_freq RDC_UPDATE_FREQ
  The fields update frequency in seconds (default: 10))
  --rdc_max_keep_age RDC_MAX_KEEP_AGE
  The max keep age of the fields in seconds (default:
  3600)
  --rdc_max_keep_samples RDC_MAX_KEEP_SAMPLES
  The max samples to keep for each field in the cache
  (default: 1000)
  --rdc_fields RDC_FIELDS [RDC_FIELDS ...]
  The list of fields name needs to be watched, for
  example, " --rdc_fields RDC_FI_GPU_TEMP
  RDC_FI_POWER_USAGE " (default: fields in the
  plugin)
  --rdc_fields_file RDC_FIELDS_FILE
  The list of fields name can also be read from a file
  with each field name in a separated line (default:
  None)
  --rdc_gpu_indexes RDC_GPU_INDEXES [RDC_GPU_INDEXES ...]
  The list of GPUs to be watched (default: All GPUs)
  --enable_plugin_monitoring
  Set this option to collect process metrics of
  the plugin itself (default: false)
Prometheus integration#
To integrate Prometheus plugin in RDC, follow these steps:
Download and install Prometheus plugin in the management machine.
Configure Prometheus targets:
Use the example configuration file
rdc_prometheus_example.ymlin thepython_bindingfolder. This file refers toprometheus_targets.json. Modifyprometheus_targets.jsonto point to your compute nodes. Ensure that this is modified to point to the correct compute nodes.// Sample file: prometheus_targets.json // Replace rdc_test*.amd.com to point the correct compute nodes // Add as many compute nodes as necessary [ { "targets": [ "rdc_test1.amd.com:5000", "rdc_test2.amd.com:5000" ] } ]
Note
In the above example, there are two compute nodes,
rdc_test1.adm.comandrdc_test2.adm.com. Ensure that the Prometheus plugin is running on those compute nodes.Start the Prometheus plugin.
% prometheus --config.file=<full path of the rdc_prometheus_example.yml>
From the management node, open the URL http://localhost:9090 in the browser.
Select one of the available metrics.
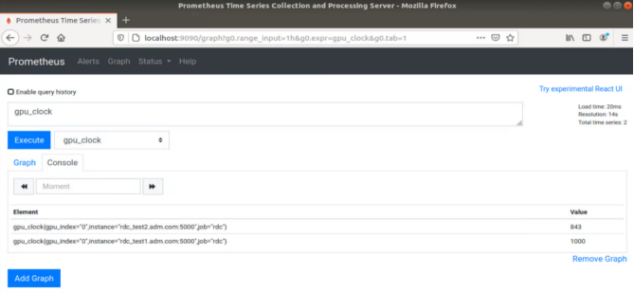
Fig. 4 Prometheus image showing GPU clock for both rdc_test1 and rdc_test2.#
Grafana plugin#
Grafana is a common monitoring stack used for storing and visualizing time series data. Prometheus acts as the storage backend, and Grafana is used as the interface for analysis and visualization. Grafana has a plethora of visualization options and can be integrated with Prometheus for RDC’s dashboard.
Grafana plugin installation#
To install Grafana plugin, follow these steps:
Follow the instructions to install Grafana.
To start Grafana, use:
$ sudo systemctl start grafana-server
$ sudo systemctl status grafana-server
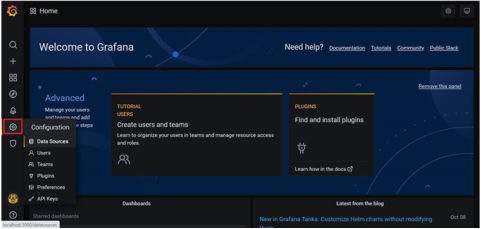
Open http://localhost:3000/ in the browser.
Login using the default username and password (
admin/admin) as shown in the following image:

Grafana integration#
As a prerequisite, ensure:
The RDC Prometheus plugin is running in each compute node.
Prometheus is set up to collect metrics from the plugin.
Grafana configuration#
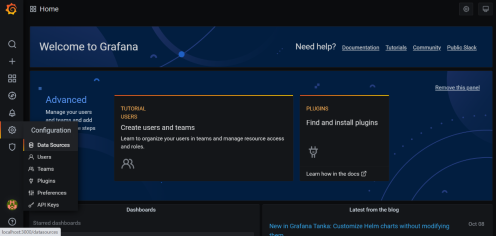
Firstly, add Prometheus as data source using the following steps:
Go to “Configuration”.
Select “Data Sources”.
Go to “Add data source”.
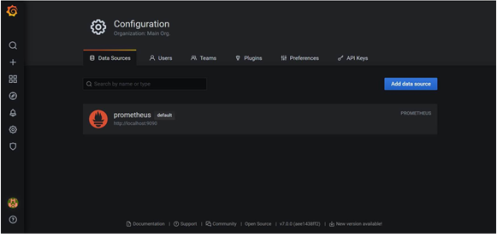
Select “Prometheus”.
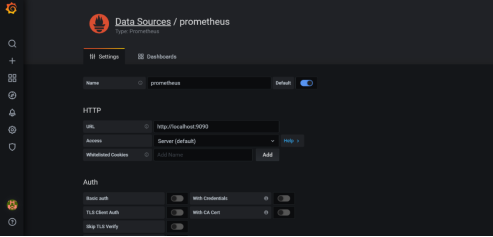
Note
Ensure the name of the data source is Prometheus. If Prometheus and Grafana are running on the same machine, use the default URL http://localhost:9090. Otherwise, ensure the URL matches the Prometheus URL, save, and test it.
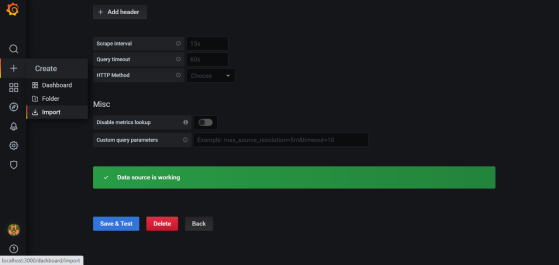
Then, import RDC dashboard using the following steps:
Go to “+” and select “Import”.
Upload
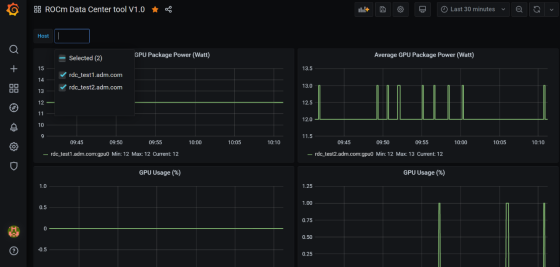
rdc_grafana_dashboard_example.jsonfrom thepython_bindingfolder.Select the desired compute node for visualization.
Prometheus (Grafana) integration with automatic node detection#
RDC provides Consul to discover the rdc_prometheus service automatically. Consul is a service mesh solution providing a fully featured control plane with service discovery, configuration, and segmentation functionality. For more information, see Consul.
RDC uses Consul for health checks of RDC’s integration with the Prometheus plugin (rdc_prometheus). These checks provide information on its efficiency.
With the Consul agent integration, a new compute node can be discovered automatically, which saves users from manually changing prometheus_targets.json to use Consul.
Installing the Consul agent for compute and management nodes#
To install the latest Consul agent for compute and management nodes, follow these steps:
To download and install the Consul agent, set up the
aptrepository:$ curl -fsSL https://apt.releases.hashicorp.com/gpg | sudo apt-key add - $ sudo apt-add-repository "deb [arch=amd64] https://apt.releases.hashicorp.com $(lsb_release -cs) main" $ sudo apt-get update && sudo apt-get install consul
Generate a key to encrypt the communication between Consul agents. The same key is used by both the compute and management nodes for communication.
$ consul keygen
For demonstration purposes, the following key is used in the configuration file:
$ consul keygen
4lgGQXr3/R2QeTi5vEp7q5Xs1KoYBhCsk9+VgJZZHAo=
Setting up the Consul server in management nodes#
While Consul can function with one server, it’s recommended to use three to five servers to avoid failure scenarios leading to data loss.
Note
For demonstration purposes, the configuration settings documented below are for a single server.
To set up Consul server, follow these steps:
Create a configuration file
/etc/consul.d/server.hcl.server = true encrypt = "<CONSUL_ENCRYPTION_KEY>" bootstrap_expect = 1 ui = true client_addr = "0.0.0.0" bind_addr = "<The IP address can be reached by client>"
Here is how to use the variables in the configuration file:
Run the agent in server mode by setting
servertotrue.Set
encryptto the key generated in the first step.The
bootstrap_expectvariable indicates the number of servers required to form the first Consul cluster. Set this variable to1to allow a cluster with a single server.The User Interface (
ui) variable when set totrueenables the Consul web UI.The
client_addrvariable is used to connect the API and UI.The
bind_addrvariable is used to connect the client to the server. If you have multiple private IP addresses, use the address that can connect to a client.
Start the agent.
$ sudo consul agent -config-dir=/etc/consul.d/
Browse to http://localhost:8500/ on the management node to see a single instance running.
Setting up the Consul client in compute nodes#
To set up Consul client, follow these steps:
Create a configuration file
/etc/consul.d/client.hcl.server = false encrypt = "<CONSUL_ENCRYPTION_KEY>" retry_join = ["<The consul server address>"] client_addr = "0.0.0.0" bind_addr = "<The IP address can reach server>"
Note
Use the same
CONSUL_ENCRYPTION_KEYas the servers. In theretry_join, use the IP address of the management nodes.Start the Consul agent.
$ sudo consul agent -config-dir=/etc/consul.d/
To see if the client has joined the Consul, use:
$ consul members
Node              Address           Status  Type    Build  Protocol  DC   Segment
management-node   10.4.22.70:8301   alive   server  1.9.3  2    dc1  <all>
compute-node      10.4.22.112:8301  alive   client  1.9.3  2    dc1  <default>
Set up the Consul client to monitor the health of the RDC Prometheus plugin.
Start the RDC Prometheus plugin.
$ python rdc_prometheus.py --rdc_embedded
Add the configuration file
/etc/consul.d/rdc_prometheus.hcl.{ "service": { "name": "rdc_prometheus", "tags": [ "rdc_prometheus", "rdc" ], "port": 5000, "check": { "id": "rdc_plugin", "name": "RDC Prometheus plugin on port 5000", "http": "http://localhost:5000", "method": "GET", "interval": "15s", "timeout": "1s" } } }
Note
By default, the Prometheus plugin uses port 5000. If you don’t use the default setting, change the configuration file accordingly.
After updating the configuration file, restart the Consul client agent.
$ sudo consul agent -config-dir=/etc/consul.d/
Enable the Prometheus integration in the management node.
In the management node, inspect the service.
$ consul catalog nodes -service=rdc_prometheus

Node              ID        Address      DC
compute-node      76694ab1  10.4.22.112  dc1
Create a new Prometheus configuration
rdc_prometheus_consul.ymlfile for the Consul integration.global: scrape_interval: 15s # Set the scrape interval to every 15 seconds. Default is every 1 minute. evaluation_interval: 15s # Evaluate rules every 15 seconds. The default is every 1 minute. scrape_configs: - job_name: 'consul' consul_sd_configs: - server: 'localhost:8500' relabel_configs: - source_labels: [__meta_consul_tags] regex: .*,rdc,.* action: keep - source_labels: [__meta_consul_service] target_label: job
Note
When running the Consul server and Prometheus on the same machine, change the server under
consul_sd_configsto your Consul server address.Start Prometheus.
$ ./prometheus --config.file="rdc_prometheus_consul.yml"
Browse the Prometheus UI at http://localhost:9090 on the management node and query RDC Prometheus metrics. Ensure that the plugin starts before running the query.
Reliability, Availability, and Serviceability plugin#
The Reliability, Availability, and Serviceability plugin (RAS) plugin helps to monitor and count ECC (Error-Correcting Code) errors. The following sections provide information on integrating RAS with RDC.
RAS plugin installation#
With the RAS feature enabled in the graphic card, you can use RDC to monitor RAS errors.
Prerequisite#
Ensure that the GPU supports RAS.
Note
The RAS library is installed as part of the RDC installation. No additional configuration is required for RDC.
RDC installation dynamically loads the RAS library
librdc_ras.so. The configuration files required by the RAS library are installed in thesp3andconfigfolders.% ls /opt/rocm-4.2.0/rdc/lib ... librdc_ras.so ... ... sp3 ... config ...
RAS integration#
RAS exposes a list of ECC correctable and uncorrectable errors for different IP blocks and helps to troubleshoot issues.
Example:
$ rdci dmon -i 0 -e 600,601
Where, the dmon command monitors GPU index 0, and fields 600 and 601, where 600 is the field ID for the ECC_CORRECT counter and 601 for the ECC_UNCORRECT counter.
% rdci dmon -l
... ...
600 RDC_FI_ECC_CORRECT_TOTAL   : Accumulated Single Error Correction
601 RDC_FI_ECC_UNCORRECT_TOTAL : Accumulated Double Error Detection
602 RDC_FI_ECC_SDMA_CE         : SDMA Correctable Error
603 RDC_FI_ECC_SDMA_UE         : SDMA Uncorrectable Error
604 RDC_FI_ECC_GFX_CE          : GFX Correctable Error
605 RDC_FI_ECC_GFX_UE          : GFX Uncorrectable Error
606 RDC_FI_ECC_MMHUB_CE        : MMHUB Correctable Error
607 RDC_FI_ECC_MMHUB_UE        : MMHUB Uncorrectable Error
608 RDC_FI_ECC_ATHUB_CE        : ATHUB Correctable Error
609 RDC_FI_ECC_ATHUB_UE        : ATHUB Uncorrectable Error
610 RDC_FI_ECC_PCIE_BIF_CE     : PCIE_BIF Correctable Error
611 RDC_FI_ECC_PCIE_BIF_UE     : PCIE_BIF Uncorrectable Error
612 RDC_FI_ECC_HDP_CE          : HDP Correctable Error
613 RDC_FI_ECC_HDP_UE          : HDP Uncorrectable Error
614 RDC_FI_ECC_XGMI_WAFL_CE    : XGMI WAFL Correctable Error
615 RDC_FI_ECC_XGMI_WAFL_UE    : XGMI WAFL Uncorrectable Error
616 RDC_FI_ECC_DF_CE           : DF Correctable Error
617 RDC_FI_ECC_DF_UE           : DF Uncorrectable Error
618 RDC_FI_ECC_SMN_CE          : SMN Correctable Error
619 RDC_FI_ECC_SMN_UE          : SMN Uncorrectable Error
620 RDC_FI_ECC_SEM_CE          : SEM Correctable Error
621 RDC_FI_ECC_SEM_UE          : SEM Uncorrectable Error
622 RDC_FI_ECC_MP0_CE          : MP0 Correctable Error
623 RDC_FI_ECC_MP0_UE          : MP0 Uncorrectable Error
624 RDC_FI_ECC_MP1_CE          : MP1 Correctable Error
625 RDC_FI_ECC_MP1_UE          : MP1 Uncorrectable Error
626 RDC_FI_ECC_FUSE_CE         : FUSE Correctable Error
627 RDC_FI_ECC_FUSE_UE         : FUSE Uncorrectable Error
628 RDC_FI_ECC_UMC_CE          : UMC Correctable Error
629 RDC_FI_ECC_UMC_UE          : UMC Uncorrectable Error
630 RDC_FI_ECC_MCA_CE          : MCA Correctable Error
631 RDC_FI_ECC_MCA_UE          : MCA Uncorrectable Error
632 RDC_FI_ECC_VCN_CE          : VCN Correctable Error
633 RDC_FI_ECC_VCN_UE          : VCN Uncorrectable Error
634 RDC_FI_ECC_JPEG_CE         : JPEG Correctable Error
635 RDC_FI_ECC_JPEG_UE         : JPEG Uncorrectable Error
636 RDC_FI_ECC_IH_CE           : IH Correctable Error
637 RDC_FI_ECC_IH_UE           : IH Uncorrectable Error
638 RDC_FI_ECC_MPIO_CE         : MPIO Correctable Error
639 RDC_FI_ECC_MPIO_UE         : MPIO Uncorrectable Error
... ...
To access the ECC correctable and uncorrectable error counters, use:
% rdci dmon -i 0 -e 600,601

GPU     ECC_CORRECT         ECC_UNCORRECT
0       0                   0
0       0                   0
0       0                   0