Data Center Tool: Feature Overview#
Note that RDC Tool is in active development. This section highlights the current feature set.
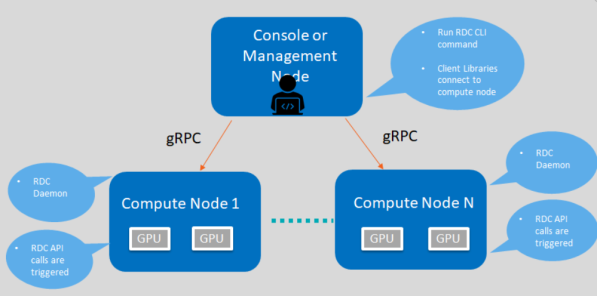
RDC components and framework for describing features
Discovery#
The Discovery feature enables you to locate and display information of GPUs present in the compute node.
Example:
$ rdci discovery <host_name> -l
 2 GPUs found
GPU Index |
Device Information |
|---|---|
0 |
Name: AMD Radeon Instinct™ MI50 Accelerator |
1 |
Name: AMD Radeon Instinct™ MI50 Accelerator |
$ rdci -l : list available GPUs
$ rdci -u: No SSL authentication
Groups#
This section explains the GPU and field groups features.
GPU Groups#
With the GPU groups feature, you can create, delete, and list logical groups of GPU.
$ rdci group -c GPU_GROUP
Successfully created a group with a group ID 1

$ rdci group -g 1 -a 0,1
Successfully added the GPU 0,1 to group 1

$ rdci group –l

1 group found
Group ID |
Group Name |
GPU Index |
|---|---|---|
1 |
GPU_GROUP |
0, 1 |
$ rdci group -d 1
Successfully removed group 1

-c create; –g group id; –a add GPU index; –l list; -d delete group
Field Groups#
The Field Groups feature provides you the options to create, delete, and list field groups.
$ rdci fieldgroup -c <fgroup> -f 150,155
Successfully created a field group with a group ID 1

$ rdci fieldgroup -l

1 group found
Group ID |
Group Name |
Field Ids |
|---|---|---|
1 |
Fgroup |
150, 155 |
$ rdci fieldgroup -d 1
Successfully removed field group 1

rdci dmon –l
Supported fields Ids:
100 RDC_FI_GPU_CLOCK:  Current GPU clock freq.
150 RDC_FI_GPU_TEMP:  GPU temp. in milli Celsius.
155 RDC_FI_POWER_USAGE:  Power usage in microwatts.
203 RDC_FI_GPU_UTIL:  GPU busy percentage.
525 RDC_FI_GPU_MEMORY_USAGE: VRAM Memory usage in bytes

-c create; –g group id; –a add GPU index; –l list; -d delete group
Monitor Errors#
You can define RDC_FI_ECC_CORRECT_TOTAL or RDC_FI_ECC_UNCORRECT_TOTAL field to get the RAS Error-Correcting Code (ECC) counter:
• 312 RDC_FI_ECC_CORRECT_TOTAL: Accumulated correctable ECC errors
• 313 RDC_FI_ECC_UNCORRECT_TOTAL: Accumulated uncorrectable ECC errors
Device Monitoring#
The RDC Tool enables you to monitor the GPU fields.
$ rdci dmon -f <field_group> -g <gpu_group> -c 5 -d 1000


1 group found
GPU Index |
TEMP (m°C) |
POWER (µW) |
|---|---|---|
0 |
25000 |
520500 |
rdci dmon –l
Supported fields Ids:
100 RDC_FI_GPU_CLOCK:  Current GPU clock freq.
150 RDC_FI_GPU_TEMP:  GPU temp. in milli Celsius.
155 RDC_FI_POWER_USAGE:  Power usage in microwatts.
203 RDC_FI_GPU_UTIL:  GPU busy percentage.
525 RDC_FI_GPU_MEMORY_USAGE: VRAM Memory usage in bytes

-e field ids; -i GPU index; -c count; -d delay; -l list; -f fieldgroup id
Job Stats#
You can display GPU statistics for any given workload.
$ rdci stats -s 2 -g 1
Successfully started recording job 2 with a group ID 1

$ rdci stats -j 2
Summary |
Executive Status |
|---|---|
Start time |
1586795401 |
End time |
1586795445 |
Total execution time |
44 |
——————————— |
—————————- |
Energy Consumed (Joules) |
21682 |
Power Usage (Watts) |
Max: 49 Min: 13 Avg: 34 |
GPU Clock (MHz) |
Max: 1000 Min: 300 Avg: 903 |
GPU Utilization (%) |
Max: 69 Min: 0 Avg: 2 |
Max GPU Memory Used (bytes) |
524320768 |
Memory Utilization (%) |
Max: 12 Min: 11 Avg: 12 |
$ rdci stats -x 2
Successfully stopped recording job 2

-s start recording on job id; -g group id; -j display job stats; –x stop recording.
Job Stats Use Case#
A common use case is to record GPU statistics associated with any job or workload. The following example shows how all these features can be put together for this use case:
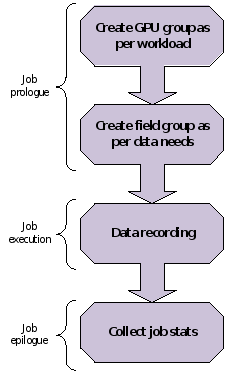
An example showing how job statistics can be recorded
rdci commands
$ rdci group -c group1

successfully created a group with a group ID 1

$ rdci group -g 1 -a 0,1

GPU 0,1 is added to group 1 successfully.

rdci stats -s 123 -g 1

job 123 recorded successfully with the group ID

rdci stats -x 123

job 123 stops recording successfully

rdci stats -j 123

job stats printed
Error-Correcting Code Output#
In the job output, this feature prints out the Error-Correcting Code (ECC) errors while running the job.
Diagnostic#
You can run diagnostic on a GPU group as shown below:
$ rdci diag -g <gpu_group>

No compute process:  Pass
Node topology check:  Pass
GPU parameters check:  Pass
Compute Queue ready:  Pass
System memory check:  Pass
 =============== Diagnostic Details ==================
No compute process:  No processes running on any devices.
Node topology check:  No link detected.
GPU parameters check:  GPU 0 Critical Edge temperature in range.
Compute Queue ready:  Run binary search task on GPU 0 Pass.
System memory check:  Max Single Allocation Memory Test for GPU 0 Pass. CPUAccessToGPUMemoryTest for GPU 0 Pass. GPUAccessToCPUMemoryTest for GPU 0 Pass.