Generate AMD Instinct GPU cluster health reports with Cluster Validation Suite (CVS)#
2026-09-24
3 min read time
Health reports run cvs monitor check_cluster_health from the head node. CVS SSHs to each compute node, collects GPU/NIC counters and logs, and writes a self-contained HTML report. No agents or exporters are installed on the cluster.
The monitor identifies hardware degradation (RAS, PCIe/XGMI, RDMA counters via AMD SMI) and software failures (dmesg and journalctl signatures). Use it before a test campaign, after a change, or to snapshot counters while workloads run and compare deltas across nodes.
Generate a health report#
Complete Install CVS and Set up a cluster file.
List available monitors:
cvs monitorView help:
cvs monitor check_cluster_health --help
Run the monitor:
Option
Description
--cluster_file PATHCluster JSON (same file as
cvs run/cvs exec). Takes precedence overCLUSTER_FILE.--iterations NNumber of sampling iterations
--time_between_iters SECONDSSleep between iterations
--report_file PATHOutput HTML path (default:
cluster_report.htmlin the current directory)Example:
cvs monitor check_cluster_health \
  --cluster_file ~/cvs_workspace/cluster.json \
  --iterations 2
Or set
CLUSTER_FILEonce:export CLUSTER_FILE=~/cvs_workspace/cluster.json cvs monitor check_cluster_health --iterations 2
Note
Deprecated flags
--hosts_file,--username,--key_file, and--passwordstill work; prefer--cluster_filefor consistency with other CVS commands.Open
cluster_report.htmlin a browser.
Review the health report#
The report includes GPU and NIC snapshots, historic error logs, and per-iteration deltas for triage. Anomalies are highlighted in tables (PCIe, RDMA, GPU errors, cable issues, kernel logs).
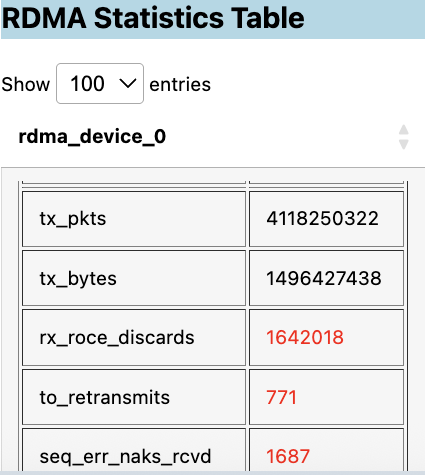
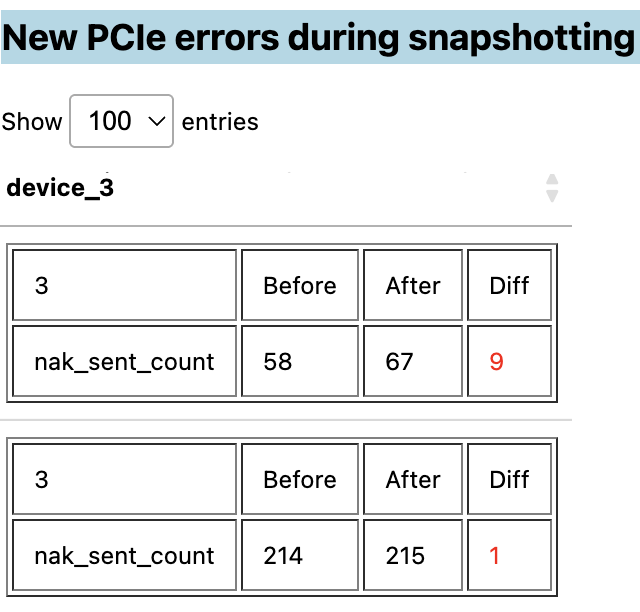
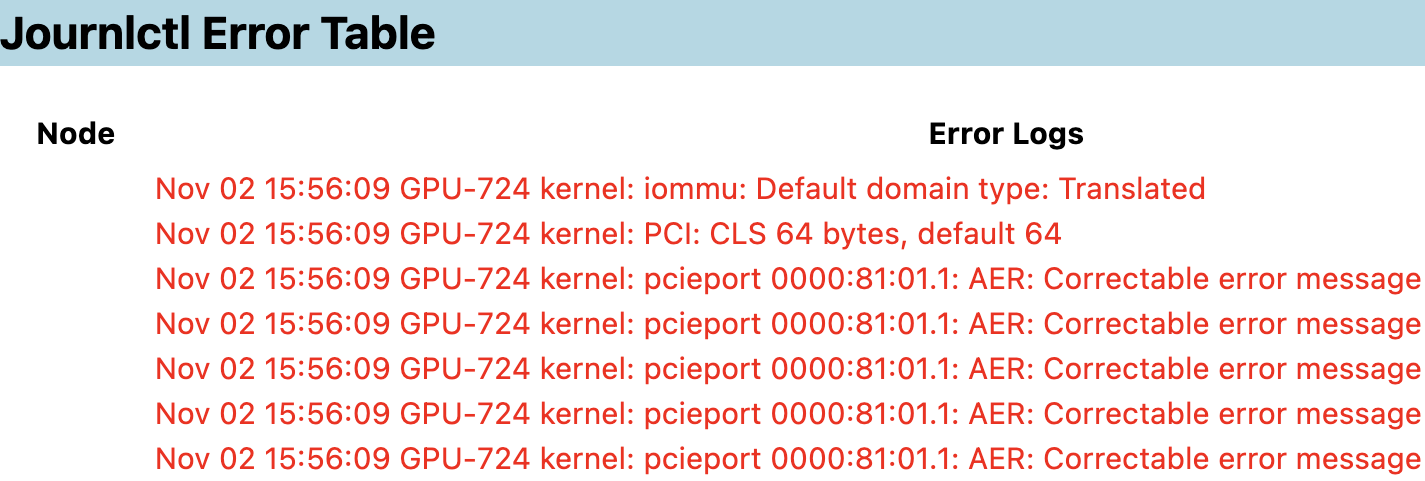
Metrics are collected with AMD SMI, ethtool, and rdma utilities on each node. See the AMD SMI CLI reference for field definitions.
For live dashboards instead of one-off HTML reports, see Live AMD Instinct GPU cluster dashboards with Cluster Validation Suite (CVS).