TransferBench timing#
TransferBench measures performance at three nested levels: Test, Executor, and Transfer. Each level captures a different scope of elapsed time, and the timing method used depends on the executor type.
Timing levels#
The following diagram illustrates the three levels of timing:
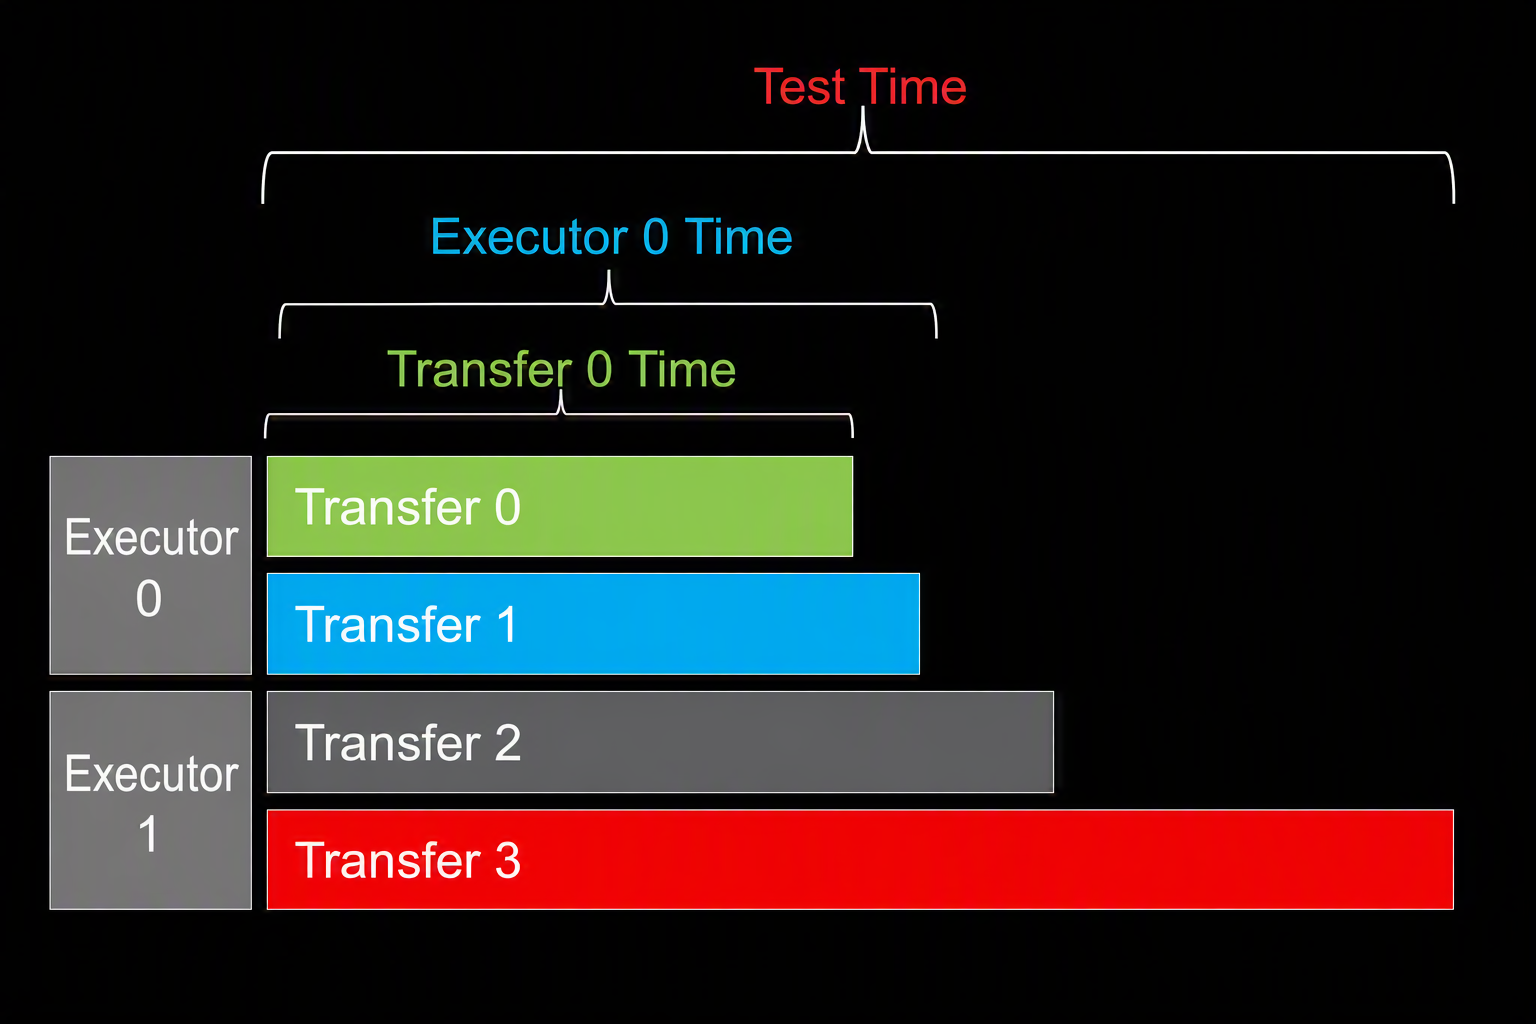
The following table provides a quick summary of the three timing levels:
Timing level |
What it measures |
How it is timed |
|---|---|---|
Test |
All transfers across all executors and all ranks |
CPU wall-clock ( |
Executor |
All transfers that run on this executor |
Varies by executor type (see Timing methods) |
Transfer |
A single transfer |
Varies by executor type (see Timing methods) |
Timing methods#
The timing method used for each Executor and transfer depends on the Executor type and the value of
USE_HIP_EVENTS.
Executor timing#
Executor type |
Timing method |
|---|---|
CPU |
CPU wall-clock ( |
GFX / DMA |
For For |
NIC |
CPU wall-clock ( |
Transfer timing#
Executor type |
Timing method |
|---|---|
CPU |
CPU wall-clock ( |
GFX |
For For |
DMA |
For For |
NIC |
CPU wall-clock ( |
Overhead#
Overhead is the difference between the total CPU wall-clock time (Test time) and the elapsed time of the slowest Executor:
Overhead = Test Time - MAX(Executor 0 Time, Executor 1 Time, ...)
Overhead captures scheduling and synchronization costs that fall outside of Executor-measured time, such as barrier waits and thread management.
Example output#
The following example shows TransferBench output for a test with two Executors (CPU and GPU) and four transfers:
Test 1:
-------------------┬--------------┬------------┬-------------------┬--------------------
Executor: CPU 00   │  0.027 GB/s  │  77.492 ms │    2097152 bytes  │  4.489 GB/s (sum)
Executor 0 Time = 77.492 ms
-------------------┼--------------┼------------┼-------------------┼--------------------
    Transfer 0     │  4.476 GB/s  │   0.234 ms │    1048576 bytes  │  C0 -> C0:4 -> N
Transfer 0 Time =   0.234 ms
    Transfer 1     │  0.014 GB/s  │  77.359 ms │    1048576 bytes  │  G0 -> C0:4 -> N
Transfer 1 Time =  77.359 ms
-------------------┼--------------┼------------┼-------------------┼--------------------
Executor: GPU 00   │ 97.436 GB/s  │   0.689 ms │   67108864 bytes  │ 129.692 GB/s (sum)
Executor 1 Time = 0.689 ms
-------------------┼--------------┼------------┼-------------------┼--------------------
    Transfer 2     │ 80.886 GB/s  │   0.415 ms │   33554432 bytes  │  G0 -> G0:4 -> G0
Transfer 2 Time =   0.415 ms
    Transfer 3     │ 48.807 GB/s  │   0.687 ms │   33554432 bytes  │  G0 -> G0:4 -> G1
Transfer 3 Time =   0.687 ms
-------------------┼--------------┼------------┼-------------------┼--------------------
Aggregate (CPU)    │  0.891 GB/s  │  77.688 ms │   69206016 bytes  │  Overhead 0.197 ms
Test Time     = 77.688 ms
-------------------┴--------------┴------------┴-------------------┴--------------------
Overhead      = 77.688 - MAX(77.492, 0.689) = 0.197 ms
In this example:
Executor 0 (CPU) runs Transfers 0 and 1 and takes 77.492 ms (dominated by Transfer 1 at 77.359 ms).
Executor 1 (GPU) runs Transfers 2 and 3 and takes 0.689 ms.
Test Time is 77.688 ms, measured by the CPU wall-clock across all Executors.
Overhead is 0.197 ms, calculated as
77.688 - MAX(77.492, 0.689).