AMD ROCm Debugger for Windows#
2026-02-19
5 min read time
The AMD ROCm Debugger for Windows is an AMD source-level debugger based on the GNU Debugger (GDB). Windows ROCgdb is included in the HIP SDK installer from version 7.1.1, and enables heterogeneous debugging on the ROCm software that consists of an x86-based host architecture along with supported AMD GPUs. For Windows ROCgdb to functional properly the driver included with the HIP SDK package must be used.
Installation#
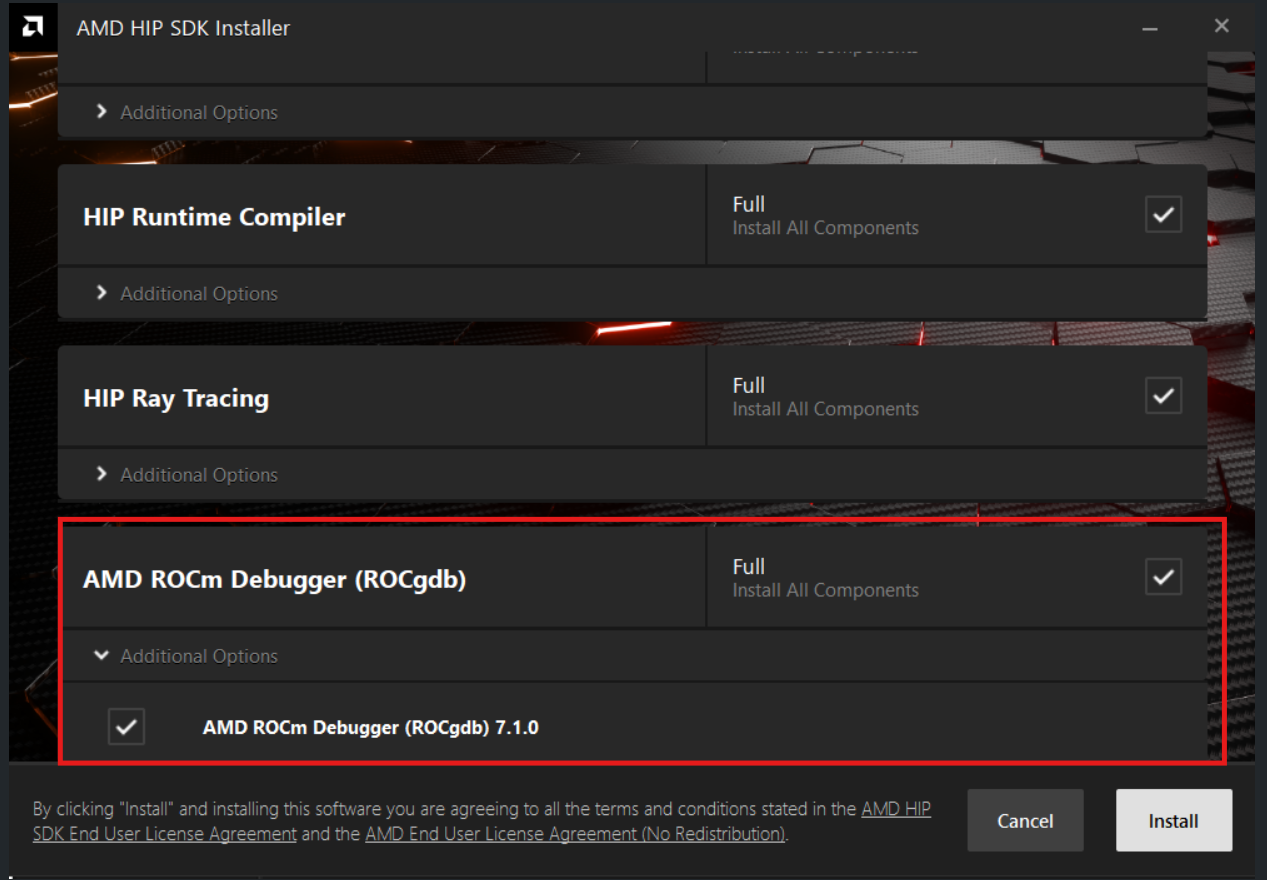
Windows ROCgdb can be installed by checking the “AMD ROCm Debugger (ROCgdb)” option (see below) during installation of the HIP SDK package.
Limitations#
ROCgdb on Windows has the following limitations currently:
Windows is supported only on the
gfx120xarchitectures (gfx1200andgfx1201).Multi-GPU configurations involving more than one AMD GPU are not supported.
Generating or loading AMD GPU core dumps is not supported on Windows.
Python scripting is not supported.
Due to an AMD HIP runtime limitation, it is not possible to pass intercepted signals (
SIGFPE,SIGSEGV, etc.) to the inferior, even if the user requests otherwise. Signals are always suppressed by the runtime.The HIPCC compiler on Windows defaults to producing PDB files containing CodeView debug information for the host code. ROCgdb does not support this debug format. To enable host code debugging, pass the
-gdwarf -Wl,-debug:dwarfoptions to HIPCC to generate DWARF debug information instead, which ROCgdb supports.The HIPCC compiler on Windows emits host code that targets the Microsoft x64 ABI conventions and MSVC C++ ABI. ROCgdb does not fully support these, which may lead to incorrect symbol names, misprinted C++ objects, and similar issues when debugging host code. These limitations do not affect debugging AMD GPU device-side code.
Hello World example#
Debugging GPU code with ROCgdb on Windows is just like on Linux, as you’ll see with this example.
Copy the following code to a file named
example.cppin a directory of your choice (for example,C:\rocgdb-example). The code contains a simple GPU kernel that adds two integers and returns the result. The result is printed on the console.#include <hip/hip_runtime.h> #include <assert.h> __global__ void do_an_addition(int a, int b, int *out) { *out = a + b; } int main () { int *result_ptr, result; /* Allocate memory for the device to write the result to. */ hipError_t error = hipMalloc(&result_ptr, sizeof(int)); assert(error == hipSuccess); /* Run `do_an_addition` on one block containing one HIP thread. */ do_an_addition<<<dim3(1), dim3(1), 0, 0>>>(1, 2, result_ptr); /* Copy result from device to host. This acts as a synchronization point, waiting for the kernel dispatch to complete. */ error = hipMemcpyDtoH(&result, result_ptr, sizeof(int)); assert(error == hipSuccess); printf("result is %d\n", result); assert(result == 3); return 0; }
Open a Windows Command Prompt. We will use this prompt to run the compiler and the debugger.
Put the HIP SDK bin directory in the PATH:
set "HIP_SDK_DIR=C:\Program Files\AMD\ROCm\7.1"
set "PATH=%HIP_SDK_DIR%\bin;%PATH%"
This makes the
hipccandrocgdbprograms available in the PATH.Switch the current directory to where you put the
example.cppsource file earlier:cd C:\rocgdb-exampleCompile the
example.cppHIP program usinghipcc:C:\rocgdb-example>hipcc example.cpp -o example.exe --offload-arch=gfx1201 -gdwarf -Wl,-debug:dwarf -O0Notes:
The
--offload-arch=gfx1201option targets AMD Radeon RX 9070 series products. For AMD Radeon RX 9060 series products, use--offload-arch=gfx1200instead.The
-gdwarf -Wl,-debug:dwarfoptions instructhipccto emit DWARF debug information for the host code. Otherwise,hipccemits PDB (Microsoft) debug information, which ROCgdb does not yet understand.The
-O0option disables compiler optimizations.
Run the just-compiled program to confirm it is working:
C:\rocgdb-example>.\example.exe
result is 3
You can now run the just-compiled program under ROCgdb, stopping execution in the
do_an_additionGPU kernel function, like so:C:\rocgdb-example>rocgdb example.exe GNU gdb (ROCm) 18.0.50.20251029-git Copyright (C) 2025 Free Software Foundation, Inc. License GPLv3+: GNU GPL version 3 or later <http://gnu.org/licenses/gpl.html> This is free software: you are free to change and redistribute it. There is NO WARRANTY, to the extent permitted by law. Type "show copying" and "show warranty" for details. This GDB was configured as "x86_64-w64-mingw32". Type "show configuration" for configuration details. For bug reporting instructions, please see: <https://github.com/ROCm-Developer-Tools/ROCgdb/issues>. Find the GDB manual and other documentation resources online at: <http://www.gnu.org/software/gdb/documentation/>. For help, type "help". Type "apropos word" to search for commands related to "word"... Reading symbols from example.exe... (gdb) break do_an_addition Function "do_an_addition" not defined. Make breakpoint pending on future shared library load? (y or [n]) y Breakpoint 1 (do_an_addition) pending. (gdb) run Starting program: C:\rocgdb-example\example.exe [New Thread 12180.0x286c] [New Thread 12180.0x1aa4] [New Thread 12180.0x4e8c] [New Thread 12180.0x3578] [New Thread 12180.0x3af4] [Switching to thread 7, lane 0 (AMDGPU Lane 1:2:1:1/0 (0,0,0)[0,0,0])] Thread 7 "do_an_addition" hit Breakpoint 1, with lane 0, do_an_addition (a=1, b=2, out=0x300004000) at example.cpp:6 6 *out = a + b; (gdb)
You can find more information about ROCgdb in the copy of the ROCgdb manual that is installed with the HIP SDK. The manual is located under the share\html subdirectory, for example, for an SDK installed at C:\Program Files\AMD\ROCm\7.1, the manual is located under C:\Program Files\AMD\ROCm\7.1\share\html.