Monitor the health of GPU clusters#
2025-11-13
4 min read time
Monitor the health of your cluster with the Cluster Health Checker utility script (check_cluster_health.py in the utils folder of the CVS GitHub repo), a standalone Python utility script that generates an overall health report by collecting logs and metrics of the GPU nodes cluster-wide.
The script doesn’t require any agent/plugin/exporters to be installed or any controller virtual machines.
The script identifies any hardware failure/degradation signatures like RAS errors, PCIe/XGMI errors, or network drop / error counters using AMD SMI.
It can also identify software failures by searching for failing signatures in the dmesg and journlctl logs.
The script also acts as a triaging tool to troubleshoot any performance issues that may be related to the AI infrastructure. You can use the script to take a snapshot of all counters (GPU/NIC) while your training/inference workloads are in progress, then compare the counters and identify any increment of unexpected counters across all nodes in the cluster to find issues.
Generate a health report#
Run the Cluster Health Checker utility script to generate a health report for your clusters with Python commands.
To run the script and generate a health report for a cluster:
Ensure you’ve completed the Cluster Validation Suite installation.
Open a new Terminal and CD into the cloned
cvsrepo.Type this Python command:
python3 ./utils/check_cluster_health.py
Then set the applicable arguments for your use case:
--hosts: Direct the script to the file with the list of host IP addresses you want the script to check.--username: Enter the username to SSH to the hosts.--password: Enter the password to SSH to the hosts--key_file: Enter the private Keyfile for the username.--iterations: Enter the number of check iterations you want to run.--time_between_iters: Enter the time the script should wait between run iterations.--report_file: Enter the directory you want the generated health file to save to. If you leave this argument empty, the file saves ascluster_report.htmlto the local directory.
Here’s an example command with some arguments set:
python3 ./utils/check_cluster_health.py --hosts /home/user/input/host_file.txt --username myusername --key_file /home/user/input/.ssh/id_test --iterations 2
The script logs into the nodes based on the hosts specified and captures information on potential error conditions or anomalies.
Open the
cluster_report.htmlfile to view the generated health report for the cluster.
Review the health report#
Open the generated health report to view snapshotted information on your cluster such as the:
GPU information
NIC information
Historic error logs
Snapshot differences for triaging
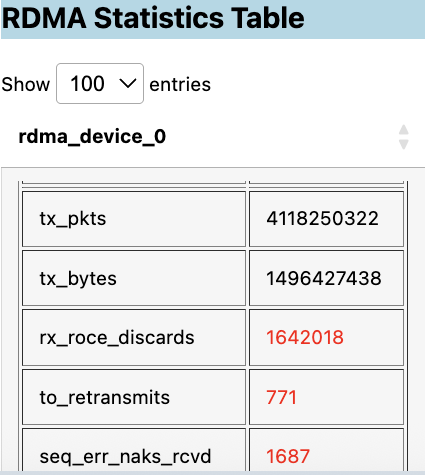
It looks for any potential errors, then graphs them in tables separated by categories such as PCIe errors, RDMA statistics, network congestion errors, GPU errors, or GPU cable issues. Detected anomalies are highlighted in red:
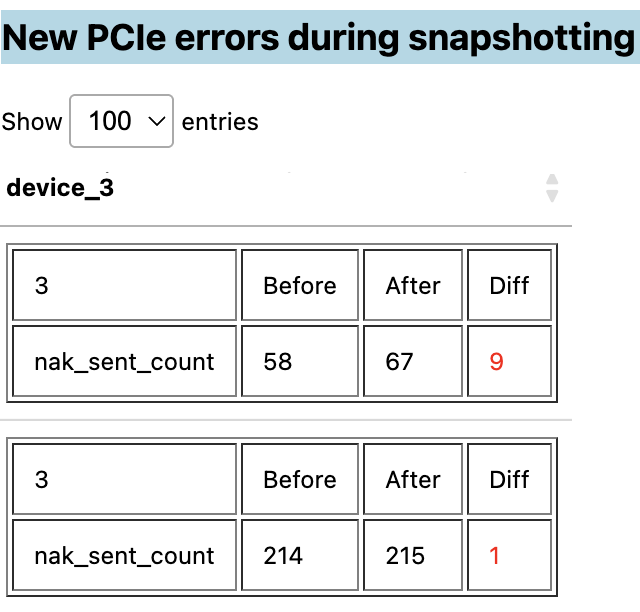
The delta between snapshotted values are also highlighted in red, depending on the category:
The report also displays potential kernel errors in the dmesg and journlctl logs:
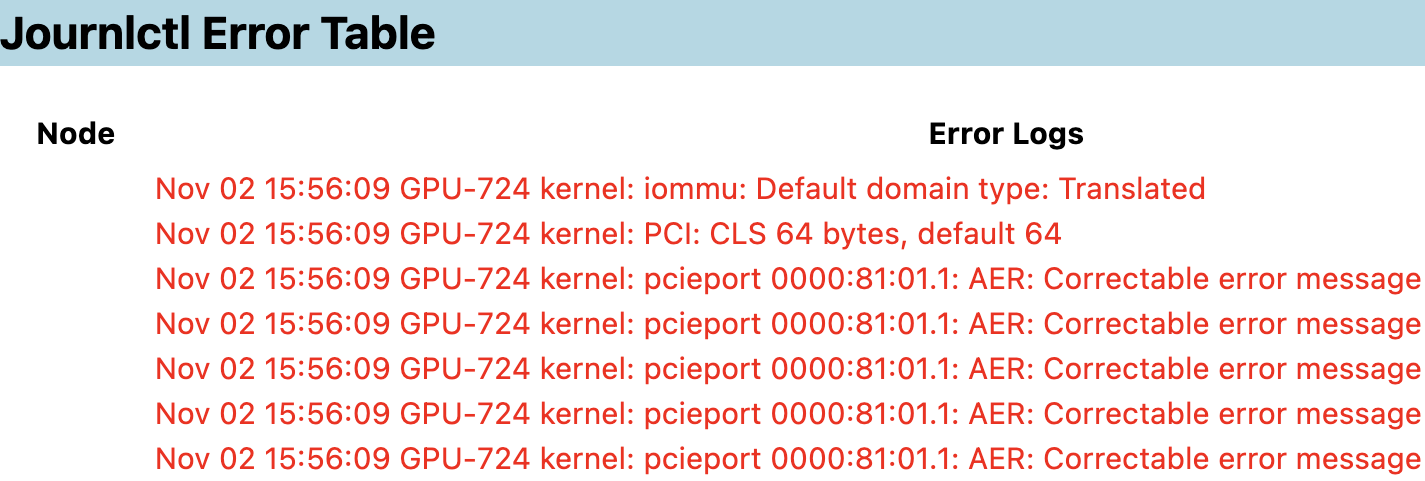
Use the logs in the health report to diagnose and triage node errors in your GPU clusters.
These values in these reports are captured using these ROCm AMD SMI commands:
sudo rocm-smi -a --json
sudo amd-smi partition --json
sudo amd-smi process --json
sudo amd-smi metric --json
sudo amd-smi firmware --json
sudo amd-smi metric --ecc --json
sudo amd-smi metric --pcie --json
sudo rocm-smi --loglevel error --showmemuse --json
sudo rocm-smi --loglevel error --showuse --json
sudo rocm-smi --loglevel error --showmetric --json
sudo rocm-smi --loglevel error --showfwinfo --json
sudo rocm-smi --loglevel error --showbus --json
sudo rocm-smi --loglevel error --showproductname --json
sudo rocm-smi --loglevel error --showtemp —json
sudo ethtool -S <iface>
sudo rdma link
sudo rdma statististic
Tip
See the AMD SMI Commands reference for more information on how the Cluster Health Checker script captures these metrics and their definitions.