Setting up third-party tools#
This topic discusses how to configure third-party tools or plugins such as the GDB dashboard and Visual Studio (VS) Code GUI for debugging applications using ROCgdb.
Note
AMD is not responsible for providing any support for issues or bugs reported on these third-party tools. To report such issues, visit the GitHub or webpage for these third-party tools. AMD doesn’t guarantee that these third-party tools will work seamlessly across ROCm releases.
Setting up GDB dashboard TUI#
The GDB dashboard is a Text User Interface (TUI). It’s a standalone .gdbinit file written using the Python API, that provides a modular interface for showing relevant information about the program being debugged.
Installation#
To install the GDB dashboard, download the .gdbinit file and move it to your home directory.
Layout setup#
During debugging, the default dashboard layout setup appears automatically every time the inferior program stops. The GDB dashboard’s purpose is to reduce the number of GDB commands needed to inspect the current program’s status, allowing you to focus on the control flow.
To display the default set of views, use this command:
(gdb) dashboard -layout
Sample output:
Dashboard    (default TTY)
assembly     (default TTY)
breakpoints  (default TTY)
expressions  (default TTY)
history      (default TTY)
memory       (default TTY)
registers    (default TTY)
source       (default TTY)
stack        (default TTY)
threads      (default TTY)
variables    (default TTY)
Customizing the dashboard#
The GDB dashboard TUI is customizable. For example, you can customize the TUI to exclude less commonly used views from the default display during a debug session, such as Expressions, History, and Memory views.
To avoid a cluttered display with many AMD GPU registers displaying constantly on the dashboard, you can omit the Register view from the default dashboard using the following commands:
(gdb) dashboard registers
registers module disabled
(gdb) dashboard expressions
expressions module disabled
(gdb) dashboard history
history module disabled
(gdb) dashboard memory
memory module disabled
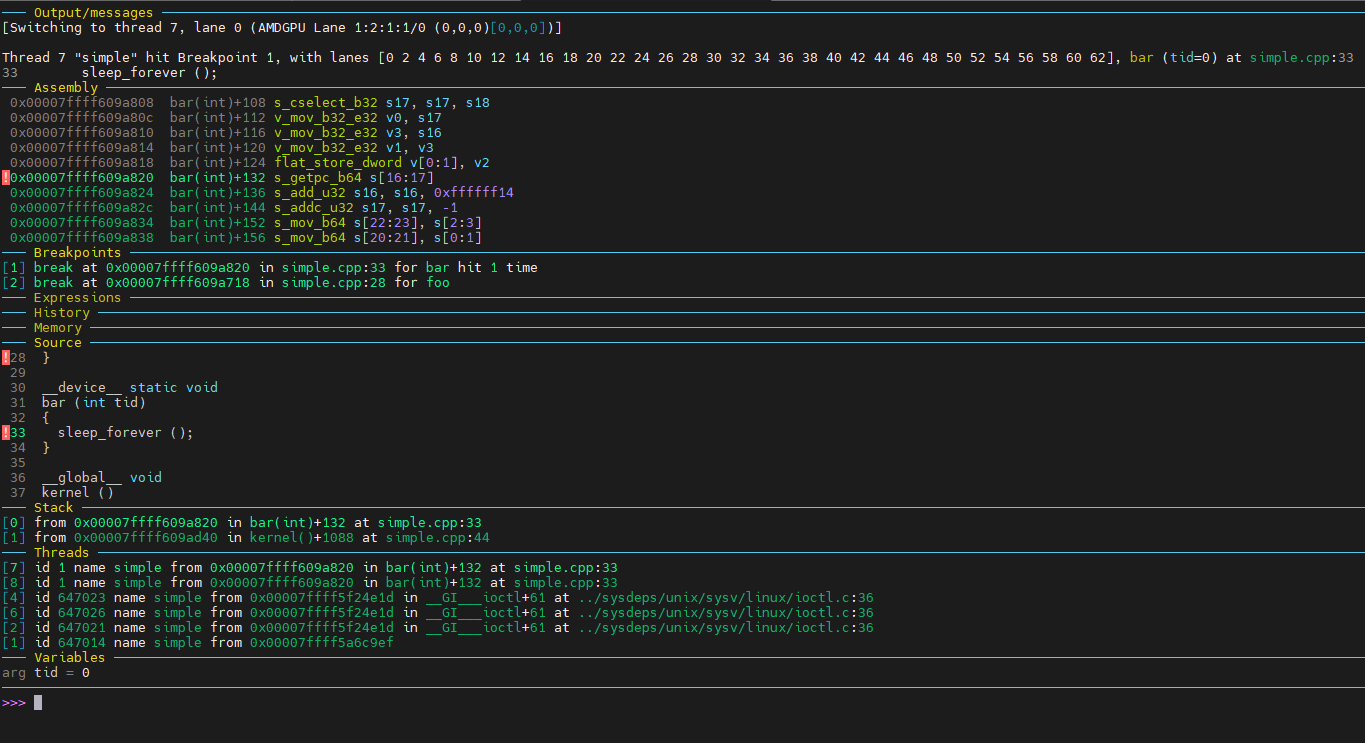
Here is how compact the customized dashboard will look:
Furthermore, the dashboard offers several stylable attributes that can be modified via the -style command, which applies to both the dashboard and individual modules. For example, the height of the Source view can be increased using the following command:
(gdb) dashboard source -style height 35
Dashboard command-line options#
The following table lists the dashboard command-line options:
Option |
Description |
|---|---|
|
Dumps or saves the dashboard configuration. |
|
Enables or disables the dashboard. |
|
Sets or shows the dashboard layout. |
|
Sets the output file or TTY for the whole dashboard or individual module. |
|
Configures the stylable attributes. |
|
Configures the assembly module. Using without arguments toggles its visibility. |
|
Configures the breakpoints module. Using without arguments toggles its visibility. |
|
Configures the expressions module. Using without arguments toggles its visibility. |
|
Configures the history module. Using without arguments toggles its visibility. |
|
Configures the memory module. Using without arguments toggles its visibility. |
|
Configures the registers module. Using without arguments toggles its visibility. |
|
Configures the source module. Using without arguments toggles its visibility. |
|
Configures the stack module. Using without arguments toggles its visibility. |
|
Configures the threads module. Using without arguments toggles its visibility. |
|
Configures the variables module. Using without arguments toggles its visibility. |
To see the complete list of dashboard subcommands, you can also use help:
help dashboard
For full documentation of a subcommand, use
help dashboardfollowed by the subcommand name.To search for commands related to a “word”, use
apropos <word>.For full documentation of commands related to a “word”, use
apropos -v <word>.
You can also pass command name abbreviations as “word”, if unambiguous.
For more information on GDB dashboard, see GDB dashboard wiki.
Setting up VS Code GUI#
This section provides information on configuring Visual Studio (VS) Code GUI for debugging applications using ROCgdb.
Installing extensions#
To use ROCgdb within the VS Code, you need to install some VS Code extensions. Only two extensions are required from external vendors while the rest are provided by Microsoft. These extensions are grouped into three categories:
Must-have extensions. These are required for HIP debugging.
Extra extensions for Python tracing.
Optional extensions.
Must-have extensions#
C/C++ for VS Code by Microsoft
C/C++ for Extension Pack by Microsoft
C/C++ Themes by Microsoft
Remote SSH by Microsoft
Remote Explorer by Microsoft
Remote Development by Microsoft
This installs Dev Containers and Remote Tunnels by Microsoft, which is necessary for tracing under Docker.
Docker by Microsoft
Extra extensions for Python tracing#
Pylance by Microsoft
Python by Microsoft
Python Debugger by Microsoft
Python C++ Debugger by BeniBenj
Note
VS Code requires you to install the extensions on the remote system as well.
Optional extensions#
Jupyter by Microsoft
GitHub Pull Request by Microsoft
Configuring the Remote Debugger settings#
After installing the VS Code extensions, you need to configure the Remote Debugger settings. The settings help VS Code to connect (Attach) to the machine hosting the HIP program to be debugged and execute the program under ROCgdb.
Follow these steps to configure the Remote Debugger settings:
Select Remote Explorer and add the new remote:
Add the ssh command line
ssh <user_name>@<remote_server_url>.
Connect to the remote system.
Open the repo folder on the remote system. You can use a previously cloned CLR repo from the public GitHub.
Click on Run and Debug button on the left panel.
Click on Create a launch.json file.
Select GDB in the drop out menu and add these two configurations: (gdb) Attach and (gdb) Launch.
Attach doesn’t require any extra setup.
Launch requires the environment variable
LD_LIBRARY_PATHto point to the debug build of runtime.If required, set the debugger path to
rocgdbinstallation path. For example,miDebuggerPath: /opt/rocm-7.2.0/bin/rocgdb.
Configuration file: launch.json#
The launch.json configuration file contains information required by VS Code to Launch or Attach to a program for debugging. This information includes path information for the debugger and the program including the arguments and environment variables.
Here is a sample launch.json file:
{
   "version": "0.2.0",
   "configurations": [
      {
         "name": "(gdb) Attach",
         "type": "cppdbg",
         "request": "attach",
         "processId": "${command:pickProcess}",
         "program" : "/usr/bin/python3",
         "miDebuggerPath": "/opt/rocm-6.4.0/bin/rocgdb",
         "MIMode": "gdb",
         "setupCommands": [
         {
            "description": "Enable pretty-printing for gdb",
            "text": "-enable-pretty-printing",
            "ignoreFailures": true
         },
         {
            "description": "Set Disassembly Flavor to Intel",
            "text": "-gdb-set disassembly-flavor intel",
            "ignoreFailures": true
         }
         ]
      },
      {
         "name": "(gdb) Launch",
         "type": "cppdbg",
         "request": "launch",
         "program": "/home/test_dir/graph/graph",
         "args": [
         "Unit_hipMemcpy_MultiThread-AllAPIs"
         ],
         "stopAtEntry": true,
         "cwd": "/home/test_dir/graph/",
         "environment": [
         {
            "name": "LD_LIBRARY_PATH",
            "value": "/home/test_dir/udp/clr/build/install/lib/:/opt/rocm/lib"
         },
         {
            "name": "DEBUG_HIP_MEM_POOL_VMHEAP",
            "value": "1"
         }
         ],
         "externalConsole": false,
         "MIMode": "gdb",
         "setupCommands": [
         {
            "description": "Enable pretty-printing for gdb",
            "text": "-enable-pretty-printing",
            "ignoreFailures": true
         },
         {
            "description": "Set Disassembly Flavor to Intel",
            "text": "-gdb-set disassembly-flavor intel",
            "ignoreFailures": true
         }
         ]
      }
   ]
}
Launching the debugger#
After the debugger settings are configured, the Run and Debug tab will show these two options:
(gdb) Attach option: This option is used to connect the debugger to a running process.
(gdb) Launch option: This option is used to start a process under debugger control.
To start remote debugging, follow these steps:
Click on the Launch option to start the application under debugger control:
stopAtEntry: truestops the application onmain().
Navigate in the repo and set breakpoints in the application or runtime source code.
VS Code enables pretty printers by default.
STL classes are easily modifiable like regular data sets.
ROCgdb might require
~/.gdbinitfor pretty printers:python import sys sys.path.insert(0, '/usr/share/gcc/python') from libstdcxx.v6.printers import register_libstdcxx_printers register_libstdcxx_printers (None) end
ROCgdb also facilitates device kernel tracing. Breakpoints, variables, and registers work automatically.
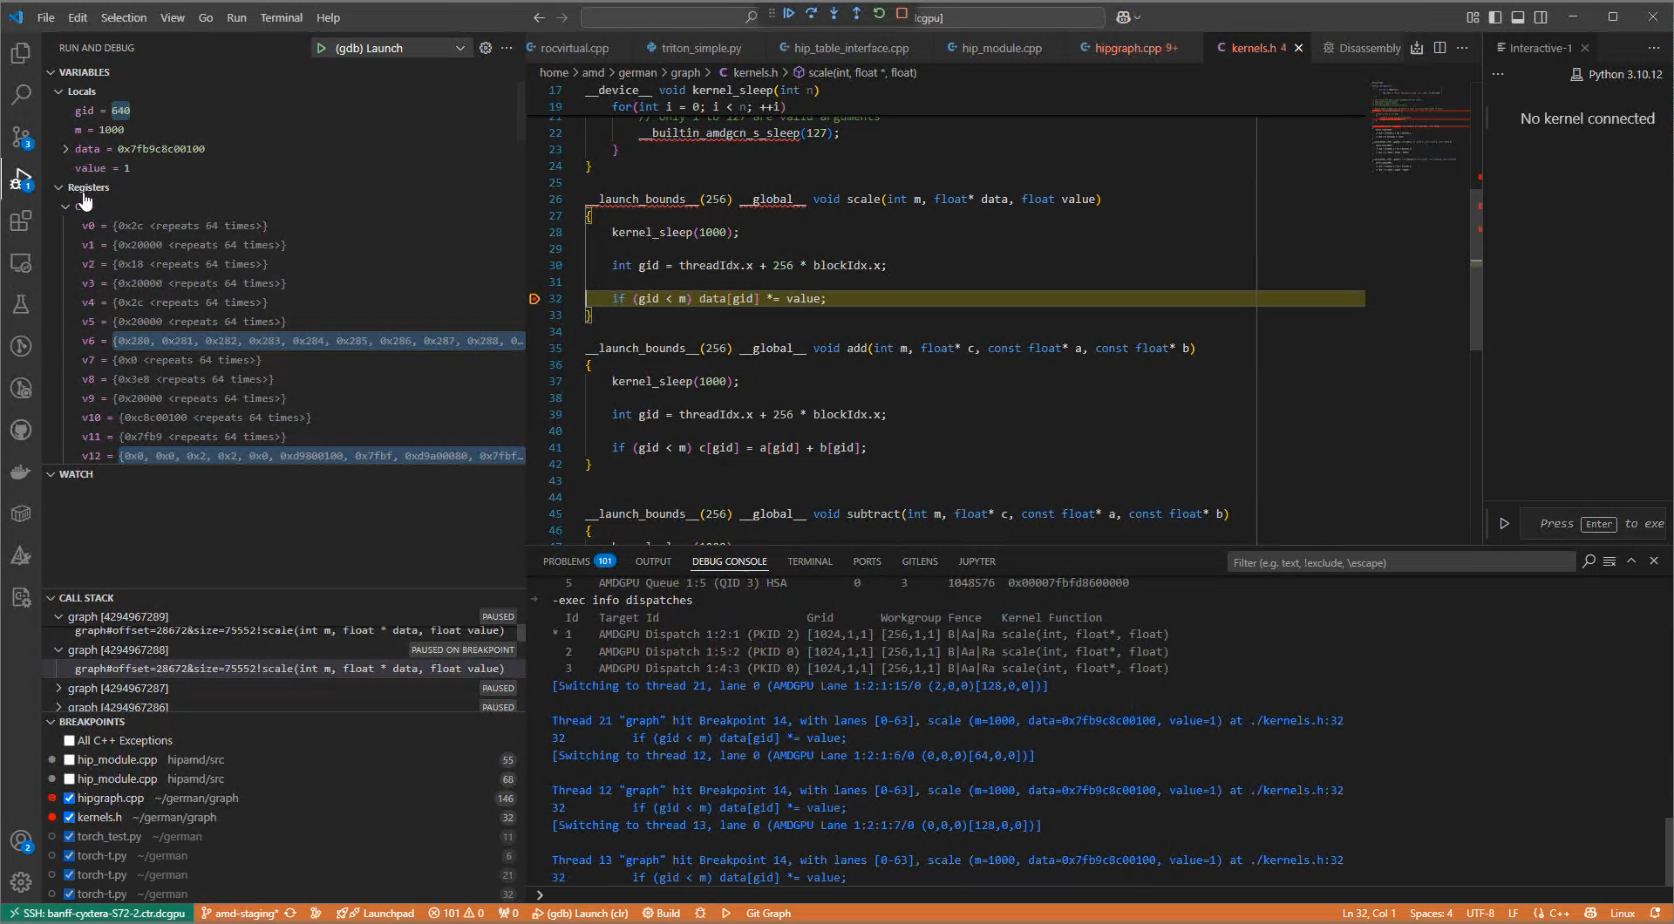
Debugger displays#
During an active debug session, several tabs are available for displaying the running program and kernel states. These include tabs to display kernel variable, call stack frame, GPU registers, and source code breakpoint locations.
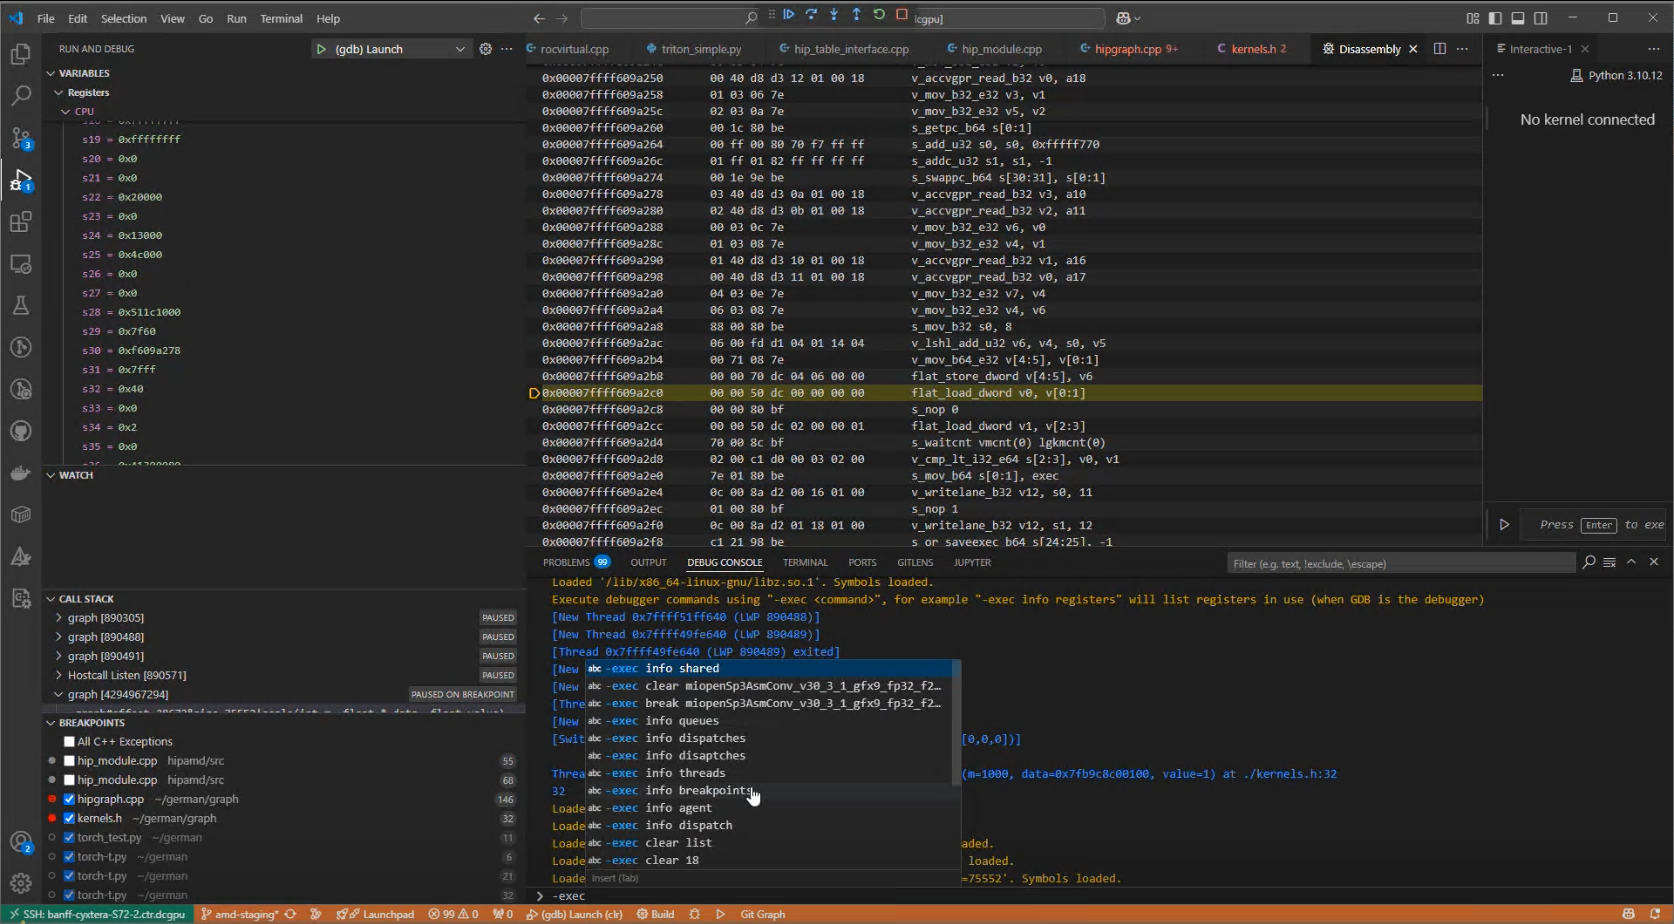
Debug console#
During a debug session when the inferior is stopped, you can enter ROCgdb commands in the Debug console. All such commands must be entered with a -exec prefix. For example, all GPU threads can be displayed using -exec info threads.