Debugging Python kernel code#
This topic provides information on debugging Python (Pytorch) kernel code that offloads HIP compute kernels to AMD GPU.
Installing extensions#
To debug the Python kernel code, you must install the Extra Additions For Python tracing extensions on the remote system. These extensions help you to set a breakpoint at the Python layer, C/C++ layer, and/or HIP kernel layer simultaneously.
Getting started#
To start debugging Python code, follow these steps:
Install Python extensions on the remote system or Docker.
Add Python Debugger configuration.
Specify the Python version using interpreter (Ctrl+Shift+P).
Select Python C++ Debugger Custom option in the configurations. It launches the Python Debugger and attaches gdb to the Python process.
Verify the (gdb) Attach configuration. You might need to run
echo 0|sudo tee /proc/sys/kernel/yama/ptrace_scopeto allow attach.You can now see the Python Debugger and gdb threads in the CALL STACK window. The Breakpoint window works for both and is easy to navigate.
Key considerations#
The Python extension doesn’t support gdb for Python and C++ tracing.
Breaks in the Python script don’t activate gdb automatically.
Ensure that Python picks the correct runtime libraries. To see the location of the loaded libraries, use
-exec info shared.There are multiple terminal windows. Switch as required.
Configuration file: launch.json#
The launch.json configuration file contains the information required by VS Code to debug the Python program. This information includes the path information and environment variables required for the Python program.
See the configuration items in the following sample launch.json configuration file:
{
    "name": "Python C++ Debugger",
    "type": "pythoncpp",
    "request": "launch",
    "pythonLaunchName": "Python Debugger",
    "cppAttachName": "(gdb) Attach"
},
{
    "name": "Python Debugger",
    "type": "debugpy",
    "request": "launch",
    "program": "/home/test_dir/test.py",
    "console": "integratedTerminal",
    "cwd": "/home/test_dir/",
    "env": {
        "PYTHONPATH":"${PYTHONPATH}:/opt/rocm/bin:/opt/rocm/lib:/home/myenv-py311/lib/python3.11/site-packages",
        "LD_LIBRARY_PATH":"/home/test_dir/udp/clr/build/install/lib/:/opt/rocm/lib",
        "AMD_LOG_LEVEL":"4"
}
},
Python and C++ breakpoints#
Running the launch configuration for the Python C++ Debugger starts program execution in the Python code and stops it at any preset breakpoint. As shown in the following image, there will be two entries in the CALL STACK window: one for Python Debugger and another for (gdb) Attach:
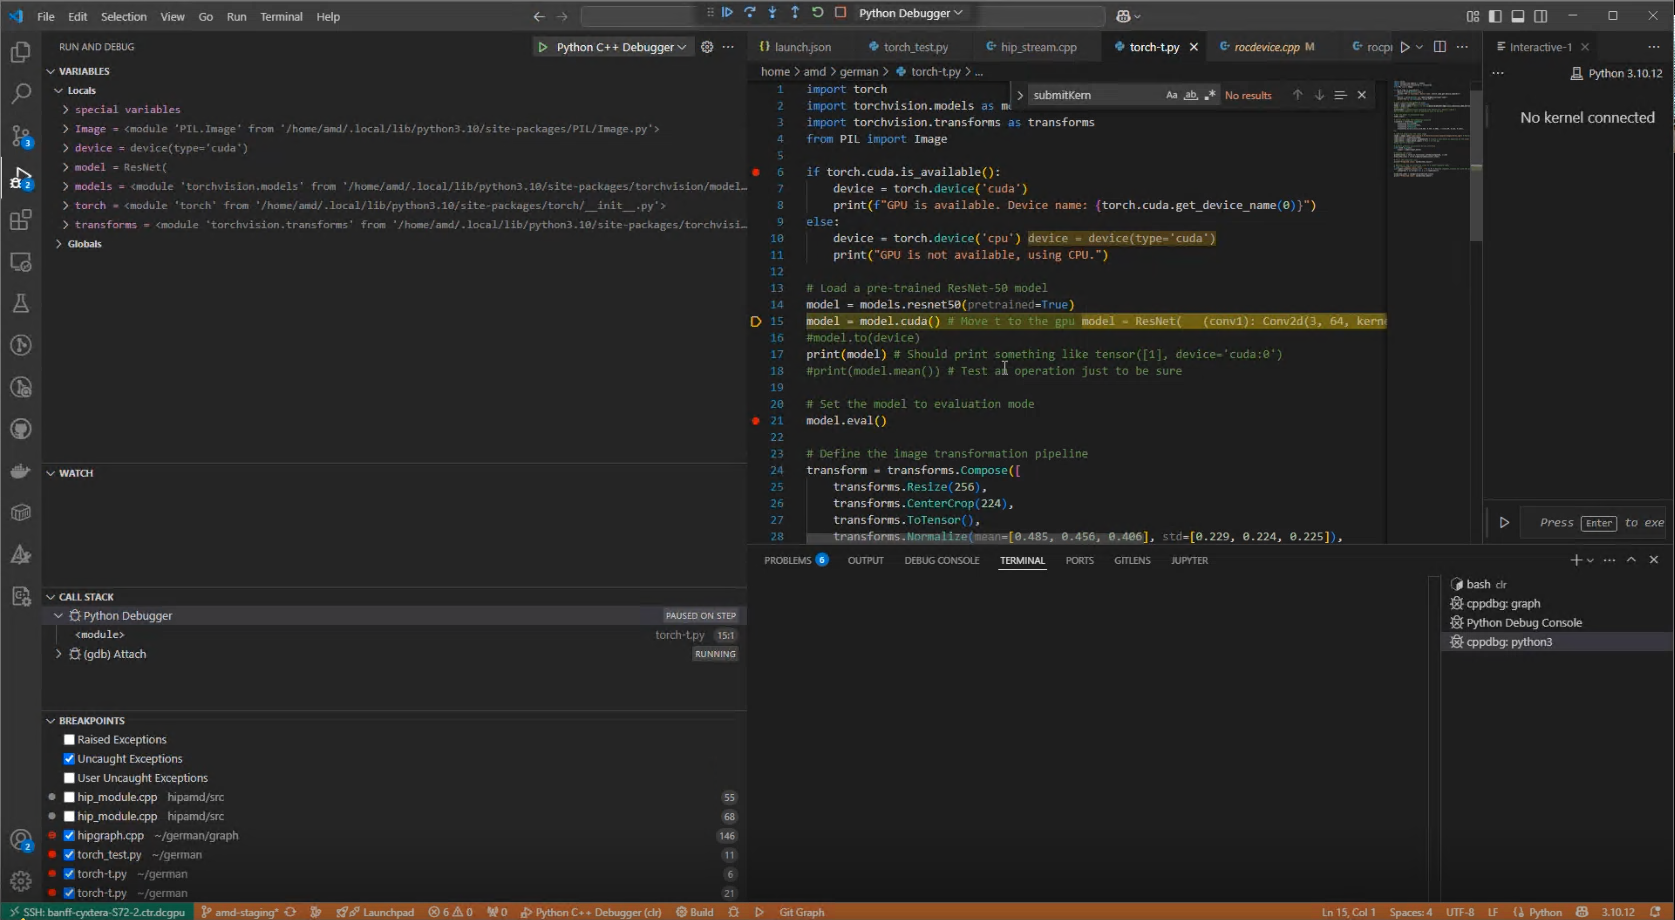
Whenever Python code execution pauses at a breakpoint, additional breakpoints can be set in the C/C++ code layer so that when Python code execution resumes and calls down to the C/C++ layer, program execution will stop at that C/C++ layer breakpoint.
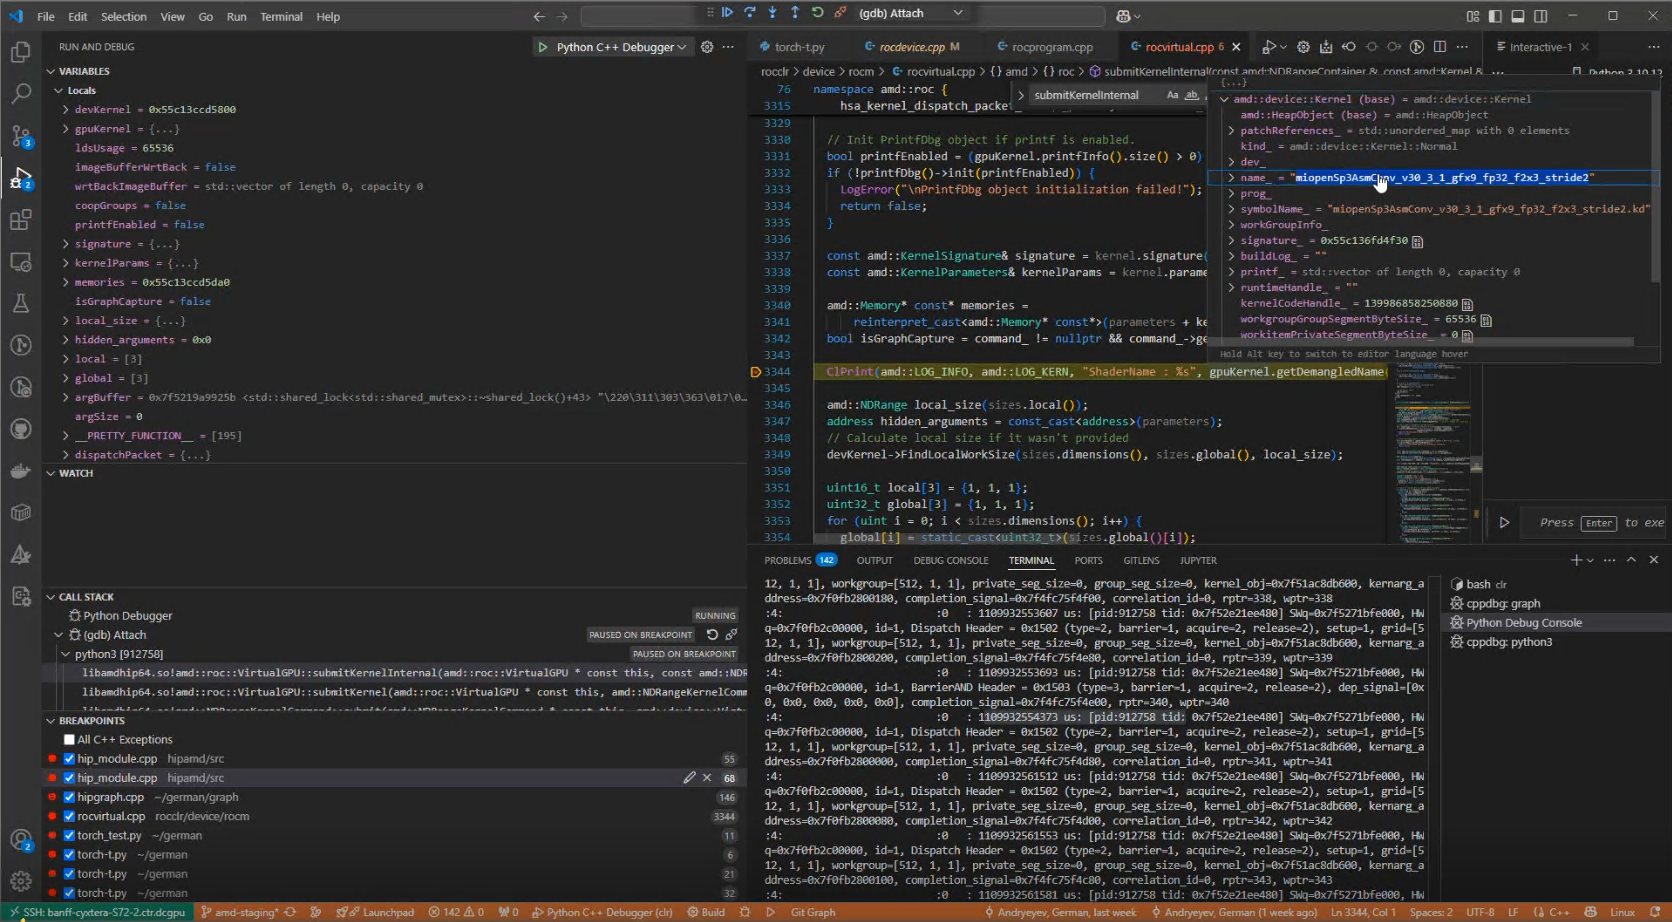
Under the CALL STACK window in the following image, see the call stack hierarchy under the (gdb) Attach inferior. If the C/C++ layer breakpoint is set at the amd::roc::VirtualGPU::submitKernel() function, the name field for the amd::device::kernel object shows the name of the HIP kernel about to be submitted.
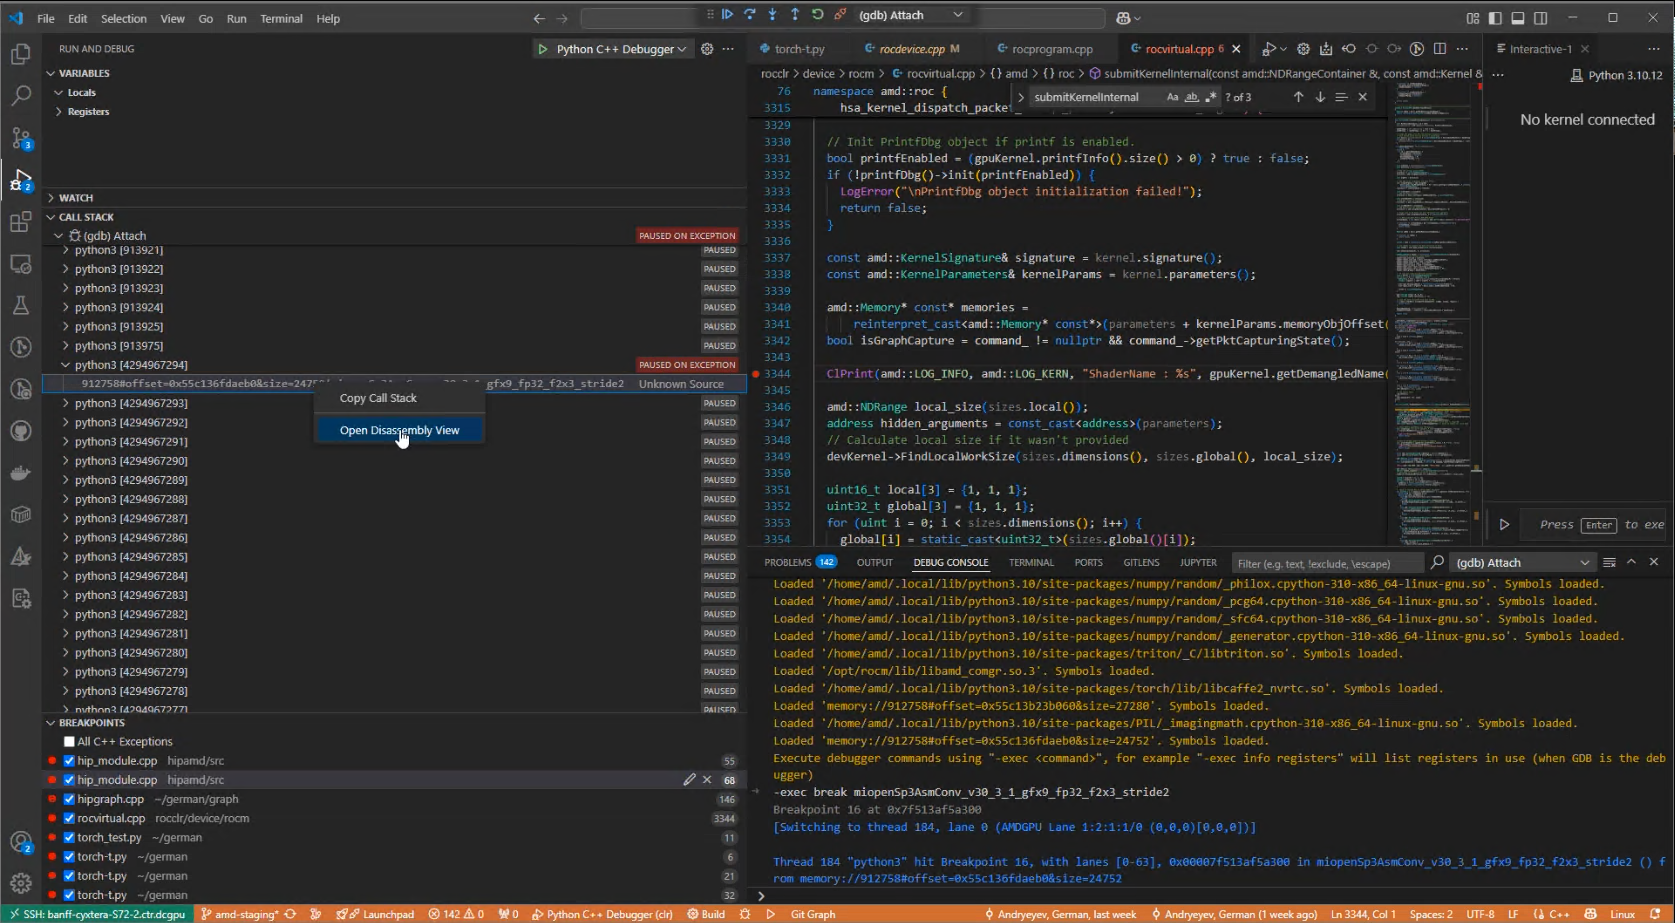
C++ and HIP kernel breakpoints#
Once a breakpoint in the C/C++ layer is hit, a HIP kernel breakpoint can be set in the DEBUG CONSOLE using -exec break <kernel_name>. Once execution continues and the specified kernel is executed, Python will be PAUSED ON EXCEPTION.
To inspect the HIP kernel state:
Navigate to the CALL STACK window.
Search for the python3 [ID] with the PAUSED ON EXCEPTION status.
Selecting this python3 [ID] will change the debugger focus.
To view its disassembly, right click on this python3 [ID] and select Open Disassembly View.
The following image demonstrates the HIP kernel breakpoints: