Investigating performance anomalies#
2026-07-22
10 min read time
Some workloads have anomalous steps — most steps are fine, every so often one is 2x, 5x, 50x slower. A fixed-window profiler almost never catches them.
Pattern: trace every step continuously with CUDA-only activities, flush the buffer every step, and only write to disk when the step exceeds a threshold. Saved traces are tight — one anomaly = one small trace, no surrounding context.
We walk through this with a ResNet18 example, a synthetic anomaly injector, and the TraceLens perf-report generator. Builds on the PyTorch profiling guide.
1 Setup#
import random
import statistics
import time
from pathlib import Path

import matplotlib.pyplot as plt
import torch
import torchvision.models as models
from torch.profiler import profile, ProfilerActivity, schedule

device = "cuda"
dtype = torch.bfloat16
torch.manual_seed(0)
random.seed(0)

model = models.resnet18().to(device).to(dtype)
optimizer = torch.optim.SGD(model.parameters(), lr=1e-3)

B, C, H, W = 5, 3, 224, 224
num_classes = 1000
dummy_input = torch.randn(B, C, H, W, device=device, dtype=dtype)
dummy_target = torch.randn(B, num_classes, device=device, dtype=dtype)
2 Anomaly simulator#
For a runnable example, train_step() does a normal forward/backward/step and an extra GPU matmul on a random ~5% of steps. Tensors are pre-allocated so the anomaly is pure compute, not allocator pressure. The detection loop treats train_step() as a black box — you call it and time it, you don’t know which calls will be anomalous.
EXTRA_MATMUL_DIM = 8192
EXTRA_MATMUL_PROB = 0.05
EXTRA_MATMUL_COUNT = 2

extra_a = torch.randn(EXTRA_MATMUL_DIM, EXTRA_MATMUL_DIM, device=device, dtype=dtype)
extra_b = torch.randn(EXTRA_MATMUL_DIM, EXTRA_MATMUL_DIM, device=device, dtype=dtype)


def train_step() -> None:
    """Normal forward/backward/step, with a stochastic extra anomaly baked in."""
    optimizer.zero_grad(set_to_none=True)
    output = model(dummy_input)
    loss = torch.nn.functional.mse_loss(output, dummy_target)
    loss.backward()
    optimizer.step()

    if random.random() < EXTRA_MATMUL_PROB:
        x = extra_a
        for _ in range(EXTRA_MATMUL_COUNT):
            x = x @ extra_b
        x.sum()
3 Baseline and first look#
Run a few hundred steps without the profiler, plot them, take the median as the baseline. threshold = 1.5 × median. Each step is timed with time.perf_counter() + a trailing torch.cuda.synchronize() so the timer accounts for all GPU work.
# Tiny warmup so CUDA context init / autotune doesn't show up as a giant outlier.
for _ in range(5):
    train_step()
torch.cuda.synchronize()

DIAGNOSTIC_STEPS = 200
step_durs_ms: list[float] = []
for _ in range(DIAGNOSTIC_STEPS):
    t0 = time.perf_counter()
    train_step()
    torch.cuda.synchronize()
    step_durs_ms.append((time.perf_counter() - t0) * 1000.0)

baseline_median = statistics.median(step_durs_ms)
THRESHOLD_MULTIPLIER = 1.5
threshold_ms = baseline_median * THRESHOLD_MULTIPLIER
print(f"baseline median: {baseline_median:.2f} ms   threshold (1.5x): {threshold_ms:.2f} ms")

fig, ax = plt.subplots(figsize=(11, 4))
x = list(range(len(step_durs_ms)))
above_x = [i for i, d in enumerate(step_durs_ms) if d > threshold_ms]
above_y = [step_durs_ms[i] for i in above_x]
ax.plot(x, step_durs_ms, lw=0.8, color="#1f77b4", label="step duration")
ax.axhline(threshold_ms, color="red", lw=1.2, ls="--", label=f"threshold ({threshold_ms:.1f} ms)")
ax.axhline(baseline_median, color="green", lw=1.0, ls=":", label=f"baseline median ({baseline_median:.1f} ms)")
ax.scatter(above_x, above_y, color="red", s=30, zorder=5, label=f"above threshold ({len(above_x)})")
ax.set_xlabel("step")
ax.set_ylabel("duration (ms)")
ax.set_title("Per-step duration timeline")
ax.legend(loc="upper right", fontsize=8)
ax.grid(alpha=0.3)
plt.tight_layout()
plt.show()
baseline median: 5.27 ms threshold (1.5x): 7.90 ms
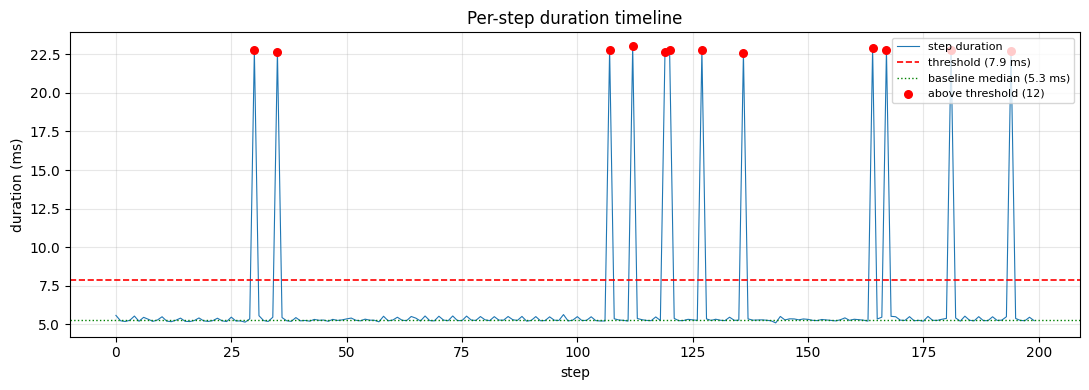
Points above the threshold (red) sit well above the baseline. If your timeline shows a noisy band with no clear gap between baseline and the high points, the workload is jittery rather than anomalous and threshold capture won’t help much.
4 Per-step profiler flush#
We want each saved trace to contain only the anomalous step’s events — no surrounding healthy steps. The way to do this is to make the profiler flush its buffer on every prof.step() boundary, then let the handler decide whether to keep the file.
schedule(wait=0, warmup=0, active=1) returns RECORD_AND_SAVE every step, which flushes the buffer to on_trace_ready and resets on every prof.step(). Each handler call sees exactly one step’s events. PyTorch will print a Profiler won't be using warmup warning — safe to ignore, we already warmed up CUDA in §3. (See the profiling guide for the schedule() factory’s general form.)
sched = schedule(wait=0, warmup=0, active=1)
/tmp/ipykernel_4984/2113088922.py:1: UserWarning: Profiler won't be using warmup, this can skew profiler results
  sched = schedule(wait=0, warmup=0, active=1)
5 Filter in the handler#
The handler decides whether the just-finished step is worth keeping. At the end of each loop iteration we push (step, dur) onto a FIFO. The handler pops one entry per invocation and writes to disk only if the duration exceeds the threshold. Non-anomalous steps fall through — their events were flushed from the in-memory buffer and discarded by the profiler, never serialized to JSON, never touch disk.
The queue is effectively single-entry in steady state (one push per step, one pop per handler call). It still pays to make it explicit: PyTorch fires the handler once more on profiler shutdown to flush residual events, and at that point the queue is empty so the handler returns early.
OUTPUT_DIR = Path("./anomaly_traces")
OUTPUT_DIR.mkdir(exist_ok=True, parents=True)
for old in OUTPUT_DIR.glob("anomaly_*.json"):
    old.unlink()
for old in OUTPUT_DIR.glob("anomaly_*.xlsx"):
    old.unlink()

step_info_queue: list[tuple[int, float]] = []
saved_files: list[Path] = []


def trace_handler(prof):
    if not step_info_queue:
        return
    step, duration_ms = step_info_queue.pop(0)
    if duration_ms <= threshold_ms:
        return  # not anomalous → discard, nothing written to disk
    out = OUTPUT_DIR / f"anomaly_step{step:05d}_dur{duration_ms:.1f}ms.json"
    prof.export_chrome_trace(str(out))
    saved_files.append(out)
    print(f"    saved: {out.name}  ({out.stat().st_size / 1024:.1f} KB)")
6 The always-on profiling loop#
Generic training loop: time each step, push (step, dur), call prof.step(). Detection is purely duration-based — we have no idea which steps will be anomalous. We use activities=[ProfilerActivity.CUDA] only (no CPU op decode, no Python stacks) to keep per-step overhead small enough for always-on profiling. The handler fires synchronously inside prof.step() and either writes the just-finished step’s trace or returns silently.
NUM_STEPS = 200
print(f"Running {NUM_STEPS} steps with always-on CUDA-only profiling, threshold={threshold_ms:.2f} ms\n")

loop_start = time.perf_counter()
with profile(
    activities=[ProfilerActivity.CUDA],
    schedule=sched,
    on_trace_ready=trace_handler,
    record_shapes=False,
    with_stack=False,
) as prof:
    for global_step in range(NUM_STEPS):
        step_start = time.perf_counter()
        train_step()
        torch.cuda.synchronize()
        dur = (time.perf_counter() - step_start) * 1000.0
        step_info_queue.append((global_step, dur))
        prof.step()

elapsed = time.perf_counter() - loop_start
print(f"\nWall time: {elapsed:.2f} s ({elapsed * 1000 / NUM_STEPS:.2f} ms/step including profiler overhead)")
Running 200 steps with always-on CUDA-only profiling, threshold=7.90 ms
/opt/venv/lib/python3.12/site-packages/torch/profiler/profiler.py:217: UserWarning: Warning: Profiler clears events at the end of each cycle.Only events from the current cycle will be reported.To keep events across cycles, set acc_events=True.
  _warn_once(
[W518 16:28:12.376799491 collection.cpp:1148] Warning: ROCTracer produced duplicate flow start: 2 (function operator())
saved: anomaly_step00020_dur23.4ms.json (830.6 KB)
    saved: anomaly_step00043_dur23.0ms.json  (830.6 KB)
    saved: anomaly_step00044_dur23.1ms.json  (830.6 KB)
    saved: anomaly_step00050_dur23.2ms.json  (830.6 KB)
    saved: anomaly_step00061_dur23.1ms.json  (830.6 KB)
    saved: anomaly_step00068_dur23.3ms.json  (830.6 KB)
saved: anomaly_step00077_dur23.5ms.json (830.6 KB)
saved: anomaly_step00105_dur23.0ms.json (830.6 KB)
saved: anomaly_step00128_dur23.1ms.json (830.6 KB)
    saved: anomaly_step00155_dur23.2ms.json  (830.6 KB)
    saved: anomaly_step00166_dur23.4ms.json  (830.6 KB)
    saved: anomaly_step00168_dur23.0ms.json  (830.6 KB)
saved: anomaly_step00169_dur23.2ms.json (830.6 KB)
    saved: anomaly_step00197_dur23.3ms.json  (832.7 KB)

Wall time: 2.68 s (13.42 ms/step including profiler overhead)
7 Putting the anomaly trace through TraceLens#
Each saved file contains exactly one anomalous step’s CUDA events — small, focused, ready to drop into Perfetto or feed to the TraceLens perf-report generator, which summarises any PyTorch JSON trace into tables. For our CUDA-only traces it emits gpu_timeline and kernel_summary (the op-level sheets need CPU events, which we don’t have). Pass include_unlinked_kernels=True so the GPU timeline counts kernels that have no host call-stack to link against.
from TraceLens.Reporting.generate_perf_report_pytorch import generate_perf_report_pytorch

target_trace = saved_files[0]
print(f"Generating perf report for: {target_trace.name}\n")

dfs = generate_perf_report_pytorch(
    profile_json_path=str(target_trace),
    include_unlinked_kernels=True,
    kernel_summary=True,
)
print(f"\nSheets returned: {list(dfs.keys())}")
Generating perf report for: anomaly_step00020_dur23.4ms.json

Building tree with add_python_func=False
Building CPU op tree with add_python_func=False
Detected GPU-only trace. Skipping CPU-dependent analysis and generating only GPU timeline and kernel summary.
DataFrames successfully written to anomaly_traces/anomaly_step00020_dur23.4ms_perf_report.xlsx

Sheets returned: ['gpu_timeline', 'kernel_summary']
GPU timeline#
Compute vs idle vs comm vs memcpy breakdown for the anomalous step. A compute-heavy anomaly points at extra work; high idle points at host stalls; a comm anomaly points at a slow collective.
df_timeline = dfs["gpu_timeline"].copy()
df_timeline["time ms"] = df_timeline["time ms"].round(3)
df_timeline["percent"] = df_timeline["percent"].round(2)
df_timeline
| type | time ms | percent | |
|---|---|---|---|
| 0 | computation_time | 22.479 | 96.92 |
| 1 | exposed_comm_time | 0.000 | 0.00 |
| 2 | exposed_memcpy_time | 0.000 | 0.00 |
| 3 | busy_time | 22.479 | 96.92 |
| 4 | idle_time | 0.713 | 3.08 |
| 5 | total_time | 23.192 | 100.00 |
| 6 | total_comm_time | 0.000 | 0.00 |
| 7 | total_memcpy_time | 0.000 | 0.00 |
Kernel summary#
Top kernels by total time within the anomalous step. Names get truncated for display.
# "\u00b5" is the micro sign (µ); the TraceLens output uses it in column names.
rename_map = {
    "Kernel duration (\u00b5s)_sum": "total (\u00b5s)",
    "Kernel duration (\u00b5s)_count": "count",
    "Kernel duration (\u00b5s)_mean": "mean (\u00b5s)",
    "Percent of total time (%)": "% total",
}
df_kern = (
    dfs["kernel_summary"]
    .sort_values("Kernel duration (\u00b5s)_sum", ascending=False)
    .head(10)
    .copy()
)
df_kern["kernel (truncated)"] = df_kern["Kernel name"].str.slice(0, 60) + "..."
df_kern_view = (
    df_kern[["kernel (truncated)", *rename_map.keys()]]
    .rename(columns=rename_map)
    .round({"total (\u00b5s)": 1, "mean (\u00b5s)": 2, "% total": 2})
)
df_kern_view
| kernel (truncated) | total (µs) | count | mean (µs) | % total | |
|---|---|---|---|---|---|
| 0 | Cijk_Ailk_Bljk_BBS_BH_Bias_HA_S_SAV_UserArgs_M... | 17453.8 | 2 | 8726.92 | 75.26 |
| 1 | void at::native::batch_norm_backward_kernel<c1... | 560.9 | 20 | 28.05 | 2.42 |
| 2 | void at::native::batch_norm_collect_statistics... | 366.4 | 20 | 18.32 | 1.58 |
| 3 | batched_transpose_16x64_pack_1x4_ediv_1x2_half... | 354.5 | 73 | 4.86 | 1.53 |
| 4 | igemm_wrw_gtcx2_nhwc_bf16_bx0_ex1_bt256x128x16... | 292.0 | 10 | 29.20 | 1.26 |
| 5 | SubTensorOpWithCastTensor1d... | 235.8 | 42 | 5.61 | 1.02 |
| 6 | SubTensorOpWithScalar1d... | 202.2 | 52 | 3.89 | 0.87 |
| 7 | igemm_bwd_gtcx2_nhwc_bf16_bx0_ex1_bt32x128x32_... | 187.4 | 7 | 26.76 | 0.81 |
| 8 | batched_transpose_64x64_pack_4x4_ediv_4x4_half... | 175.0 | 30 | 5.83 | 0.75 |
| 9 | void at::native::batch_norm_transform_input_ke... | 158.1 | 20 | 7.90 | 0.68 |
Because the trace only contains the anomalous step, the kernels responsible sit at the very top — small count, large sum. Our synthetic 8192×8192 bf16 matmul lights up exactly that way. The same data is also saved as .xlsx:
xlsx_path = target_trace.with_name(target_trace.stem + "_perf_report.xlsx")
if xlsx_path.exists():
    print(f"Excel report: {xlsx_path}  ({xlsx_path.stat().st_size / 1024:.1f} KB)")
else:
    print(f"Excel report not found at {xlsx_path}")
Excel report: anomaly_traces/anomaly_step00020_dur23.4ms_perf_report.xlsx (12.6 KB)
Recap#
Time each step with
time.perf_counter()+ a trailingcuda.synchronize()One short pass to set
threshold = 1.5 × medianSchedule that always returns
RECORD_AND_SAVE→ buffer flushes every stepTrace handler pops
(step, dur)from a single-entry FIFO and writes to disk only ifdur > thresholdAlways-on profiler with CUDA-only activities; training loop is generic and unaware of detection
Once you have per-anomaly trace files, run them through generate_perf_report_pytorch (or the CLI TraceLens_generate_perf_report_pytorch). For deeper analysis see the profiling analysis blog.