Using rocprofv3#
rocprofv3 is a CLI tool that helps you optimize applications and analyze the low-level kernel details without requiring any modification in the source code.
It’s backward compatible with its predecessor, rocprof, and provides enhanced features for application profiling with better accuracy.
The following sections demonstrate the use of rocprofv3 for application tracing and kernel counter collection using various command-line options.
rocprofv3 is installed with ROCm under /opt/rocm/bin. To use the tool from anywhere in the system, export the PATH variable:
export PATH=$PATH:/opt/rocm/bin
Before tracing or profiling your HIP application using rocprofv3, build it using:
cmake -B <build-directory> <source-directory> -DCMAKE_PREFIX_PATH=/opt/rocm
cmake --build <build-directory> --target all --parallel <N>
Command-line options#
The following table lists the commonly used rocprofv3 command-line options categorized according to their purpose.
Purpose |
Option |
Description |
|---|---|---|
I/O options |
-i INPUT | --input INPUT -o OUTPUT_FILE | --output-file OUTPUT_FILE -d OUTPUT_DIRECTORY | --output-directory OUTPUT_DIRECTORY --output-format {csv,json,pftrace,otf2,rocpd} [{csv,json,pftrace,otf2,rocpd} ...] --log-level {fatal,error,warning,info,trace,env} -E EXTRA_COUNTERS | --extra-counters EXTRA_COUNTERS |
Specifies the path to the input file. JSON and YAML formats support configuration of all command-line options for tracing and profiling whereas the text format supports only the specification of HW counters.
Specifies output file name. If nothing is specified, the default path is
%hostname%/%pid%. Specifies the output path for saving the output files. If nothing is specified, the default path is
%hostname%/%pid%. Specifies output format. Supported formats: CSV, JSON, PFTrace, OTF2 and rocpd.
Sets the desired log level.
Specifies the path to a YAML file consisting of extra counter definitions.
|
Aggregate tracing |
-r [BOOL] | --runtime-trace [BOOL] -s [BOOL] | --sys-trace [BOOL] |
Collects tracing data for HIP runtime API, marker (ROCTx) API, RCCL API, memory operations (copies, scratch, and allocation), and kernel dispatches. Similar to
--sys-trace but without HIP compiler API and the underlying HSA API tracing. Collects tracing data for HIP API, HSA API, marker (ROCTx) API, RCCL API, memory operations (copies, scratch, and allocations), and kernel dispatches.
|
PC sampling |
--pc-sampling-beta-enabled [BOOL] --pc-sampling-unit {instructions,cycles,time} --pc-sampling-method {stochastic,host_trap} --pc-sampling-interval PC_SAMPLING_INTERVAL |
Enables PC sampling and sets the ROCPROFILER_PC_SAMPLING_BETA_ENABLED environment variable. Note that PC sampling support is in beta version.
Specifies the unit for PC sampling type or method. Note that only units of time are supported.
Specifies the PC sampling type. Note that only host trap method is supported.
Specifies the PC sample generation frequency.
|
Basic tracing |
--hip-trace [BOOL] --marker-trace [BOOL] --kernel-trace [BOOL] --memory-copy-trace [BOOL] --memory-allocation-trace [BOOL] --scratch-memory-trace [BOOL] --hsa-trace [BOOL] --rccl-trace [BOOL] --kokkos-trace [BOOL] --rocdecode-trace [BOOL] |
Combination of
--hip-runtime-trace and --hip-compiler-trace. This option only enables the HIP API tracing. Unlike previous iterations of rocprof, this option doesn’t enable kernel tracing, memory copy tracing, and so on. Collects marker (ROCTx) traces. Similar to
--roctx-trace option in earlier rocprof versions, but with improved ROCTx library with more features. Collects kernel dispatch traces.
Collects memory copy traces. This was a part of the HIP and HSA traces in previous
rocprof versions. Collects memory allocation traces. Displays starting address, allocation size, and the agent where allocation occurs.
Collects scratch memory operations traces. Helps in determining scratch allocations and manage them efficiently.
Collects
--hsa-core-trace, --hsa-amd-trace, --hsa-image-trace, and --hsa-finalizer-trace. This option only enables the HSA API tracing. Unlike previous iterations of rocprof, this doesn’t enable kernel tracing, memory copy tracing, and so on. Collects traces for RCCL (ROCm Communication Collectives Library), which is also pronounced as ‘Rickle’.
Enables builtin Kokkos tools support, which implies enabling
--marker-trace collection and --kernel-rename. Collects traces for rocDecode APIs.
|
Granular tracing |
--hip-runtime-trace [BOOL] --hip-compiler-trace [BOOL] --hsa-core-trace [BOOL] --hsa-amd-trace [BOOL] --hsa-image-trace [BOOL] --hsa-finalizer-trace [BOOL] |
Collects HIP Runtime API traces. For example, public HIP API functions starting with
hip such as hipSetDevice. Collects HIP Compiler generated code traces. For example, HIP API functions starting with
__hip such as __hipRegisterFatBinary. Collects HSA API traces (core API). For example, HSA functions prefixed with only
hsa_ such as hsa_init. Collects HSA API traces (AMD-extension API). For example, HSA functions prefixed with
hsa_amd_ such as hsa_amd_coherency_get_type. Collects HSA API traces (image-extenson API). For example, HSA functions prefixed with only
hsa_ext_image_ such as hsa_ext_image_get_capability. Collects HSA API traces (Finalizer-extension API). For example, HSA functions prefixed with only
hsa_ext_program_ such as hsa_ext_program_create. |
Counter collection |
--pmc [PMC …] |
Specifies performance monitoring counters to be collected. Use comma or space to specify more than one counter. Also note that the job fails if the entire set of counters can’t be collected in single pass.
|
Post-processing tracing |
--stats [BOOL] -S [BOOL] | --summary [BOOL] -D [BOOL] | --summary-per-domain [BOOL] --summary-groups REGULAR_EXPRESSION [REGULAR_EXPRESSION …] |
Collects statistics of enabled tracing types. Must be combined with one or more tracing options. Doesn’t include default kernel stats unlike previous
rocprof versions. Displays single summary of tracing data for the enabled tracing type, after conclusion of the profiling session. Displays a summary of tracing data for the enabled tracing type, after conclusion of the profiling session.
Displays a summary of each tracing domain for the enabled tracing type, after conclusion of the profiling session.
Displays a summary for each set of domains matching the specified regular expression. For example, ‘KERNEL_DISPATCH|MEMORY_COPY’ generates a summary of all the tracing data in the KERNEL_DISPATCH and MEMORY_COPY domains. Similarly ‘*._API’ generates a summary of all the tracing data in the
HIP_API, HSA_API, and MARKER_API domains. |
Summary |
--summary-output-file SUMMARY_OUTPUT_FILE -u {sec,msec,usec,nsec} | --summary-units {sec,msec,usec,nsec} |
Outputs summary to a file, stdout, or stderr. By default, outputs to stderr.
Specifies timing unit for output summary.
|
Kernel naming |
-M [BOOL] | --mangled-kernels [BOOL] -T [BOOL] | --truncate-kernels [BOOL] --kernel-rename [BOOL] |
Overrides the default demangling of kernel names.
Truncates the demangled kernel names for improved readability. In earlier
rocprof versions, this was known as --basenames [on/off]. Uses region names defined using
roctxRangePush or roctxRangePop to rename the kernels. Was known as --roctx-rename in earlier rocprof versions. |
Filtering |
--kernel-include-regex REGULAR_EXPRESSION --kernel-exclude-regex REGULAR_EXPRESSION --kernel-iteration-range KERNEL_ITERATION_RANGE [KERNEL_ITERATION_RANGE …] -P (START_DELAY_TIME):(COLLECTION_TIME):(REPEAT) [(START_DELAY_TIME):(COLLECTION_TIME):(REPEAT) …] | --collection-period (START_DELAY_TIME):(COLLECTION_TIME):(REPEAT) [(START_DELAY_TIME):(COLLECTION_TIME):(REPEAT) …] --collection-period-unit {hour,min,sec,msec,usec,nsec} |
Filters counter-collection and thread-trace data to include the kernels matching the specified regular expression. Non-matching kernels are excluded.
Filters counter-collection and thread-trace data to exclude the kernels matching the specified regular expression. It is applied after
--kernel-include-regex option. Specifies iteration range for each kernel matching the filter [start-stop].
START_DELAY_TIME: Time in seconds before the data collection begins.
COLLECTION_TIME: Duration of data collection in seconds. REPEAT: Number of times the data collection cycle is repeated. The default unit for time is seconds, which can be changed using the --collection-period-unit option. To repeat the cycle indefinitely, specify repeat as 0. You can specify multiple configurations, each defined by a triplet in the format start_delay_time:collection_time:repeat. For example, the command -P 10:10:1 5:3:0 specifies two configurations, the first one with a start delay time of 10 seconds, a collection time of 10 seconds, and a repeat of 1 (the cycle repeats once), and the second with a start delay time of 5 seconds, a collection time of 3 seconds, and a repeat of 0 (the cycle repeats indefinitely). To change the unit of time used in
--collection-period or -P, specify the desired unit using the --collection-period-unit option. The available units are hour for hours, min for minutes, sec for seconds, msec for milliseconds, usec for microseconds, and nsec for nanoseconds. |
Perfetto-specific |
--perfetto-backend {inprocess,system} --perfetto-buffer-size KB --perfetto-buffer-fill-policy {discard,ring_buffer} --perfetto-shmem-size-hint KB |
Specifies backend for Perfetto data collection. When selecting ‘system’ mode, ensure to run the Perfetto
traced daemon and then start a Perfetto session. Specifies buffer size for Perfetto output in KB. Default: 1 GB.
Specifies policy for handling new records when Perfetto reaches the buffer limit.
Specifies Perfetto shared memory size hint in KB. Default: 64 KB.
|
Display |
-L [BOOL] | --list-avail [BOOL] --group-by-queue [BOOL] |
Lists the PC sampling configurations and metrics available in the counter_defs.yaml file for counter collection. In earlier
rocprof versions, this was known as --list-basic, --list-derived, and --list-counters. For displaying the HSA Queues that kernels and memory copy operations are submitted to rather than the default grouping of HIP Streams for perfetto.
|
Other |
--preload PRELOAD --minimum-output-data --disable-signal-handlers |
Specifies libraries to prepend to
LD_PRELOAD. It is useful for sanitizer libraries. Output files are generated only if output data size is greater than minimum output data size. It can be used for controlling the generation of output files so that user don’t recieve empty files. The input is in KB units.
Disables the signal handlers in the rocprofv3 tool. It disables the prioritizing of rocprofv3 signal handler over application installed signal handler. When –disable-signal-handlers is set to true, and application has its signal handler on SIGSEGV or similar installed, then its signal handler will be used not the rocprofv3 signal handler. Note: glog still installs signal handlers which provide backtraces.
|
To see exhaustive list of rocprofv3 options:
rocprofv3 --help
Application tracing#
Application tracing provides the big picture of a program’s execution by collecting data on the execution times of API calls and GPU commands, such as kernel execution, async memory copy, and barrier packets. This information can be used as the first step in the profiling process to answer important questions, such as how much percentage of time was spent on memory copy and which kernel took the longest time to execute.
To use rocprofv3 for application tracing, run:
rocprofv3 <tracing_option> -- <application_path>
Note
All the tracing examples below use the --output-format csv option to generate output in CSV format.
However, the default output format is rocpd (SQLite3 database). You can simply omit the --output-format option to generate output in the default format.
rocpd format can be converted to other formats such as CSV, OTF2, and PFTrace using the rocpd module.
To understand how to convert rocpd output to other formats, see Using rocpd Output Format.
HIP trace#
HIP trace comprises execution traces for the entire application at the HIP level. This includes HIP API functions and their asynchronous activities at the runtime level. In general, HIP APIs directly interact with the user program. It is easier to analyze HIP traces as you can directly map them to the program.
Unlike previous iterations of rocprof, this does not enable kernel tracing, memory copy tracing, and so on. If you want to enable kernel tracing, memory copy tracing, they need to be provided explicitly.
To trace HIP runtime APIs, use:
rocprofv3 --hip-trace --output-format csv -- <application_path>
The preceding command generates a hip_api_trace.csv file prefixed with the process ID.
$ cat 238_hip_api_trace.csv
Here are the contents of hip_api_trace.csv file:
Domain |
Function |
Process_Id |
Thread_Id |
Correlation_Id |
Start_Timestamp |
End_Timestamp |
|---|---|---|---|---|---|---|
HIP_COMPILER_API_EXT |
__hipRegisterFatBinary |
15 |
15 |
1 |
1055015439953054 |
1055015439976484 |
HIP_COMPILER_API_EXT |
__hipRegisterFunction |
15 |
15 |
2 |
1055015439992584 |
1055015440011104 |
HIP_COMPILER_API_EXT |
__hipRegisterFunction |
15 |
15 |
3 |
1055015440011744 |
1055015440013824 |
HIP_COMPILER_API_EXT |
__hipRegisterFunction |
15 |
15 |
4 |
1055015440014244 |
1055015440014534 |
HIP_COMPILER_API_EXT |
__hipRegisterFunction |
15 |
15 |
5 |
1055015440014854 |
1055015440015524 |
HIP_RUNTIME_API_EXT |
hipGetDeviceCount |
15 |
15 |
6 |
1055015440617618 |
1055015539800733 |
HIP_RUNTIME_API_EXT |
hipSetDevice |
15 |
15 |
7 |
1055015539819503 |
1055015539821693 |
HIP_RUNTIME_API_EXT |
hipDeviceSynchronize |
15 |
15 |
8 |
1055015539832333 |
1055015539840903 |
HIP_RUNTIME_API_EXT |
hipStreamCreateWithFlags |
15 |
15 |
9 |
1055015539861673 |
1055015865247140 |
HIP_RUNTIME_API_EXT |
hipHostMalloc |
15 |
15 |
10 |
1055015865309761 |
1055015865849494 |
HIP_RUNTIME_API_EXT |
hipHostMalloc |
15 |
15 |
11 |
1055015865850944 |
1055015866265546 |
HIP_RUNTIME_API_EXT |
hipHostMalloc |
15 |
15 |
12 |
1055015866266646 |
1055015867082900 |
HIP_RUNTIME_API_EXT |
hipMallocAsync |
15 |
15 |
13 |
1055015867356542 |
1055015867662314 |
HIP_RUNTIME_API_EXT |
hipMallocAsync |
15 |
15 |
14 |
1055015867664174 |
1055015867937465 |
HIP_RUNTIME_API_EXT |
hipMallocAsync |
15 |
15 |
15 |
1055015867938815 |
1055015868219987 |
HIP_RUNTIME_API_EXT |
hipMemcpyAsync |
15 |
15 |
16 |
1055015868240137 |
1055015917307652 |
HIP_RUNTIME_API_EXT |
hipMemcpyAsync |
15 |
15 |
17 |
1055015917337263 |
1055015917360493 |
rocprofv3 provides options to collect traces at more granular level. For HIP, you can collect traces for HIP compile time APIs and runtime APIs separately.
To collect HIP compile time API traces, use:
rocprofv3 --hip-compiler-trace --output-format csv -- <application_path>
The preceding command generates a hip_api_trace.csv file prefixed with the process ID.
$ cat 208_hip_api_trace.csv
Here are the contents of hip_api_trace.csv file:
Domain |
Function |
Process_Id |
Thread_Id |
Correlation_Id |
Start_Timestamp |
End_Timestamp |
|---|---|---|---|---|---|---|
HIP_COMPILER_API_EXT |
__hipRegisterFatBinary |
15 |
15 |
1 |
1055015439953054 |
1055015439976484 |
HIP_COMPILER_API_EXT |
__hipRegisterFunction |
15 |
15 |
2 |
1055015439992584 |
1055015440011104 |
HIP_COMPILER_API_EXT |
__hipRegisterFunction |
15 |
15 |
3 |
1055015440011744 |
1055015440013824 |
HIP_COMPILER_API_EXT |
__hipRegisterFunction |
15 |
15 |
4 |
1055015440014244 |
1055015440014534 |
HIP_COMPILER_API_EXT |
__hipRegisterFunction |
15 |
15 |
5 |
1055015440014854 |
1055015440015524 |
To collect HIP runtime time API traces, use:
rocprofv3 --hip-runtime-trace --output-format csv -- <application_path>
The preceding command generates a hip_api_trace.csv file prefixed with the process ID.
$ cat 208_hip_api_trace.csv
Here are the contents of hip_api_trace.csv file:
Domain |
Function |
Process_Id |
Thread_Id |
Correlation_Id |
Start_Timestamp |
End_Timestamp |
|---|---|---|---|---|---|---|
HIP_RUNTIME_API_EXT |
hipGetDevicePropertiesR0600 |
238 |
238 |
1 |
1191915574691984 |
1191915687784011 |
HIP_RUNTIME_API_EXT |
hipMalloc |
238 |
238 |
2 |
1191915691312459 |
1191915691388696 |
HIP_RUNTIME_API_EXT |
hipMalloc |
238 |
238 |
3 |
1191915691390637 |
1191915691423279 |
HIP_RUNTIME_API_EXT |
hipMemcpy |
238 |
238 |
4 |
1191915691439107 |
1191916547828448 |
HIP_RUNTIME_API_EXT |
hipLaunchKernel |
238 |
238 |
5 |
1191916547842972 |
1191916548408842 |
HIP_RUNTIME_API_EXT |
hipMemcpy |
238 |
238 |
6 |
1191916548412677 |
1191916550217834 |
HIP_RUNTIME_API_EXT |
hipFree |
238 |
238 |
7 |
1191916562618151 |
1191916562789093 |
HIP_RUNTIME_API_EXT |
hipFree |
238 |
238 |
8 |
1191916562790923 |
1191916562836351 |
For the description of the fields in the output file, see Output file fields.
HSA trace#
The HIP runtime library is implemented with the low-level HSA runtime. HSA API tracing is more suited for advanced users who want to understand the application behavior at the lower level. In general, tracing at the HIP level is recommended for most users. You should use HSA trace only if you are familiar with HSA runtime.
HSA trace contains the start and end time of HSA runtime API calls and their asynchronous activities.
rocprofv3 --hsa-trace --output-format csv -- <application_path>
The preceding command generates a hsa_api_trace.csv file prefixed with process ID. Note that the contents of this file have been truncated for demonstration purposes.
$ cat 197_hsa_api_trace.csv
Here are the contents of hsa_api_trace.csv file:
Domain |
Function |
Process_Id |
Thread_Id |
Correlation_Id |
Start_Timestamp |
End_Timestamp |
|---|---|---|---|---|---|---|
HSA_CORE_API |
hsa_system_get_major_extension_table |
197 |
197 |
1 |
1507843974724237 |
1507843974724947 |
HSA_CORE_API |
hsa_agent_get_info |
197 |
197 |
3 |
1507843974754471 |
1507843974755014 |
HSA_AMD_EXT_API |
hsa_amd_memory_pool_get_info |
197 |
197 |
5 |
1507843974761705 |
1507843974762398 |
HSA_AMD_EXT_API |
hsa_amd_memory_pool_get_info |
197 |
197 |
6 |
1507843974763901 |
1507843974764030 |
HSA_AMD_EXT_API |
hsa_amd_memory_pool_get_info |
197 |
197 |
7 |
1507843974765121 |
1507843974765224 |
HSA_AMD_EXT_API |
hsa_amd_memory_pool_get_info |
197 |
197 |
8 |
1507843974766196 |
1507843974766328 |
HSA_AMD_EXT_API |
hsa_amd_memory_pool_get_info |
197 |
197 |
9 |
1507843974767534 |
1507843974767641 |
HSA_AMD_EXT_API |
hsa_amd_memory_pool_get_info |
197 |
197 |
10 |
1507843974768639 |
1507843974768779 |
HSA_AMD_EXT_API |
hsa_amd_agent_iterate_memory_pools |
197 |
197 |
4 |
1507843974758768 |
1507843974769238 |
HSA_CORE_API |
hsa_agent_get_info |
197 |
197 |
11 |
1507843974771091 |
1507843974771537 |
rocprofv3 provides options to collect HSA traces at more granular level. HSA traces can be collected separately for four API domains: HSA_AMD_EXT_API, HSA_CORE_API, HSA_IMAGE_EXT_API and HSA_FINALIZE_EXT_API.
To collect HSA core API traces, use:
rocprofv3 --hsa-core-trace --output-format csv -- <application_path>
The preceding command generates a hsa_api_trace.csv file prefixed with process ID. Note that the contents of this file have been truncated for demonstration purposes.
$ cat 197_hsa_api_trace.csv
Here are the contents of hsa_api_trace.csv file:
Domain |
Function |
Process_Id |
Thread_Id |
Correlation_Id |
Start_Timestamp |
End_Timestamp |
|---|---|---|---|---|---|---|
HSA_CORE_API |
hsa_system_get_major_extension_table |
57 |
57 |
1 |
1056813747808832 |
1056813747809252 |
HSA_CORE_API |
hsa_agent_get_info |
57 |
57 |
3 |
1056813747826572 |
1056813747826672 |
HSA_CORE_API |
hsa_agent_get_info |
57 |
57 |
4 |
1056813747837582 |
1056813747837622 |
HSA_CORE_API |
hsa_agent_get_info |
57 |
57 |
5 |
1056813747838542 |
1056813747838582 |
HSA_CORE_API |
hsa_agent_get_info |
57 |
57 |
6 |
1056813747839042 |
1056813747839082 |
HSA_CORE_API |
hsa_agent_get_info |
57 |
57 |
7 |
1056813747839512 |
1056813747839622 |
HSA_CORE_API |
hsa_iterate_agents |
57 |
57 |
2 |
1056813747821012 |
1056813747839832 |
HSA_CORE_API |
hsa_agent_get_info |
57 |
57 |
8 |
1056813747843832 |
1056813747844132 |
HSA_CORE_API |
hsa_agent_get_info |
57 |
57 |
9 |
1056813747844482 |
1056813747844542 |
HSA_CORE_API |
hsa_agent_iterate_isas |
57 |
57 |
10 |
1056813747849402 |
1056813747850422 |
HSA_CORE_API |
hsa_isa_get_info_alt |
57 |
57 |
11 |
1056813747853542 |
1056813747875253 |
HSA_CORE_API |
hsa_isa_get_info_alt |
57 |
57 |
12 |
1056813747875883 |
1056813747878353 |
HSA_CORE_API |
hsa_agent_get_info |
57 |
57 |
13 |
1056813747886343 |
1056813747886403 |
HSA_CORE_API |
hsa_agent_get_info |
57 |
57 |
54 |
1056813748282015 |
1056813748282085 |
HSA_CORE_API |
hsa_system_get_info |
57 |
57 |
55 |
1056813748282465 |
1056813748282505 |
HSA_CORE_API |
hsa_signal_create |
57 |
57 |
56 |
1056813749083419 |
1056813749085399 |
HSA_CORE_API |
hsa_agent_get_info |
57 |
57 |
57 |
1056813749741363 |
1056813749741443 |
HSA_CORE_API |
hsa_queue_create |
57 |
57 |
58 |
1056813749744053 |
1056813856914188 |
HSA_CORE_API |
hsa_signal_create |
57 |
57 |
59 |
1056813857149169 |
1056813857154109 |
HSA_CORE_API |
hsa_signal_create |
57 |
57 |
60 |
1056813857154929 |
1056813857155389 |
HSA_CORE_API |
hsa_signal_create |
57 |
57 |
61 |
1056813857155949 |
1056813857156429 |
HSA_CORE_API |
hsa_signal_create |
57 |
57 |
62 |
1056813857157169 |
1056813857157349 |
HSA_CORE_API |
hsa_executable_create_alt |
57 |
57 |
63 |
1056813965439362 |
1056813965466952 |
HSA_CORE_API |
hsa_code_object_reader_create_from_memory |
57 |
57 |
64 |
1056813965476642 |
1056813965587493 |
HSA_CORE_API |
hsa_executable_load_agent_code_object |
57 |
57 |
65 |
1056813965592483 |
1056813965965295 |
HSA_CORE_API |
hsa_signal_create |
57 |
57 |
67 |
1056813966149786 |
1056813966151706 |
HSA_CORE_API |
hsa_signal_wait_scacquire |
57 |
57 |
68 |
1056813966156596 |
1056813966158646 |
HSA_CORE_API |
hsa_signal_destroy |
57 |
57 |
69 |
1056813966162276 |
1056813966163746 |
HSA_CORE_API |
hsa_executable_freeze |
57 |
57 |
66 |
1056813965973105 |
1056813966778050 |
HSA_CORE_API |
hsa_executable_get_symbol_by_name |
57 |
57 |
70 |
1056813966800070 |
1056813966801880 |
HSA_CORE_API |
hsa_executable_symbol_get_info |
57 |
57 |
71 |
1056813966805750 |
1056813966805980 |
HSA_CORE_API |
hsa_executable_symbol_get_info |
57 |
57 |
72 |
1056813966806300 |
1056813966806340 |
For the description of the fields in the output file, see Output file fields.
Marker trace#
Note
To use rocprofv3 for marker tracing, including and linking to old ROCTx works but it’s recommended to switch to the new ROCTx to utilize new APIs.
To use the new ROCTx, include header "rocprofiler-sdk-roctx/roctx.h" and link your application with librocprofiler-sdk-roctx.so.
To see the complete list of ROCTx APIs, see public header file "rocprofiler-sdk-roctx/roctx.h".
To see usage of ROCTx or marker library, see Using ROCTx.
Kokkos trace#
Kokkos is a C++ library for writing performance portable applications. Kokkos is widely used in scientific applications to write performance-portable code for CPUs, GPUs, and other accelerators.
rocprofv3 loads an inbuilt Kokkos Tools library, which emits roctx ranges with the labels passed using Kokkos APIs. For example, Kokkos::parallel_for(“MyParallelForLabel”, …) calls roctxRangePush internally and enables the kernel renaming option to replace the highly templated kernel names with the Kokkos labels.
To enable the inbuilt marker support, use the kokkos-trace option. Internally, this option automatically enables marker-trace and kernel-rename:
rocprofv3 --kokkos-trace --output-format csv -- <application_path>
The preceding command generates a marker-trace file prefixed with the process ID.
 $ cat 210_marker_api_trace.csv
"Domain","Function","Process_Id","Thread_Id","Correlation_Id","Start_Timestamp","End_Timestamp"
"MARKER_CORE_API","Kokkos::Initialization Complete",4069256,4069256,1,56728499773965,56728499773965
"MARKER_CORE_API","Kokkos::Impl::CombinedFunctorReducer<CountFunctor, Kokkos::Impl::FunctorAnalysis<Kokkos::Impl::FunctorPatternInterface::REDUCE, Kokkos::RangePolicy<Kokkos::Serial>, CountFunctor, long int>::Reducer, void>",4069256,4069256,2,56728501756088,56728501764241
"MARKER_CORE_API","Kokkos::parallel_reduce: fence due to result being value, not view",4069256,4069256,4,56728501767957,56728501769600
"MARKER_CORE_API","Kokkos::Finalization Complete",4069256,4069256,6,56728502054554,56728502054554
Kernel trace#
To trace kernel dispatch traces, use:
rocprofv3 --kernel-trace --output-format csv -- <application_path>
The preceding command generates a kernel_trace.csv file prefixed with the process ID.
$ cat 199_kernel_trace.csv
Here are the contents of kernel_trace.csv file:
Kind |
Agent_Id |
Queue_Id |
Stream_Id |
Thread_Id |
Dispatch_Id |
Kernel_Id |
Kernel_Name |
Correlation_Id |
Start_Timestamp |
End_Timestamp |
LDS_Block_Size |
Scratch_Size |
VGPR_Count |
Accum_VGPR_Count |
SGPR_Count |
Workgroup_Size_X |
Workgroup_Size_Y |
Workgroup_Size_Z |
Grid_Size_X |
Grid_Size_Y |
Grid_Size_Z |
|---|---|---|---|---|---|---|---|---|---|---|---|---|---|---|---|---|---|---|---|---|---|
KERNEL_DISPATCH |
Agent 4 |
1 |
1 |
834304 |
1 |
10 |
void addition_kernel<float>(float*, float const*, float const*, int, int) |
1 |
1550151853029637 |
1550151853042437 |
0 |
0 |
8 |
0 |
16 |
64 |
1 |
1 |
1024 |
1024 |
1 |
KERNEL_DISPATCH |
Agent 4 |
1 |
1 |
834304 |
4 |
11 |
divide_kernel(float*, float const*, float const*, int, int) |
4 |
1550151853064037 |
1550151853075237 |
0 |
0 |
12 |
4 |
16 |
64 |
1 |
1 |
1024 |
1024 |
1 |
KERNEL_DISPATCH |
Agent 4 |
1 |
1 |
834304 |
3 |
12 |
multiply_kernel(float*, float const*, float const*, int, int) |
3 |
1550151853052877 |
1550151853064037 |
0 |
0 |
8 |
0 |
16 |
64 |
1 |
1 |
1024 |
1024 |
1 |
KERNEL_DISPATCH |
Agent 4 |
1 |
1 |
834304 |
2 |
13 |
subtract_kernel(float*, float const*, float const*, int, int) |
2 |
1550151853042437 |
1550151853050677 |
0 |
0 |
8 |
0 |
16 |
64 |
1 |
1 |
1024 |
1024 |
1 |
KERNEL_DISPATCH |
Agent 4 |
2 |
2 |
834304 |
5 |
10 |
void addition_kernel<float>(float*, float const*, float const*, int, int) |
5 |
1550151853082957 |
1550151853094357 |
0 |
0 |
8 |
0 |
16 |
64 |
1 |
1 |
1024 |
1024 |
1 |
KERNEL_DISPATCH |
Agent 4 |
2 |
2 |
834304 |
6 |
13 |
subtract_kernel(float*, float const*, float const*, int, int) |
6 |
1550151853094357 |
1550151853103517 |
0 |
0 |
8 |
0 |
16 |
64 |
1 |
1 |
1024 |
1024 |
1 |
KERNEL_DISPATCH |
Agent 4 |
4 |
4 |
834304 |
13 |
10 |
void addition_kernel<float>(float*, float const*, float const*, int, int) |
13 |
1550151853164197 |
1550151853174037 |
0 |
0 |
8 |
0 |
16 |
64 |
1 |
1 |
1024 |
1024 |
1 |
KERNEL_DISPATCH |
Agent 4 |
3 |
3 |
834304 |
12 |
11 |
divide_kernel(float*, float const*, float const*, int, int) |
12 |
1550151853148397 |
1550151853160837 |
0 |
0 |
12 |
4 |
16 |
64 |
1 |
1 |
1024 |
1024 |
1 |
KERNEL_DISPATCH |
Agent 4 |
3 |
3 |
834304 |
11 |
12 |
multiply_kernel(float*, float const*, float const*, int, int) |
11 |
1550151853138477 |
1550151853148397 |
0 |
0 |
8 |
0 |
16 |
64 |
1 |
1 |
1024 |
1024 |
1 |
For the description of the fields in the output file, see Output file fields.
Memory copy trace#
Memory copy traces track hipMemcpy and hipMemcpyAsync functions, which use the hsa_amd_memory_async_copy_on_engine HSA functions internally. To trace memory moves across the application, use:
rocprofv3 –-memory-copy-trace --output-format csv -- <application_path>
The preceding command generates a memory_copy_trace.csv file prefixed with the process ID.
$ cat 197_memory_copy_trace.csv
Here are the contents of memory_copy_trace.csv file:
Kind |
Direction |
Stream_Id |
Source_Agent_Id |
Destination_Agent_Id |
Correlation_Id |
Start_Timestamp |
End_Timestamp |
|---|---|---|---|---|---|---|---|
MEMORY_COPY |
MEMORY_COPY_HOST_TO_DEVICE |
0 |
Agent 0 |
Agent 4 |
1 |
1057963336487172 |
1057963336564212 |
MEMORY_COPY |
MEMORY_COPY_HOST_TO_DEVICE |
0 |
Agent 0 |
Agent 4 |
2 |
1057963336783973 |
1057963336859334 |
MEMORY_COPY |
MEMORY_COPY_DEVICE_TO_HOST |
0 |
Agent 4 |
Agent 0 |
23 |
1057963497396292 |
1057963497471732 |
MEMORY_COPY |
MEMORY_COPY_DEVICE_TO_HOST |
0 |
Agent 4 |
Agent 0 |
24 |
1057963498099125 |
1057963498200446 |
For the description of the fields in the output file, see Output file fields.
Memory allocation trace#
Memory allocation traces track the HSA functions hsa_memory_allocate,
hsa_amd_memory_pool_allocate, and hsa_amd_vmem_handle_create`. The function
hipMalloc calls these underlying HSA functions allowing memory allocations to be
tracked.
In addition to the HSA memory allocation functions listed above, the corresponding HSA
free functions hsa_memory_free, hsa_amd_memory_pool_free, and hsa_amd_vmem_handle_release
are also tracked. Unlike the allocation functions, however, only the address of the freed memory
is recorded. As such, the agent id and size of the freed memory are recorded as 0 in the CSV and
JSON outputs. It should be noted that it is possible for some free functions to records a null
pointer address of 0x0. This situation can occur when some HIP functions such as hipStreamDestroy
call underlying HSA free functions with null pointers, even if the user never explicitly calls
free memory functions with null pointer addresses.
To trace memory allocations during the application run, use:
rocprofv3 –-memory-allocation-trace --output-format csv -- <application_path>
The preceding command generates a memory_allocation_trace.csv file prefixed with the process ID.
$ cat 6489_memory_allocation_trace.csv
Here are the contents of memory_allocation_trace.csv file:
Kind |
Operation |
Agent_Id |
Allocation_Size |
Address |
Correlation_Id |
Start_Timestamp |
End_Timestamp |
|---|---|---|---|---|---|---|---|
MEMORY_ALLOCATION |
MEMORY_ALLOCATION_ALLOCATE |
Agent 0 |
1024 |
0x7fb2d0005000 |
11 |
3721742710532634 |
3721742710584854 |
MEMORY_ALLOCATION |
MEMORY_ALLOCATION_FREE |
Agent 0 |
0 |
0x7fb2d0005000 |
12 |
3721742710596404 |
3721742710933366 |
MEMORY_ALLOCATION |
MEMORY_ALLOCATION_ALLOCATE |
Agent 0 |
1024 |
0x7fb2d0005000 |
13 |
3721742710941416 |
3721742710960916 |
MEMORY_ALLOCATION |
MEMORY_ALLOCATION_FREE |
Agent 0 |
0 |
0x7fb2d0005000 |
14 |
3721742710967236 |
3721742711197647 |
MEMORY_ALLOCATION |
MEMORY_ALLOCATION_ALLOCATE |
Agent 0 |
1024 |
0x7fb2d0005000 |
15 |
3721742711204077 |
3721742711219717 |
MEMORY_ALLOCATION |
MEMORY_ALLOCATION_FREE |
Agent 0 |
0 |
0x7fb2d0005000 |
16 |
3721742711225857 |
3721742711466018 |
For the description of the fields in the output file, see Output file fields.
Runtime trace#
This is a shorthand option that targets the most relevant tracing options for a standard user by excluding traces for HSA runtime API and HIP compiler API.
The HSA runtime API is excluded because it is a lower-level API upon which HIP and OpenMP target are built and thus, tends to be an implementation detail irrelevant to most users. Similarly, the HIP compiler API is also excluded for being an implementation detail as these functions are automatically inserted during HIP compilation.
--runtime-trace traces the HIP runtime API, marker API, kernel dispatches, and
memory operations (copies, allocations, and scratch).
rocprofv3 –-runtime-trace --output-format csv -- <application_path>
Running the preceding command generates hip_api_trace.csv, kernel_trace.csv, memory_copy_trace.csv, scratch_memory_trace.csv, memory_allocation_trace.csv, and marker_api_trace.csv (if ROCTx APIs are specified in the application) files prefixed with the process ID.
System trace#
This is an all-inclusive option to collect HIP, HSA, kernel, memory copy, memory allocation, and marker trace (if ROCTx APIs are specified in the application).
rocprofv3 –-sys-trace --output-format csv -- <application_path>
Running the preceding command generates hip_api_trace.csv, hsa_api_trace.csv, kernel_trace.csv, memory_copy_trace.csv, scratch_memory_trace.csv, memory_allocation_trace.csv, and marker_api_trace.csv if ROCTx APIs are specified in the application.
Scratch memory trace#
This option collects scratch memory operation traces. Scratch is an address space on AMD GPUs roughly equivalent to the local memory in NVIDIA CUDA. The local memory in CUDA is a thread-local global memory with interleaved addressing, which is used for register spills or stack space. This option helps to trace when the rocr runtime allocates, frees, and tries to reclaim scratch memory.
To trace scratch memory allocations during the application run, use:
rocprofv3 –-scratch-memory-trace --output-format csv -- <application_path>
The preceding command generates a scratch_memory_trace.csv file prefixed with the process ID.
$ cat 100_scratch_memory_trace.csv
Here are the contents of scratch_memory_trace.csv file:
Kind |
Operation |
Agent_Id |
Queue_Id |
Thread_Id |
Alloc_Flags |
Start_Timestamp |
End_Timestamp |
|---|---|---|---|---|---|---|---|
SCRATCH_MEMORY |
SCRATCH_MEMORY_ALLOC |
Agent 4 |
1 |
113 |
0 |
1124926523146168 |
1124926554133606 |
SCRATCH_MEMORY |
SCRATCH_MEMORY_ALLOC |
Agent 4 |
1 |
113 |
0 |
1124926554522025 |
1124927132642186 |
For the description of the fields in the output file, see Output file fields.
RCCL trace#
RCCL (pronounced “Rickle”) is a stand-alone library of standard collective communication routines for GPUs. This option traces those communication routines.
rocprofv3 --rccl-trace --output-format csv -- <application_path>
The preceding command generates a rccl_api_trace file prefixed with the process ID.
$ cat 197_rccl_api_trace.csv
Here are the contents of rccl_api_trace.csv file:
Domain |
Function |
Process_Id |
Thread_Id |
Correlation_Id |
Start_Timestamp |
End_Timestamp |
|---|---|---|---|---|---|---|
RCCL_API |
ncclGetVersion |
1834151 |
1834151 |
416 |
18413845573432 |
18413845577374 |
RCCL_API |
ncclGetUniqueId |
1834151 |
1834151 |
1116 |
18413961300878 |
18413963267869 |
RCCL_API |
ncclGetUniqueId |
1834151 |
1834151 |
1481 |
18414166449182 |
18414166720831 |
RCCL_API |
ncclGroupStart |
1834151 |
1834151 |
1482 |
18414166723772 |
18414166726834 |
RCCL_API |
ncclGroupEnd |
1834151 |
1834151 |
1490 |
18414166823575 |
18414380520973 |
RCCL_API |
ncclCommInitAll |
1834151 |
1834151 |
1477 |
18414166402665 |
18414380522536 |
RCCL_API |
ncclCommGetAsyncError |
1834151 |
1834151 |
89098 |
18414380660695 |
18414380661652 |
RCCL_API |
ncclAllReduce |
1834151 |
1834151 |
89097 |
18414380653860 |
18414380693574 |
RCCL_API |
ncclCommGetAsyncError |
1834151 |
1834151 |
89108 |
18414380694631 |
18414380694659 |
RCCL_API |
ncclAllReduce |
1834151 |
1834151 |
89107 |
18414380694212 |
18414380704722 |
RCCL_API |
ncclCommGetAsyncError |
1834151 |
1834151 |
89117 |
18414380706650 |
18414380706677 |
RCCL_API |
ncclAllReduce |
1834151 |
1834151 |
89116 |
18414380705574 |
18414380715055 |
RCCL_API |
ncclCommGetAsyncError |
1834151 |
1834151 |
89126 |
18414380715749 |
18414380715774 |
RCCL_API |
ncclAllReduce |
1834151 |
1834151 |
89125 |
18414380715463 |
18414380723944 |
RCCL_API |
ncclCommGetAsyncError |
1834151 |
1834151 |
89135 |
18414380724688 |
18414380724715 |
RCCL_API |
ncclAllReduce |
1834151 |
1834151 |
89134 |
18414380724395 |
18414380732209 |
RCCL_API |
ncclCommGetAsyncError |
1834151 |
1834151 |
89154 |
18414380746383 |
18414380746411 |
RCCL_API |
ncclCommGetAsyncError |
1834151 |
1834151 |
89157 |
18414380749863 |
18414380749889 |
RCCL_API |
ncclCommGetAsyncError |
1834151 |
1834151 |
89160 |
18414380751671 |
18414380751696 |
RCCL_API |
ncclCommGetAsyncError |
1834151 |
1834151 |
89163 |
18414380753326 |
18414380753353 |
RCCL_API |
ncclCommGetAsyncError |
1834151 |
1834151 |
89166 |
18414380755128 |
18414380755154 |
rocDecode trace#
rocDecode is a high-performance video decode SDK for AMD GPUs. This option traces the rocDecode API.
rocprofv3 --rocdecode-trace --output-format csv -- <application_path>
The above command generates a rocdecode_api_trace file prefixed with the process ID.
$ cat 41688_rocdecode_api_trace.csv
Here are the contents of rocdecode_api_trace.csv file:
Domain |
Function |
Process_Id |
Thread_Id |
Correlation_Id |
Start_Timestamp |
End_Timestamp |
|---|---|---|---|---|---|---|
ROCDECODE_API |
rocDecCreateVideoParser |
41688 |
41688 |
583 |
615449881677279 |
615449882001583 |
ROCDECODE_API |
rocDecGetDecoderCaps |
41688 |
41688 |
584 |
615449882016054 |
615449882163756 |
ROCDECODE_API |
rocDecGetDecoderCaps |
41688 |
41688 |
588 |
615449886038750 |
615449886050880 |
ROCDECODE_API |
rocDecCreateDecoder |
41688 |
41688 |
591 |
615449886084210 |
615450756910310 |
ROCDECODE_API |
rocDecDecodeFrame |
41688 |
41688 |
595 |
615450757036042 |
615450767147413 |
ROCDECODE_API |
rocDecGetDecodeStatus |
41688 |
41688 |
812 |
615450836779385 |
615450836779575 |
Perfetto will also show rocDecode API arguments. Pointers will not be dereferenced and only the address will be displayed.
rocJPEG trace#
rocJPEG is a high-performance jpeg decode SDK for decoding jpeg images. This option traces the rocJPEG API.
rocprofv3 --rocjpeg-trace --output-format csv -- <application_path>
The above command generates a rocjpeg_api_trace file prefixed with the process ID.
$ cat 41688_rocjpeg_api_trace.csv
Here are the contents of rocjpeg_api_trace.csv file:
Domain |
Function |
Process_Id |
Thread_Id |
Correlation_Id |
Start_Timestamp |
End_Timestamp |
|---|---|---|---|---|---|---|
ROCJPEG_API |
rocJpegCreate |
41884 |
41884 |
105 |
1286306029650499 |
1286306248201233 |
ROCJPEG_API |
rocJpegStreamCreate |
41884 |
41884 |
502 |
1286306248250747 |
1286306248268715 |
ROCJPEG_API |
rocJpegStreamParse |
41884 |
41884 |
503 |
1286306248421385 |
1286306248680757 |
ROCJPEG_API |
rocJpegGetImageInfo |
41884 |
41884 |
504 |
1286306248684203 |
1286306248686556 |
Post-processing tracing options#
rocprofv3 provides options to collect tracing summary or statistics after conclusion of a tracing session. These options are described here.
Stats#
This option collects statistics for the enabled tracing types. For example, it collects statistics of HIP APIs, when HIP trace is enabled. The statistics help to determine the API or function that took the most amount of time.
rocprofv3 --stats --hip-trace --output-format csv -- <application_path>
The preceding command generates a hip_api_stats.csv, domain_stats.csv and hip_api_trace.csv file prefixed with the process ID.
$ cat hip_api_stats.csv
Here are the contents of hip_api_stats.csv file:
Name |
Calls |
TotalDurationNs |
AverageNs |
Percentage |
MinNs |
MaxNs |
StdDev |
|---|---|---|---|---|---|---|---|
hipStreamCreateWithFlags |
4 |
262497406 |
65624351.500000 |
85.15 |
3991286 |
249121840 |
122332531.343496 |
hipGetDeviceCount |
1 |
32505687 |
32505687.000000 |
10.54 |
32505687 |
32505687 |
0.00000000e+00 |
hipHostMalloc |
12 |
6096409 |
508034.083333 |
1.98 |
443793 |
548024 |
39236.753678 |
hipFree |
12 |
1994421 |
166201.750000 |
0.6470 |
7790 |
1036046 |
299086.860470 |
hipMemcpyAsync |
12 |
1368378 |
114031.500000 |
0.4439 |
2490 |
764044 |
249308.051619 |
hipMallocAsync |
12 |
927255 |
77271.250000 |
0.3008 |
51540 |
107671 |
20487.475966 |
hipStreamSynchronize |
12 |
870486 |
72540.500000 |
0.2824 |
140 |
866606 |
250065.900069 |
hipLaunchKernel |
16 |
692734 |
43295.875000 |
0.2247 |
1000 |
670044 |
167133.656647 |
hipStreamDestroy |
4 |
619905 |
154976.250000 |
0.2011 |
92901 |
339252 |
122852.320356 |
hipDeviceSynchronize |
4 |
404252 |
101063.000000 |
0.1311 |
570 |
385212 |
189518.505401 |
hipHostFree |
12 |
271202 |
22600.166667 |
0.0880 |
11950 |
34950 |
7480.268600 |
__hipRegisterFatBinary |
1 |
9000 |
9000.000000 |
2.920e-03 |
9000 |
9000 |
0.00000000e+00 |
__hipRegisterFunction |
4 |
6150 |
1537.500000 |
1.995e-03 |
230 |
5370 |
2555.091323 |
__hipPushCallConfiguration |
16 |
2460 |
153.750000 |
7.980e-04 |
70 |
1140 |
267.503894 |
__hipPopCallConfiguration |
16 |
2000 |
125.000000 |
6.488e-04 |
70 |
680 |
151.613544 |
hipGetLastError |
16 |
1270 |
79.375000 |
4.120e-04 |
50 |
440 |
96.295985 |
hipSetDevice |
1 |
660 |
660.000000 |
2.141e-04 |
660 |
660 |
0.00000000e+00 |
Here are the contents of domain_stats.csv file:
Name |
Calls |
TotalDurationNs |
AverageNs |
Percentage |
MinNs |
MaxNs |
StdDev |
|---|---|---|---|---|---|---|---|
HIP_API |
13 |
458514859 |
35270373.769231 |
100.00 |
2300 |
352276613 |
99315857.546240 |
For the description of the fields in the output file, see Output file fields.
Summary#
This option displays a summary of tracing data for the enabled tracing type, after conclusion of the profiling session.
rocprofv3 -S --hip-trace -- <application_path>

Summary per domain#
This option displays a summary of each tracing domain for the enabled tracing type, after conclusion of the profiling session.
rocprofv3 -D --hsa-trace --hip-trace --output-format csv -- <application_path>
The preceding command generates a hip_trace.csv and hsa_trace.csv file prefixed with the process ID along with displaying the summary of each domain.
Summary groups#
This option displays a summary of multiple domains for the domain names specified on the command line. The summary groups can be separated using a pipe ( | ) symbol.
To see a summary for MEMORY_COPY domains, use:
rocprofv3 --summary-groups MEMORY_COPY --sys-trace -- <application_path>

To see a summary for MEMORY_COPY and HIP_API domains, use:
rocprofv3 --summary-groups 'MEMORY_COPY|HIP_API' --sys-trace -- <application_path>
Summary output file#
This option specifies the output file for the summary. By default, the summary is displayed on stderr. To specify another output file for summary, use:
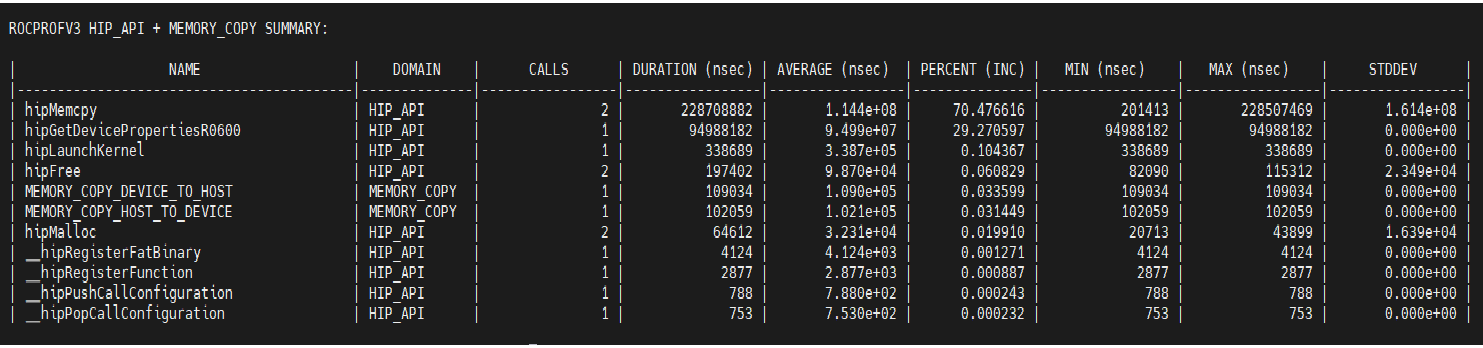
rocprofv3 -S -D --summary-output-file filename --sys-trace -- <application_path>
The preceding command generates an output file named “filename” consisting of the summary for each domain. This also generates the files for the enabled tracing types under -sys-trace option.
ROCPROFV3 HSA_API SUMMARY:
| NAME | DOMAIN | CALLS | DURATION (nsec) | AVERAGE (nsec) | PERCENT (INC) | MIN (nsec) | MAX (nsec) | STDDEV |
|-------------------------------------------|--------------|-----------------|-----------------|-----------------|---------------|-----------------|-----------------|-----------------|
| hsa_queue_create | HSA_API | 4 | 280077621 | 7.002e+07 | 75.372632 | 55026812 | 113288760 | 2.885e+07 |
| hsa_amd_memory_async_copy_on_engine | HSA_API | 24 | 55617052 | 2.317e+06 | 14.967292 | 7580 | 55195188 | 1.126e+07 |
| hsa_amd_memory_pool_allocate | HSA_API | 67 | 26428438 | 3.945e+05 | 7.112246 | 1510 | 857592 | 1.782e+05 |
| hsa_amd_memory_pool_free | HSA_API | 72 | 5176173 | 7.189e+04 | 1.392977 | 290 | 170374 | 3.903e+04 |
| hsa_executable_freeze | HSA_API | 2 | 964125 | 4.821e+05 | 0.259459 | 437471 | 526654 | 6.306e+04 |
| hsa_signal_wait_scacquire | HSA_API | 26 | 853122 | 3.281e+04 | 0.229587 | 2530 | 100782 | 3.394e+04 |
| hsa_executable_load_agent_code_object | HSA_API | 2 | 616175 | 3.081e+05 | 0.165821 | 254476 | 361699 | 7.582e+04 |
| hsa_amd_agents_allow_access | HSA_API | 35 | 430680 | 1.231e+04 | 0.115902 | 4830 | 55182 | 9.939e+03 |
| hsa_signal_store_screlease | HSA_API | 56 | 381491 | 6.812e+03 | 0.102664 | 1560 | 41831 | 7.895e+03 |
| hsa_signal_create | HSA_API | 107 | 160889 | 1.504e+03 | 0.043297 | 80 | 5650 | 1.475e+03 |
| hsa_code_object_reader_create_from_memory | HSA_API | 2 | 151314 | 7.566e+04 | 0.040721 | 32121 | 119193 | 6.157e+04 |
| hsa_signal_load_relaxed | HSA_API | 1296 | 137626 | 1.062e+02 | 0.037037 | 20 | 2930 | 2.712e+02 |
| hsa_signal_destroy | HSA_API | 618 | 111224 | 1.800e+02 | 0.029932 | 40 | 1540 | 2.429e+02 |
| hsa_agent_get_info | HSA_API | 65 | 77472 | 1.192e+03 | 0.020849 | 30 | 47121 | 6.341e+03 |
| hsa_amd_signal_create | HSA_API | 512 | 61290 | 1.197e+02 | 0.016494 | 40 | 930 | 1.559e+02 |
| hsa_amd_signal_async_handler | HSA_API | 24 | 52641 | 2.193e+03 | 0.014166 | 1180 | 4020 | 9.252e+02 |
| hsa_executable_iterate_symbols | HSA_API | 14 | 52521 | 3.752e+03 | 0.014134 | 2740 | 6940 | 1.105e+03 |
| hsa_amd_memory_copy_engine_status | HSA_API | 18 | 47370 | 2.632e+03 | 0.012748 | 260 | 7990 | 2.274e+03 |
| hsa_iterate_agents | HSA_API | 1 | 41391 | 4.139e+04 | 0.011139 | 41391 | 41391 | 0.000e+00 |
| hsa_executable_create_alt | HSA_API | 2 | 40470 | 2.024e+04 | 0.010891 | 7530 | 32940 | 1.797e+04 |
| hsa_isa_get_info_alt | HSA_API | 2 | 30391 | 1.520e+04 | 0.008179 | 2490 | 27901 | 1.797e+04 |
| hsa_signal_silent_store_relaxed | HSA_API | 48 | 24920 | 5.192e+02 | 0.006706 | 20 | 4570 | 7.120e+02 |
| hsa_amd_agent_iterate_memory_pools | HSA_API | 5 | 20221 | 4.044e+03 | 0.005442 | 2561 | 8600 | 2.574e+03 |
| hsa_queue_add_write_index_screlease | HSA_API | 56 | 7270 | 1.298e+02 | 0.001956 | 30 | 2310 | 3.471e+02 |
| hsa_amd_profiling_set_profiler_enabled | HSA_API | 4 | 5600 | 1.400e+03 | 0.001507 | 1370 | 1470 | 4.690e+01 |
| hsa_executable_symbol_get_info | HSA_API | 152 | 5470 | 3.599e+01 | 0.001472 | 30 | 340 | 3.563e+01 |
| hsa_queue_load_read_index_relaxed | HSA_API | 56 | 4560 | 8.143e+01 | 0.001227 | 20 | 1310 | 1.863e+02 |
| hsa_executable_get_symbol_by_name | HSA_API | 14 | 4500 | 3.214e+02 | 0.001211 | 110 | 1510 | 4.732e+02 |
| hsa_queue_load_read_index_scacquire | HSA_API | 56 | 3040 | 5.429e+01 | 0.000818 | 30 | 690 | 8.705e+01 |
| hsa_amd_memory_pool_get_info | HSA_API | 43 | 1770 | 4.116e+01 | 0.000476 | 30 | 270 | 3.640e+01 |
| hsa_system_get_info | HSA_API | 4 | 1750 | 4.375e+02 | 0.000471 | 40 | 830 | 3.544e+02 |
| hsa_amd_agent_memory_pool_get_info | HSA_API | 13 | 1140 | 8.769e+01 | 0.000307 | 30 | 640 | 1.664e+02 |
| hsa_agent_iterate_isas | HSA_API | 1 | 700 | 7.000e+02 | 0.000188 | 700 | 700 | 0.000e+00 |
| hsa_system_get_major_extension_table | HSA_API | 1 | 190 | 1.900e+02 | 0.000051 | 190 | 190 | 0.000e+00 |
ROCPROFV3 HIP_API SUMMARY:
| NAME | DOMAIN | CALLS | DURATION (nsec) | AVERAGE (nsec) | PERCENT (INC) | MIN (nsec) | MAX (nsec) | STDDEV |
|------------------------------------------|--------------|-----------------|-----------------|-----------------|---------------|-----------------|-----------------|-----------------|
| hipStreamCreateWithFlags | HIP_API | 8 | 406507215 | 5.081e+07 | 71.307804 | 735979 | 233800881 | 7.889e+07 |
| hipGetDeviceCount | HIP_API | 1 | 76707894 | 7.671e+07 | 13.455780 | 76707894 | 76707894 | 0.000e+00 |
| hipMemcpyAsync | HIP_API | 24 | 56109444 | 2.338e+06 | 9.842485 | 11640 | 55299811 | 1.128e+07 |
| hipHostMalloc | HIP_API | 24 | 13007523 | 5.420e+05 | 2.281726 | 416631 | 866382 | 1.206e+05 |
| hipMallocAsync | HIP_API | 24 | 7304847 | 3.044e+05 | 1.281386 | 275397 | 353719 | 2.207e+04 |
| hipHostFree | HIP_API | 24 | 2786484 | 1.161e+05 | 0.488793 | 72242 | 221646 | 4.606e+04 |
| hipStreamDestroy | HIP_API | 8 | 2137924 | 2.672e+05 | 0.375026 | 221596 | 377469 | 5.489e+04 |
| hipLaunchKernel | HIP_API | 32 | 2080214 | 6.501e+04 | 0.364902 | 8850 | 1608721 | 2.819e+05 |
| hipFree | HIP_API | 24 | 1572948 | 6.554e+04 | 0.275920 | 2130 | 186994 | 4.815e+04 |
| hipStreamSynchronize | HIP_API | 24 | 1452706 | 6.053e+04 | 0.254828 | 20810 | 135803 | 3.469e+04 |
| __hipRegisterFunction | HIP_API | 4 | 294207 | 7.355e+04 | 0.051609 | 210 | 291807 | 1.455e+05 |
| hipDeviceSynchronize | HIP_API | 4 | 50663 | 1.267e+04 | 0.008887 | 510 | 23621 | 9.554e+03 |
| __hipRegisterFatBinary | HIP_API | 1 | 43811 | 4.381e+04 | 0.007685 | 43811 | 43811 | 0.000e+00 |
| __hipPushCallConfiguration | HIP_API | 32 | 6250 | 1.953e+02 | 0.001096 | 60 | 3640 | 6.308e+02 |
| __hipPopCallConfiguration | HIP_API | 32 | 4780 | 1.494e+02 | 0.000838 | 60 | 2520 | 4.340e+02 |
| hipGetLastError | HIP_API | 32 | 4471 | 1.397e+02 | 0.000784 | 60 | 2381 | 4.092e+02 |
| hipSetDevice | HIP_API | 1 | 2570 | 2.570e+03 | 0.000451 | 2570 | 2570 | 0.000e+00 |
ROCPROFV3 KERNEL_DISPATCH SUMMARY:
| NAME | DOMAIN | CALLS | DURATION (nsec) | AVERAGE (nsec) | PERCENT (INC) | MIN (nsec) | MAX (nsec) | STDDEV |
|---------------------------------------------------------------------------|-----------------|-----------------|-----------------|-----------------|---------------|-----------------|-----------------|-----------------|
| void addition_kernel<float>(float*, float const*, float const*, int, int) | KERNEL_DISPATCH | 8 | 184324 | 2.304e+04 | 40.681542 | 11200 | 98802 | 3.062e+04 |
| divide_kernel(float*, float const*, float const*, int, int) | KERNEL_DISPATCH | 8 | 94482 | 1.181e+04 | 20.852811 | 10240 | 13520 | 1.061e+03 |
| multiply_kernel(float*, float const*, float const*, int, int) | KERNEL_DISPATCH | 8 | 91763 | 1.147e+04 | 20.252709 | 9800 | 12800 | 9.417e+02 |
| subtract_kernel(float*, float const*, float const*, int, int) | KERNEL_DISPATCH | 8 | 82521 | 1.032e+04 | 18.212938 | 8320 | 12920 | 1.436e+03 |
ROCPROFV3 MEMORY_COPY SUMMARY:
| NAME | DOMAIN | CALLS | DURATION (nsec) | AVERAGE (nsec) | PERCENT (INC) | MIN (nsec) | MAX (nsec) | STDDEV |
|------------------------------------------|--------------|-----------------|-----------------|-----------------|---------------|-----------------|-----------------|-----------------|
| MEMORY_COPY_HOST_TO_DEVICE | MEMORY_COPY | 16 | 3691929 | 2.307e+05 | 85.494053 | 74842 | 284487 | 6.265e+04 |
| MEMORY_COPY_DEVICE_TO_HOST | MEMORY_COPY | 8 | 626417 | 7.830e+04 | 14.505947 | 74842 | 98603 | 8.207e+03 |
ROCPROFV3 MEMORY_ALLOCATION SUMMARY:
| NAME | DOMAIN | CALLS | DURATION (nsec) | AVERAGE (nsec) | PERCENT (INC) | MIN (nsec) | MAX (nsec) | STDDEV |
|------------------------------------------|-------------------|-----------------|-----------------|-----------------|---------------|-----------------|-----------------|-----------------|
| MEMORY_ALLOCATION_ALLOCATE | MEMORY_ALLOCATION | 67 | 26314096 | 3.927e+05 | 83.661617 | 950 | 856812 | 1.785e+05 |
| MEMORY_ALLOCATION_FREE | MEMORY_ALLOCATION | 72 | 5138913 | 7.137e+04 | 16.338383 | 20 | 166234 | 3.882e+04 |
ROCPROFV3 SUMMARY:
| NAME | DOMAIN | CALLS | DURATION (nsec) | AVERAGE (nsec) | PERCENT (INC) | MIN (nsec) | MAX (nsec) | STDDEV |
|---------------------------------------------------------------------------|-------------------|-----------------|-----------------|-----------------|---------------|-----------------|-----------------|-----------------|
| hipStreamCreateWithFlags | HIP_API | 8 | 406507215 | 5.081e+07 | 41.569873 | 735979 | 233800881 | 7.889e+07 |
| hsa_queue_create | HSA_API | 4 | 280077621 | 7.002e+07 | 28.641044 | 55026812 | 113288760 | 2.885e+07 |
| hipGetDeviceCount | HIP_API | 1 | 76707894 | 7.671e+07 | 7.844233 | 76707894 | 76707894 | 0.000e+00 |
| hipMemcpyAsync | HIP_API | 24 | 56109444 | 2.338e+06 | 5.737813 | 11640 | 55299811 | 1.128e+07 |
| hsa_amd_memory_async_copy_on_engine | HSA_API | 24 | 55617052 | 2.317e+06 | 5.687461 | 7580 | 55195188 | 1.126e+07 |
| hsa_amd_memory_pool_allocate | HSA_API | 67 | 26428438 | 3.945e+05 | 2.702601 | 1510 | 857592 | 1.782e+05 |
| MEMORY_ALLOCATION_ALLOCATE | MEMORY_ALLOCATION | 67 | 26314096 | 3.927e+05 | 2.690908 | 950 | 856812 | 1.785e+05 |
| hipHostMalloc | HIP_API | 24 | 13007523 | 5.420e+05 | 1.330164 | 416631 | 866382 | 1.206e+05 |
| hipMallocAsync | HIP_API | 24 | 7304847 | 3.044e+05 | 0.747002 | 275397 | 353719 | 2.207e+04 |
| hsa_amd_memory_pool_free | HSA_API | 72 | 5176173 | 7.189e+04 | 0.529321 | 290 | 170374 | 3.903e+04 |
| MEMORY_ALLOCATION_FREE | MEMORY_ALLOCATION | 72 | 5138913 | 7.137e+04 | 0.525511 | 20 | 166234 | 3.882e+04 |
| MEMORY_COPY_HOST_TO_DEVICE | MEMORY_COPY | 16 | 3691929 | 2.307e+05 | 0.377541 | 74842 | 284487 | 6.265e+04 |
| hipHostFree | HIP_API | 24 | 2786484 | 1.161e+05 | 0.284949 | 72242 | 221646 | 4.606e+04 |
| hipStreamDestroy | HIP_API | 8 | 2137924 | 2.672e+05 | 0.218626 | 221596 | 377469 | 5.489e+04 |
| hipLaunchKernel | HIP_API | 32 | 2080214 | 6.501e+04 | 0.212725 | 8850 | 1608721 | 2.819e+05 |
| hipFree | HIP_API | 24 | 1572948 | 6.554e+04 | 0.160851 | 2130 | 186994 | 4.815e+04 |
| hipStreamSynchronize | HIP_API | 24 | 1452706 | 6.053e+04 | 0.148555 | 20810 | 135803 | 3.469e+04 |
| hsa_executable_freeze | HSA_API | 2 | 964125 | 4.821e+05 | 0.098592 | 437471 | 526654 | 6.306e+04 |
| hsa_signal_wait_scacquire | HSA_API | 26 | 853122 | 3.281e+04 | 0.087241 | 2530 | 100782 | 3.394e+04 |
| MEMORY_COPY_DEVICE_TO_HOST | MEMORY_COPY | 8 | 626417 | 7.830e+04 | 0.064058 | 74842 | 98603 | 8.207e+03 |
| hsa_executable_load_agent_code_object | HSA_API | 2 | 616175 | 3.081e+05 | 0.063011 | 254476 | 361699 | 7.582e+04 |
| hsa_amd_agents_allow_access | HSA_API | 35 | 430680 | 1.231e+04 | 0.044042 | 4830 | 55182 | 9.939e+03 |
| hsa_signal_store_screlease | HSA_API | 56 | 381491 | 6.812e+03 | 0.039012 | 1560 | 41831 | 7.895e+03 |
| __hipRegisterFunction | HIP_API | 4 | 294207 | 7.355e+04 | 0.030086 | 210 | 291807 | 1.455e+05 |
| void addition_kernel<float>(float*, float const*, float const*, int, int) | KERNEL_DISPATCH | 8 | 184324 | 2.304e+04 | 0.018849 | 11200 | 98802 | 3.062e+04 |
| hsa_signal_create | HSA_API | 107 | 160889 | 1.504e+03 | 0.016453 | 80 | 5650 | 1.475e+03 |
| hsa_code_object_reader_create_from_memory | HSA_API | 2 | 151314 | 7.566e+04 | 0.015474 | 32121 | 119193 | 6.157e+04 |
| hsa_signal_load_relaxed | HSA_API | 1296 | 137626 | 1.062e+02 | 0.014074 | 20 | 2930 | 2.712e+02 |
| hsa_signal_destroy | HSA_API | 618 | 111224 | 1.800e+02 | 0.011374 | 40 | 1540 | 2.429e+02 |
| divide_kernel(float*, float const*, float const*, int, int) | KERNEL_DISPATCH | 8 | 94482 | 1.181e+04 | 0.009662 | 10240 | 13520 | 1.061e+03 |
| multiply_kernel(float*, float const*, float const*, int, int) | KERNEL_DISPATCH | 8 | 91763 | 1.147e+04 | 0.009384 | 9800 | 12800 | 9.417e+02 |
| subtract_kernel(float*, float const*, float const*, int, int) | KERNEL_DISPATCH | 8 | 82521 | 1.032e+04 | 0.008439 | 8320 | 12920 | 1.436e+03 |
| hsa_agent_get_info | HSA_API | 65 | 77472 | 1.192e+03 | 0.007922 | 30 | 47121 | 6.341e+03 |
| hsa_amd_signal_create | HSA_API | 512 | 61290 | 1.197e+02 | 0.006268 | 40 | 930 | 1.559e+02 |
| hsa_amd_signal_async_handler | HSA_API | 24 | 52641 | 2.193e+03 | 0.005383 | 1180 | 4020 | 9.252e+02 |
| hsa_executable_iterate_symbols | HSA_API | 14 | 52521 | 3.752e+03 | 0.005371 | 2740 | 6940 | 1.105e+03 |
| hipDeviceSynchronize | HIP_API | 4 | 50663 | 1.267e+04 | 0.005181 | 510 | 23621 | 9.554e+03 |
| hsa_amd_memory_copy_engine_status | HSA_API | 18 | 47370 | 2.632e+03 | 0.004844 | 260 | 7990 | 2.274e+03 |
| __hipRegisterFatBinary | HIP_API | 1 | 43811 | 4.381e+04 | 0.004480 | 43811 | 43811 | 0.000e+00 |
| hsa_iterate_agents | HSA_API | 1 | 41391 | 4.139e+04 | 0.004233 | 41391 | 41391 | 0.000e+00 |
| hsa_executable_create_alt | HSA_API | 2 | 40470 | 2.024e+04 | 0.004139 | 7530 | 32940 | 1.797e+04 |
| hsa_isa_get_info_alt | HSA_API | 2 | 30391 | 1.520e+04 | 0.003108 | 2490 | 27901 | 1.797e+04 |
| hsa_signal_silent_store_relaxed | HSA_API | 48 | 24920 | 5.192e+02 | 0.002548 | 20 | 4570 | 7.120e+02 |
| hsa_amd_agent_iterate_memory_pools | HSA_API | 5 | 20221 | 4.044e+03 | 0.002068 | 2561 | 8600 | 2.574e+03 |
| hsa_queue_add_write_index_screlease | HSA_API | 56 | 7270 | 1.298e+02 | 0.000743 | 30 | 2310 | 3.471e+02 |
| __hipPushCallConfiguration | HIP_API | 32 | 6250 | 1.953e+02 | 0.000639 | 60 | 3640 | 6.308e+02 |
| hsa_amd_profiling_set_profiler_enabled | HSA_API | 4 | 5600 | 1.400e+03 | 0.000573 | 1370 | 1470 | 4.690e+01 |
| hsa_executable_symbol_get_info | HSA_API | 152 | 5470 | 3.599e+01 | 0.000559 | 30 | 340 | 3.563e+01 |
| __hipPopCallConfiguration | HIP_API | 32 | 4780 | 1.494e+02 | 0.000489 | 60 | 2520 | 4.340e+02 |
| hsa_queue_load_read_index_relaxed | HSA_API | 56 | 4560 | 8.143e+01 | 0.000466 | 20 | 1310 | 1.863e+02 |
| hsa_executable_get_symbol_by_name | HSA_API | 14 | 4500 | 3.214e+02 | 0.000460 | 110 | 1510 | 4.732e+02 |
| hipGetLastError | HIP_API | 32 | 4471 | 1.397e+02 | 0.000457 | 60 | 2381 | 4.092e+02 |
| hsa_queue_load_read_index_scacquire | HSA_API | 56 | 3040 | 5.429e+01 | 0.000311 | 30 | 690 | 8.705e+01 |
| hipSetDevice | HIP_API | 1 | 2570 | 2.570e+03 | 0.000263 | 2570 | 2570 | 0.000e+00 |
| hsa_amd_memory_pool_get_info | HSA_API | 43 | 1770 | 4.116e+01 | 0.000181 | 30 | 270 | 3.640e+01 |
| hsa_system_get_info | HSA_API | 4 | 1750 | 4.375e+02 | 0.000179 | 40 | 830 | 3.544e+02 |
| hsa_amd_agent_memory_pool_get_info | HSA_API | 13 | 1140 | 8.769e+01 | 0.000117 | 30 | 640 | 1.664e+02 |
| hsa_agent_iterate_isas | HSA_API | 1 | 700 | 7.000e+02 | 0.000072 | 700 | 700 | 0.000e+00 |
| hsa_system_get_major_extension_table | HSA_API | 1 | 190 | 1.900e+02 | 0.000019 | 190 | 190 | 0.000e+00 |
Collecting traces using input file#
The preceding sections describe how to collect traces by specifying the desired tracing type on the command line. You can also specify the desired tracing types in an input file in YAML (.yaml/.yml), or JSON (.json) format. You can supply any command-line option for tracing in the input file.
Here is a sample input.yaml file for collecting tracing summary:
jobs:
  - output_directory: "@CMAKE_CURRENT_BINARY_DIR@/%env{ARBITRARY_ENV_VARIABLE}%"
    output_file: out
    output_format: [pftrace, json, otf2]
    log_level: env
    runtime_trace: true
    kernel_rename: true
    summary: true
    summary_per_domain: true
    summary_groups: ["KERNEL_DISPATCH|MEMORY_COPY"]
    summary_output_file: "summary"
Here is a sample input.json file for collecting tracing summary:
{
  "jobs": [
    {
      "output_directory": "out-directory",
      "output_file": "out",
      "output_format": ["pftrace", "json", "otf2"],
      "log_level": "env",
      "runtime_trace": true,
      "kernel_rename": true,
      "summary": true,
      "summary_per_domain": true,
      "summary_groups": ["KERNEL_DISPATCH|MEMORY_COPY"],
      "summary_output_file": "summary"
    }
  ]
}
Here is the input schema (properties) of JSON or YAML input files:
jobs (array):
rocprofv3input data per application run.Items (object): Data for
rocprofv3hip_trace (boolean)
hip_runtime_trace (boolean)
hip_compiler_trace (boolean)
marker_trace (boolean)
kernel_trace (boolean)
memory_copy_trace (boolean)
memory_allocation_trace (boolean)
scratch_memory_trace (boolean)
stats (boolean)
hsa_trace (boolean)
hsa_core_trace (boolean)
hsa_amd_trace (boolean)
hsa_finalize_trace (boolean)
hsa_image_trace (boolean)
sys_trace (boolean)
minimum-output-data (integer)
disable-signal-handlers (boolean)
mangled_kernels (boolean)
truncate_kernels (boolean)
output_file (string)
output_directory (string)
output_format (array)
log_level (string)
preload (array)
For description of the options specified under job items, see Command-line options.
To supply the input file for collecting traces, use:
rocprofv3 -i input.yaml -- <application_path>
Please note that input file format must be a valid YAML or JSON file.
Disabling specific tracing options#
When using aggregate tracing options like --runtime-trace or --sys-trace, you can disable specific tracing options by setting them to False. This allows fine-grained control over the traces to be collected.
rocprofv3 --runtime-trace --scratch-memory-trace=False -- <application_path>
The preceding command enables all traces included in --runtime-trace except for scratch memory tracing.
Similarly, for --sys-trace:
rocprofv3 --sys-trace --hsa-trace=False -- <application_path>
The preceding command enables all traces included in --sys-trace except for HSA API tracing.
To disable multiple specific tracing options, use:
rocprofv3 --sys-trace --hsa-trace=False --scratch-memory-trace=False -- <application_path>
This feature is particularly useful to collect most traces excluding specific ones that might be unnecessary for your analysis or that generate excessive data.
Kernel counter collection#
The application tracing functionality allows you to evaluate the duration of kernel execution but is of little help in providing insight into kernel execution details. The kernel counter collection functionality allows you to select kernels for profiling and choose the basic counters or derived metrics to be collected for each kernel execution, thus providing a greater insight into kernel execution.
AMDGPUs are equipped with hardware performance counters that can be used to measure specific values during kernel execution, which are then exported from the GPU and written into the output files at the end of the kernel execution. These performance counters vary according to the GPU. Therefore, it is recommended to examine the hardware counters that can be collected before running the profile.
There are two types of data available for profiling: hardware basic counters and derived metrics.
The derived metrics are the counters derived from the basic counters using mathematical expressions. Note that the basic counters and derived metrics are collectively referred as counters in this document.
To see the counters available on the GPU, use:
rocprofv3 --list-avail
You can also customize the counters according to the requirement. Such counters are named Extra counters.
For a comprehensive list of counters available on MI200, see MI200 performance counters and metrics.
Counter collection using input file#
Input files can be in text (.txt), YAML (.yaml/.yml), or JSON (.json) format to specify the the desired counters for collection.
When using input file in text format, the line consisting of the counter names must begin with pmc. The number of counters that can be collected in one profiling run are limited by the GPU hardware resources. If too many counters are selected, the kernels need to be executed multiple times(multi-pass execution) to collect all the counters. For multi-pass execution, include multiple pmc rows in the input file. Counters in each pmc row can be collected in each application run.
Here is a sample input.txt file for specifying counters for collection:
$ cat input.txt

pmc: GPUBusy SQ_WAVES
pmc: GRBM_GUI_ACTIVE
While the input file in text format can only be used for counter collection, JSON and YAML formats support all the command-line options for profiling. The input file in YAML or JSON format has an array of profiling configurations called jobs. Each job is used to configure profiling for an application execution.
Here is the input schema (properties) of JSON or YAML input files:
jobs (array):
rocprofv3input data per application runItems (object): Data for
rocprofv3pmc (array): list of counters for collection
kernel_include_regex (string)
kernel_exclude_regex (string)
kernel_iteration_range (string)
mangled_kernels (boolean)
truncate_kernels (boolean)
output_file (string)
output_directory (string)
output_format (array)
list_avail (boolean)
log_level (string)
preload (array)
minimum-output-data (integer)
disable-signal-handlers (boolean)
pc_sampling_unit (string)
pc_sampling_method (string)
pc_sampling_interval (integer)
pc_sampling_beta_enabled (boolean)
For description of the options specified under job items, see Command-line options.
Here is a sample input.json file for specifying counters for collection along with the options to filter and control the output:
$ cat input.json

{
  "jobs": [
     {
        "pmc": ["SQ_WAVES", "GRBM_COUNT", "GRBM_GUI_ACTIVE"]
     },
     {
        "pmc": ["FETCH_SIZE", "WRITE_SIZE"],
        "kernel_include_regex": ".*_kernel",
        "kernel_exclude_regex": "multiply",
        "kernel_iteration_range": "[1-2],[3-4]",
        "output_file": "out",
        "output_format": [
           "csv",
           "json"
        ],
        "truncate_kernels": true
     }
  ]
}
Here is a sample input.yaml file for counter collection:
jobs:
  - pmc: ["SQ_WAVES", "GRBM_COUNT", "GRBM_GUI_ACTIVE"]
  - pmc: ["FETCH_SIZE", "WRITE_SIZE"]
    kernel_include_regex: ".*_kernel"
    kernel_exclude_regex: "multiply"
    kernel_iteration_range: "[1-2],[3-4]"
    output_file: "out"
    output_format:
      - "csv"
      - "json"
    truncate_kernels: true
To supply the input file for kernel counter collection, use:
rocprofv3 -i input.yaml -- <application_path>
Counter collection using command line#
You can also collect the desired counters by directly specifying them in the command line instead of using an input file.
To supply the counters in the command line, use:
rocprofv3 --pmc SQ_WAVES GRBM_COUNT GRBM_GUI_ACTIVE -- <application_path>
Note
When specifying more than one counter, separate them using space or a comma.
Job fails if the entire set of counters can’t be collected in a single pass.
Extra counters#
While the basic counters and derived metrics are available for collection by default, you can also define counters as per requirement. These user-defined counters with custom definitions are named extra counters.
You can define the extra counters in a YAML file as shown:
rocprofiler-sdk:
  counters-schema-version: 1
  counters:
    - name: GRBM_GUI_ACTIVE_SUM
      description: "Unit: cycles"
      properties: []
      definitions:
        - architectures:
            - gfx10
            - gfx1010
            - gfx1030
            - gfx1031
            - gfx1032
            - gfx11
            - gfx1100
            - gfx1101
            - gfx1102
            - gfx9
            - gfx906
            - gfx908
            - gfx90a
            - gfx942
          expression: reduce(GRBM_GUI_ACTIVE,max)*CU_NUM
    - name: CPC_CPC_STAT_BUSY
      description: CPC Busy.
      properties: []
      definitions:
        - architectures:
            - gfx940
            - gfx941
          block: CPC
          event: 25
Please note, the above sample uses the CPC_CPC_STAT_BUSY counter definition for the gfx940
and gfx941 architectures to demonstrate the YAML schema when counters have different
architecture-specific definitions.
If this YAML is placed in a extra_counters.yaml file, to collect the extra counters defined
in the extra_counters.yaml file, use the -E / --extra-counters option:
rocprofv3 -E <path-to-extra_counters.yaml> --pmc GRBM_GUI_ACTIVE_SUM --output-format csv -- <application_path>
Where the option --pmc is used to specify the extra counters to be collected.
Kernel counter collection output#
Using rocprofv3 for counter collection using input file or command line generates a ./pmc_n/counter_collection.csv file prefixed with the process ID. For each pmc row, a directory pmc_n containing a counter_collection.csv file is generated, where n = 1 for the first row and so on.
When using input file in JSON or YAML format, for each job, a directory pass_n containing a counter_collection.csv file is generated, where n = 1 for the first job and so on.
Each row of the CSV file is an instance of kernel execution. Here is a truncated version of the output file from pmc_1:
$ cat pmc_1/218_counter_collection.csv
Here are the contents of counter_collection.csv file:
Correlation_Id |
Dispatch_Id |
Agent_Id |
Queue_Id |
Process_Id |
Thread_Id |
Grid_Size |
Kernel_Id |
Kernel_Name |
Workgroup_Size |
LDS_Block_Size |
Scratch_Size |
VGPR_Count |
Accum_VGPR_Count |
SGPR_Count |
Counter_Name |
Counter_Value |
Start_Timestamp |
End_Timestamp |
|---|---|---|---|---|---|---|---|---|---|---|---|---|---|---|---|---|---|---|
1 |
1 |
Agent 1 |
1 |
15606 |
15606 |
1048576 |
17 |
void addition_kernel<float>(float*, float const*, float const*, int, int) |
64 |
0 |
0 |
8 |
0 |
16 |
SQ_WAVES |
16384.000000 |
3200098838431081 |
3200098838483232 |
2 |
2 |
Agent 1 |
1 |
15606 |
15606 |
1048576 |
20 |
subtract_kernel(float*, float const*, float const*, int, int) |
64 |
0 |
0 |
8 |
0 |
16 |
SQ_WAVES |
16384.000000 |
3200098838589014 |
3200098838638794 |
3 |
3 |
Agent 1 |
1 |
15606 |
15606 |
1048576 |
19 |
multiply_kernel(float*, float const*, float const*, int, int) |
64 |
0 |
0 |
8 |
0 |
16 |
SQ_WAVES |
16384.000000 |
3200098838746207 |
3200098838793025 |
4 |
4 |
Agent 1 |
1 |
15606 |
15606 |
1048576 |
18 |
divide_kernel(float*, float const*, float const*, int, int) |
64 |
0 |
0 |
12 |
0 |
16 |
SQ_WAVES |
16384.000000 |
3200098838879399 |
3200098838927550 |
For the description of the fields in the output file, see Output file fields.
Iteration based counter multiplexing#
Counter multiplexing allows a single run of the program to collect groups of counters. This is useful when the counters you want to collect exceed the hardware limits and you cannot run the program multiple times for collection.
This feature is available when using YAML (.yaml/.yml) or JSON (.json) input formats. Two new fields are introduced, pmc_groups and pmc_group_interval. The pmc_groups field is used to specify the groups of counters to be collected in each run. The pmc_group_interval field is used to specify the interval between each group of counters. Interval is per-device and increments per dispatch on the device (i.e. dispatch_id). When the interval is reached the next group is selected.
Here is a sample input.yaml file for specifying counter multiplexing:
jobs:
- pmc_groups: [["SQ_WAVES", "GRBM_COUNT"], ["GRBM_GUI_ACTIVE"]]
   pmc_group_interval: 4
This sample input will collect the first group of counters (SQ_WAVES, GRBM_COUNT) for the first 4 kernel executions on the device, then the second group of counters (GRBM_GUI_ACTIVE) for the next 4 kernel executions on the device, and so on.
An example of the interval period for this input is given below:
Device 1, <Kernel A>, Collect SQ_WAVES, GRBM_COUNT
Device 1, <Kernel A>, Collect SQ_WAVES, GRBM_COUNT
Device 1, <Kernel B>, Collect SQ_WAVES, GRBM_COUNT
Device 1, <Kernel C>, Collect SQ_WAVES, GRBM_COUNT
<Interval reached on Device 1, Swtiching Counters>
Device 1, <Kernel D>, Collect GRBM_GUI_ACTIVE
Here is the same sample in JSON format:
{
   "jobs": [
      {
            "pmc_groups": [["SQ_WAVES", "GRBM_COUNT"], ["GRBM_GUI_ACTIVE"]],
            "pmc_group_interval": 4
      }
   ]
}
Perfetto visualization#
Perfetto is an open-source tracing tool that provides a detailed view of system performance. You can use Perfetto to visualize traces and performance counter data as explained in the following sections.
Perfetto visualization for traces#
Perfetto helps you to visualize the collected traces in Perfetto viewer, which is a user-friendly interface that makes it easier to analyze and understand the performance characteristics of your application.
To generate a Perfetto trace file, use the --output-format pftrace option along with the desired tracing options. For example, to collect system traces and generate a Perfetto trace file, use:
rocprofv3 --sys-trace --output-format pftrace -- <application_path>
The generated Perfetto trace file can be opened in the Perfetto UI.
Figure 1: Generic perfetto visualization
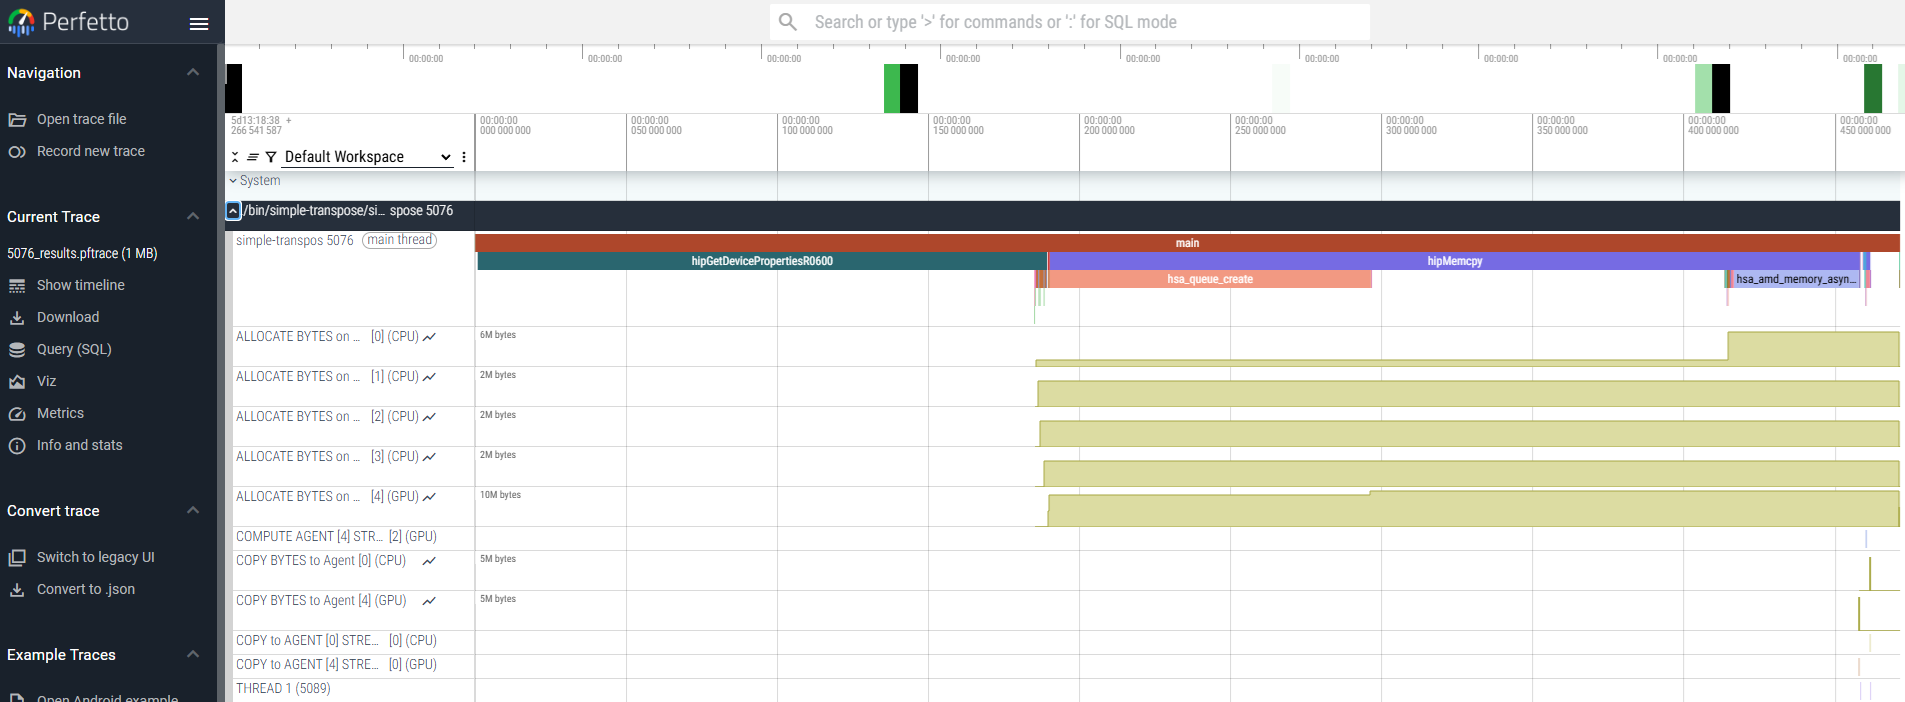
Figure 2: Visualization of ROCm flow data in Perfetto

Perfetto visualization for counter collection#
When collecting performance counter data, you can visualize the counter tracks per agent in the Perfetto viewer by using the PFTrace output format. This helps you see how counter values change over time during kernel execution.
To generate a Perfetto trace file with counter data, use:
rocprofv3 --pmc SQ_WAVES GRBM_COUNT --output-format pftrace -- <application_path>
The generated Perfetto trace file can be opened in the Perfetto UI. In the viewer, performance counters will appear as counter tracks organized by agent, allowing you to visualize counter values changing over time alongside kernel executions and other traced activities.
You can also combine this with the system trace option to get a more comprehensive view of the system’s performance. For example, you can use the following command to collect both system trace and performance counter data:
rocprofv3 --pmc SQ_WAVES GRBM_COUNT --sys-trace --output-format pftrace -- <application_path>
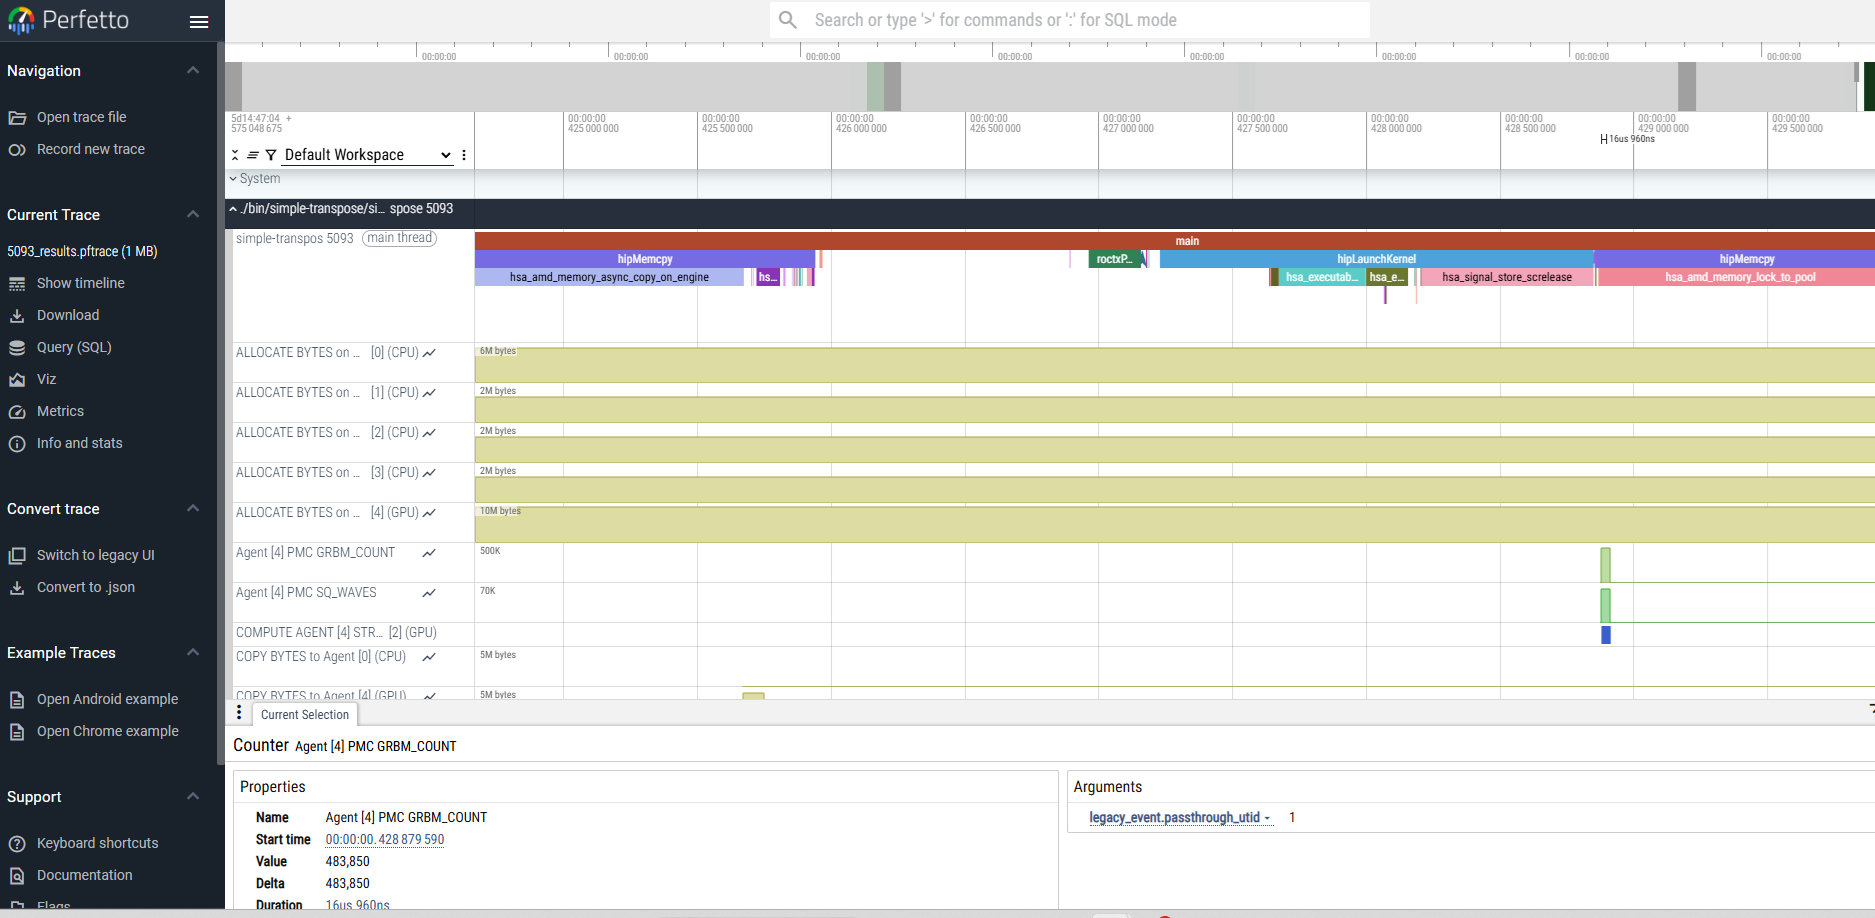
Scratch Memory Visualization in Perfetto#
When using the --scratch-memory-trace option with Perfetto output format, ROCProfiler SDK creates visualization tracks for scratch memory usage. Scratch memory operations are displayed as counter tracks organized by agent (GPU), allowing you to monitor the scratch memory allocation patterns during kernel execution.
To generate a Perfetto trace file that includes scratch memory visualization:
rocprofv3 --scratch-memory-trace --output-format pftrace -- <application_path>
In the Perfetto UI, scratch memory appears as counter tracks that show:
Allocation peaks: Each peak represents scratch memory allocation for a kernel execution
Memory usage over time: The height of each peak indicates the amount of memory allocated (typically in KB)
Allocation/deallocation pattern: You can observe when memory is allocated at kernel start and freed at kernel end
For applications with multiple kernel iterations, you’ll see multiple peaks in the scratch memory track, with each peak corresponding to a kernel execution. This visualization helps identify scratch memory usage patterns and potential optimization opportunities.
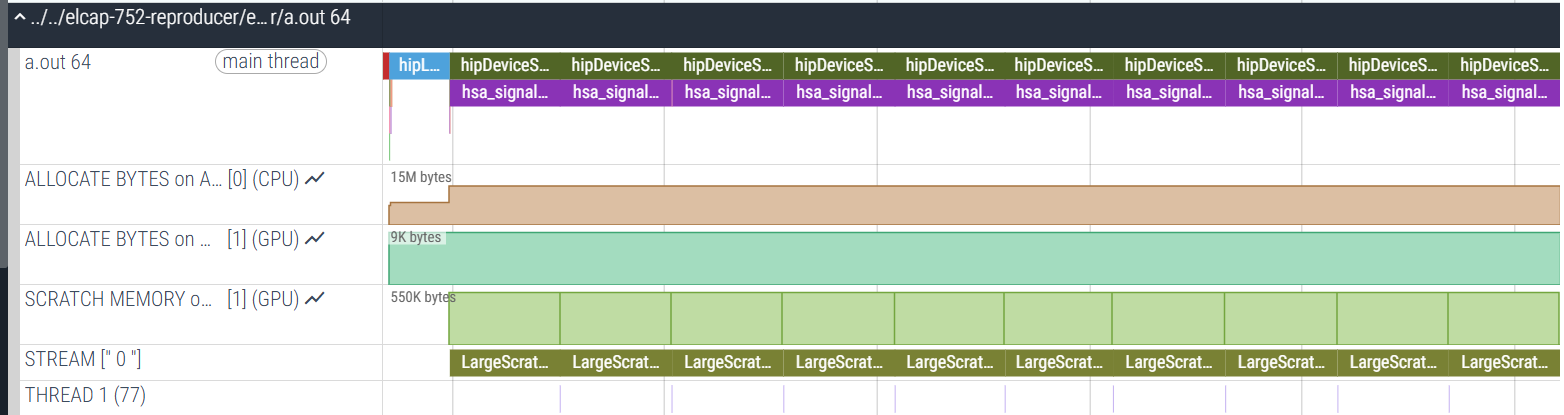
For comprehensive GPU execution insights, combine scratch memory tracing with kernel tracing:
rocprofv3 --kernel-trace --scratch-memory-trace --output-format pftrace -- <application_path>
This allows you to correlate scratch memory allocation patterns with specific kernel executions in the Perfetto visualization.
Agent info#
Note
All tracing and counter collection options generate an additional agent_info.csv file prefixed with the process ID.
The agent_info.csv file contains information about the CPU or GPU the kernel runs on.
$ cat 238_agent_info.csv

"Node_Id","Logical_Node_Id","Agent_Type","Cpu_Cores_Count","Simd_Count","Cpu_Core_Id_Base","Simd_Id_Base","Max_Waves_Per_Simd","Lds_Size_In_Kb","Gds_Size_In_Kb","Num_Gws","Wave_Front_Size","Num_Xcc","Cu_Count","Array_Count","Num_Shader_Banks","Simd_Arrays_Per_Engine","Cu_Per_Simd_Array","Simd_Per_Cu","Max_Slots_Scratch_Cu","Gfx_Target_Version","Vendor_Id","Device_Id","Location_Id","Domain","Drm_Render_Minor","Num_Sdma_Engines","Num_Sdma_Xgmi_Engines","Num_Sdma_Queues_Per_Engine","Num_Cp_Queues","Max_Engine_Clk_Ccompute","Max_Engine_Clk_Fcompute","Sdma_Fw_Version","Fw_Version","Capability","Cu_Per_Engine","Max_Waves_Per_Cu","Family_Id","Workgroup_Max_Size","Grid_Max_Size","Local_Mem_Size","Hive_Id","Gpu_Id","Workgroup_Max_Dim_X","Workgroup_Max_Dim_Y","Workgroup_Max_Dim_Z","Grid_Max_Dim_X","Grid_Max_Dim_Y","Grid_Max_Dim_Z","Name","Vendor_Name","Product_Name","Model_Name"
0,0,"CPU",24,0,0,0,0,0,0,0,0,1,24,0,0,0,0,0,0,0,0,0,0,0,0,0,0,0,0,3800,0,0,0,0,0,0,23,0,0,0,0,0,0,0,0,0,0,0,"AMD Ryzen 9 3900X 12-Core Processor","CPU","AMD Ryzen 9 3900X 12-Core Processor",""
1,1,"GPU",0,256,0,2147487744,10,64,0,64,64,1,64,4,4,1,16,4,32,90000,4098,26751,12032,0,128,2,0,2,24,3800,1630,432,440,138420864,16,40,141,1024,4294967295,0,0,64700,1024,1024,1024,4294967295,4294967295,4294967295,"gfx900","AMD","Radeon RX Vega","vega10"
Advanced options#
rocprofv3 provides the following miscellaneous functionalities for improved control and flexibility.
Agent index#
The agent index is a unique identifier for each agent in the system. It is used to identify the agent in the output files. Since, each runtime or tool has an independent representation of the agent’s indices, rocprofv3 provides an option to configure the agent index in the output files.
absolute == node_id - Absolute index of the agent, regardless of cgroups masking. This is a monotonically increasing number, which is incremented for every folder in
/sys/class/kfd/kfd/topology/nodes. For example, Agent-0, Agent-2, Agent-4.relative == logical_node_id - Relative index of the agent accounting for cgroups masking. This is a monotonically increasing number, which is incremented for every folder in
/sys/class/kfd/kfd/topology/nodes/, whose properties file is non-empty. For example, Agent-0, Agent-1, Agent-2.type-relative == logical_node_type_id - Relative index of the agent accounting for cgroups masking, where indexing starts at zero for each agent type. For example, CPU-0, GPU-0, GPU-1.
To set the agent index in the output files, use the --agent-index option. The default value is relative.
The following example shows how to set the agent index on a system with multiple GPUs and CPUs:
Here is the rocm-smi output:
============================================ ROCm System Management Interface ============================================
====================================================== Concise Info ======================================================
Device  Node  IDs              Temp        Power     Partitions          SCLK    MCLK     Fan  Perf  PwrCap  VRAM%  GPU%
        (DID,     GUID)  (Junction)  (Socket)  (Mem, Compute, ID)
==========================================================================================================================
0       4     0x74a0,   50375  48.0°C      110.0W    NPS1, SPX, 0        98Mhz   1300Mhz  0%   auto  550.0W  0%     0%
1       5     0x74a0,   20890  53.0°C      113.0W    NPS1, SPX, 0        99Mhz   1200Mhz  0%   auto  550.0W  0%     0%
2       6     0x74a0,   44670  52.0°C      125.0W    NPS1, SPX, 0        100Mhz  1300Mhz  0%   auto  550.0W  0%     0%
3       7     0x74a0,   15139  47.0°C      115.0W    NPS1, SPX, 0        100Mhz  1300Mhz  0%   auto  550.0W  0%     0%
==========================================================================================================================
================================================== End of ROCm SMI Log ===================================================
To set the agent index to relative, use:
rocprofv3 --kernel-trace --agent-index=relative --output-format csv -- <application_path>
Here is the generated ouput file with Agent_Id as “Agent 7”:
$ cat kernel_trace.csv

"Kind","Agent_Id","Queue_Id","Stream_Id","Thread_Id","Dispatch_Id","Kernel_Id","Kernel_Name","Correlation_Id","Start_Timestamp","End_Timestamp","LDS_Block_Size","Scratch_Size","VGPR_Count","Accum_VGPR_Count","SGPR_Count","Workgroup_Size_X","Workgroup_Size_Y","Workgroup_Size_Z","Grid_Size_X","Grid_Size_Y","Grid_Size_Z"
"KERNEL_DISPATCH","Agent 7",17,26,847809,101,49,"void addition_kernel<float>(float*, float const*, float const*, int, int)",101,1551401624448706,1551401624459226,0,0,8,0,16,64,1,1,1024,1024,1
To set the agent index to type-relative, use:
rocprofv3 --kernel-trace --agent-index=type-relative --output-format csv -- <application_path>
Here is the generated ouput file with Agent_Id as “GPU 3”:
$ cat kernel_trace.csv

"Kind","Agent_Id","Queue_Id","Stream_Id","Thread_Id","Dispatch_Id","Kernel_Id","Kernel_Name","Correlation_Id","Start_Timestamp","End_Timestamp","LDS_Block_Size","Scratch_Size","VGPR_Count","Accum_VGPR_Count","SGPR_Count","Workgroup_Size_X","Workgroup_Size_Y","Workgroup_Size_Z","Grid_Size_X","Grid_Size_Y","Grid_Size_Z"
"KERNEL_DISPATCH","GPU 3",19,29,846827,113,49,"void addition_kernel<float>(float*, float const*, float const*, int, int)",113,1551314943082302,1551314943092222,0,0,8,0,16,64,1,1,1024,1024,1
Group by queue#
By default, rocprofv3 shows the HIP streams to which the kernel and memory copy operations were submitted, when outputting a perfetto trace. Whereas, the --group-by-queue option displays the HSA queues to which these kernel and memory operations were submitted.
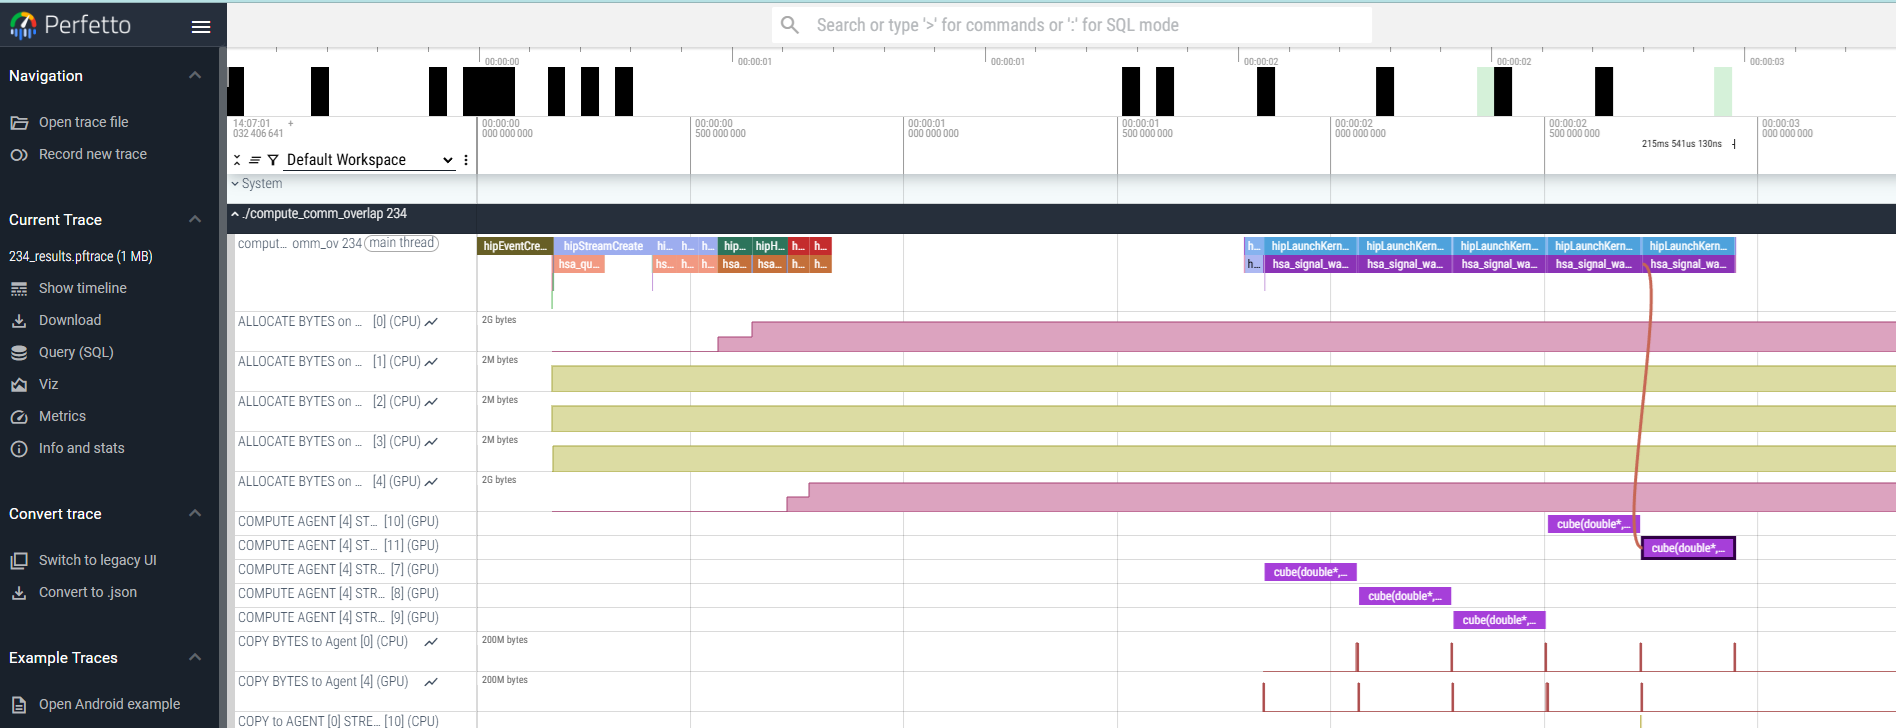
rocprofv3 -s --group-by-queue --output-format pftrace -- <application_path>
The preceding command generates a pftrace file with the kernel and memory copy operations grouped into HSA queues instead of HIP streams.
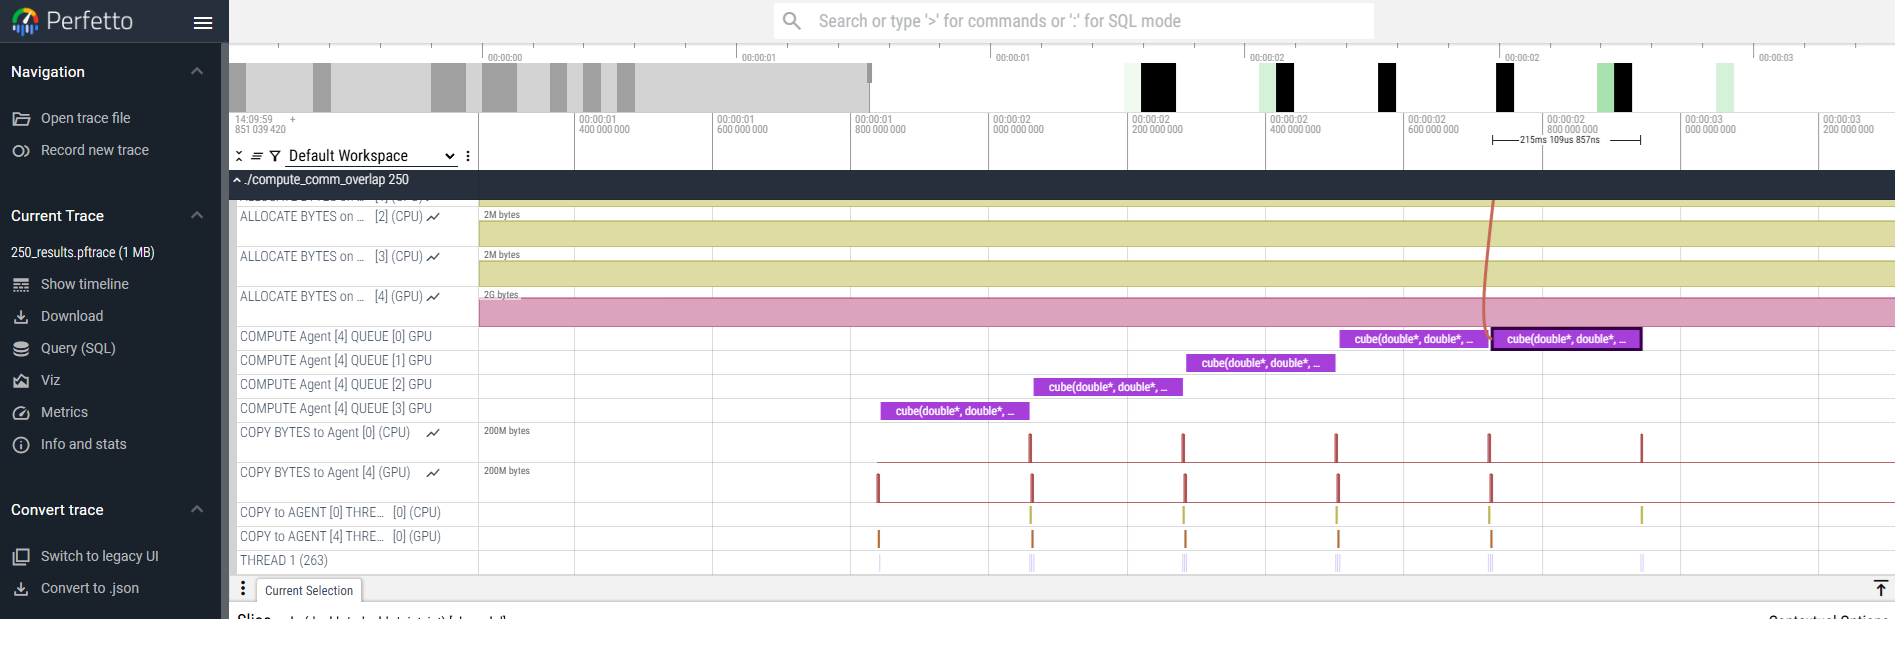
Kernel naming and filtering#
rocprofv3 provides the following functionalities to configure the kernel name in the output file or to filter the kernels based on requirement.
Kernel name mangling#
In rocprofv3 output, by default, the kernel names are demangled to exclude the kernel arguments. This improves readability of the collected output.
To see the mangled kernel names, disable this feature by using the --mangled-kernels option.
Here is an example of kernel trace by default:
$ cat 123_kernel_trace.csv

"Kind","Agent_Id","Queue_Id","Stream_Id","Thread_Id","Dispatch_Id","Kernel_Id","Kernel_Name","Correlation_Id","Start_Timestamp","End_Timestamp","LDS_Block_Size","Scratch_Size","VGPR_Count","Accum_VGPR_Count","SGPR_Count","Workgroup_Size_X","Workgroup_Size_Y","Workgroup_Size_Z","Grid_Size_X","Grid_Size_Y","Grid_Size_Z"
"KERNEL_DISPATCH","Agent 4",1,1,852831,1,10,"void addition_kernel<float>(float*, float const*, float const*, int, int)",1,1551874061244694,1551874061255734,0,0,8,0,16,64,1,1,1024,1024,1
"KERNEL_DISPATCH","Agent 4",1,1,852831,2,13,"subtract_kernel(float*, float const*, float const*, int, int)",2,1551874061259214,1551874061270254,0,0,8,0,16,64,1,1,1024,1024,1
"KERNEL_DISPATCH","Agent 4",1,1,852831,3,12,"multiply_kernel(float*, float const*, float const*, int, int)",3,1551874061270254,1551874061279974,0,0,8,0,16,64,1,1,1024,1024,1
"KERNEL_DISPATCH","Agent 4",2,2,852831,8,11,"divide_kernel(float*, float const*, float const*, int, int)",8,1551874061326294,1551874061335454,0,0,12,4,16,64,1,1,1024,1024,1
To disable kernel name demangling, use:
rocprofv3 --mangled-kernels --kernel-trace --output-format csv -- <application_path>
The preceding command generates the following kernel_trace.csv file with mangled kernel names:
$ cat 123_kernel_trace.csv

"Kind","Agent_Id","Queue_Id","Stream_Id","Thread_Id","Dispatch_Id","Kernel_Id","Kernel_Name","Correlation_Id","Start_Timestamp","End_Timestamp","LDS_Block_Size","Scratch_Size","VGPR_Count","Accum_VGPR_Count","SGPR_Count","Workgroup_Size_X","Workgroup_Size_Y","Workgroup_Size_Z","Grid_Size_X","Grid_Size_Y","Grid_Size_Z"
"KERNEL_DISPATCH","Agent 4",1,1,850334,1,10,"_Z15addition_kernelIfEvPT_PKfS3_ii.kd",1,1551636841670446,1551636841681606,0,0,8,0,16,64,1,1,1024,1024,1
"KERNEL_DISPATCH","Agent 4",1,1,850334,2,13,"_Z15subtract_kernelPfPKfS1_ii.kd",2,1551636841686726,1551636841697606,0,0,8,0,16,64,1,1,1024,1024,1
"KERNEL_DISPATCH","Agent 4",1,1,850334,3,12,"_Z15multiply_kernelPfPKfS1_ii.kd",3,1551636841701926,1551636841712806,0,0,8,0,16,64,1,1,1024,1024,1
"KERNEL_DISPATCH","Agent 4",2,2,850334,8,11,"_Z13divide_kernelPfPKfS1_ii.kd",8,1551636841762926,1551636841774646,0,0,12,4,16,64,1,1,1024,1024,1
Kernel name truncation#
The kernel name truncation feature allows you to limit the kernel name length in the output files. This is useful when dealing with long kernel names that can make the output files difficult to read.
To enable kernel name truncation, use the --truncate-kernels option:
rocprofv3 --truncate-kernels --kernel-trace --output-format csv -- <application_path>
The preceding command generates the following kernel_trace.csv file with truncated kernel names:
Kind |
Agent_Id |
Queue_Id |
Stream_Id |
Thread_Id |
Dispatch_Id |
Kernel_Id |
Kernel_Name |
Correlation_Id |
Start_Timestamp |
End_Timestamp |
LDS_Block_Size |
Scratch_Size |
VGPR_Count |
Accum_VGPR_Count |
SGPR_Count |
Workgroup_Size_X |
Workgroup_Size_Y |
Workgroup_Size_Z |
Grid_Size_X |
Grid_Size_Y |
Grid_Size_Z |
|---|---|---|---|---|---|---|---|---|---|---|---|---|---|---|---|---|---|---|---|---|---|
KERNEL_DISPATCH |
Agent 4 |
1 |
1 |
855217 |
1 |
10 |
addition_kernel |
1 |
1552082594648838 |
1552082594660478 |
0 |
0 |
8 |
0 |
16 |
64 |
1 |
1 |
1024 |
1024 |
1 |
KERNEL_DISPATCH |
Agent 4 |
1 |
1 |
855217 |
4 |
11 |
divide_kernel |
4 |
1552082594696598 |
1552082594709678 |
0 |
0 |
12 |
4 |
16 |
64 |
1 |
1 |
1024 |
1024 |
1 |
KERNEL_DISPATCH |
Agent 4 |
1 |
1 |
855217 |
3 |
12 |
multiply_kernel |
3 |
1552082594685158 |
1552082594696598 |
0 |
0 |
8 |
0 |
16 |
64 |
1 |
1 |
1024 |
1024 |
1 |
KERNEL_DISPATCH |
Agent 4 |
1 |
1 |
855217 |
2 |
13 |
subtract_kernel |
2 |
1552082594660478 |
1552082594669158 |
0 |
0 |
8 |
0 |
16 |
64 |
1 |
1 |
1024 |
1024 |
1 |
Kernel filtering#
Kernel filtering helps to include or exclude the kernels for profiling by specifying a filter using a regex string. You can also specify an iteration range for profiling the included kernels. If the iteration range is not provided, then all iterations of the included kernels are profiled.
Here is an input file with kernel filters:
$ cat input.yml
jobs:
    - pmc: [SQ_WAVES]
    kernel_include_regex: "divide"
    kernel_exclude_regex: ""
    kernel_iteration_range: "[1, 2, [5-8]]"
To collect counters for the kernels matching the filters specified in the preceding input file, run:
rocprofv3 -i input.yml --output-format csv -- <application_path>

$ cat pass_1/312_counter_collection.csv
"Correlation_Id","Dispatch_Id","Agent_Id","Queue_Id","Process_Id","Thread_Id","Grid_Size","Kernel_Id","Kernel_Name","Workgroup_Size","LDS_Block_Size","Scratch_Size","VGPR_Count","Accum_VGPR_Count","SGPR_Count","Counter_Name","Counter_Value","Start_Timestamp","End_Timestamp"
1,1,4,1,225049,225049,1048576,10,"void addition_kernel<float>(float*, float const*, float const*, int, int)",64,0,0,8,0,16,"SQ_WAVES",16384.000000,317095766765717,317095766775957
2,2,4,1,225049,225049,1048576,13,"subtract_kernel(float*, float const*, float const*, int, int)",64,0,0,8,0,16,"SQ_WAVES",16384.000000,317095767013157,317095767022957
3,3,4,1,225049,225049,1048576,11,"multiply_kernel(float*, float const*, float const*, int, int)",64,0,0,8,0,16,"SQ_WAVES",16384.000000,317095767176998,317095767186678
4,4,4,1,225049,225049,1048576,12,"divide_kernel(float*, float const*, float const*, int, int)",64,0,0,12,4,16,"SQ_WAVES",16384.000000,317095767380718,317095767390878
Kernel rename#
The roctxRangePush and roctxRangePop also let you rename the enclosed kernel with the supplied message. In the legacy rocprof, this functionality was known as --roctx-rename.
See how to use roctxRangePush and roctxRangePop for renaming the enclosed kernel:
#include <rocprofiler-sdk-roctx/roctx.h>

roctxRangePush("HIP_Kernel-1");

// Launching kernel from host
hipLaunchKernelGGL(matrixTranspose, dim3(WIDTH/THREADS_PER_BLOCK_X, WIDTH/THREADS_PER_BLOCK_Y), dim3(THREADS_PER_BLOCK_X, THREADS_PER_BLOCK_Y), 0,0,gpuTransposeMatrix,gpuMatrix, WIDTH);

// Memory transfer from device to host
roctxRangePush("hipMemCpy-DeviceToHost");

hipMemcpy(TransposeMatrix, gpuTransposeMatrix, NUM * sizeof(float), hipMemcpyDeviceToHost);

roctxRangePop();  // for "hipMemcpy"
roctxRangePop();  // for "hipLaunchKernel"
roctxRangeStop(rangeId);
To rename the kernel, use:
rocprofv3 --marker-trace --kernel-rename --output-format csv -- <application_path>
The preceding command generates the following marker-trace file prefixed with the process ID:
 $ cat 210_marker_api_trace.csv
"Domain","Function","Process_Id","Thread_Id","Correlation_Id","Start_Timestamp","End_Timestamp"
"MARKER_CORE_API","roctxGetThreadId",315155,315155,2,58378843928406,58378843930247
"MARKER_CONTROL_API","roctxProfilerPause",315155,315155,3,58378844627184,58378844627502
"MARKER_CONTROL_API","roctxProfilerResume",315155,315155,4,58378844638601,58378844639267
"MARKER_CORE_API","pre-kernel-launch",315155,315155,5,58378844641787,58378844641787
"MARKER_CORE_API","post-kernel-launch",315155,315155,6,58378844936586,58378844936586
"MARKER_CORE_API","memCopyDth",315155,315155,7,58378844938371,58378851383270
"MARKER_CORE_API","HIP_Kernel-1",315155,315155,1,58378526575735,58378851384485
I/O control options#
rocprofv3 provides the following options to control the output.
Output prefix keys#
Output prefix keys are useful in multiple use cases but are most helpful when dealing with multiple profiling runs or large MPI jobs. Here is the list of available keys:
String |
Encoding |
|---|---|
|
Entire command-line condensed into a single string |
|
Similar to |
|
All command-line arguments condensed into a single string |
|
Basename of the first command-line argument |
|
Hostname of the machine ( |
|
Process identifier ( |
|
Parent process identifier ( |
|
Process group identifier ( |
|
Process session identifier ( |
|
Number of sibling processes (reads |
|
Value of |
|
Value of |
|
|
|
|
|
Launch date and/or time according to |
|
Value of |
|
Alternative syntax to |
|
Shorthand for |
|
Shorthand for |
|
Shorthand for |
|
Shorthand for |
Output directory#
To specify the output directory, use --output-directory or -d option. If not specified, the default output path is %hostname%/%pid%.
rocprofv3 --hip-trace --output-directory output_dir --output-format csv -- <application_path>
The preceding command generates an output_dir/%hostname%/%pid%_hip_api_trace.csv file.
The output directory option supports many placeholders such as:
%hostname%: Machine host name%pid%: Process ID%env{NAME}%: Consistent with other output key formats (starts and ends with %)$ENV{NAME}: Similar to CMake%q{NAME}%: Compatibility with NVIDIA
To see the complete list, refer to Output prefix keys.
The following example shows how to use the output directory option with placeholders:
mpirun -n 2 rocprofv3 --hip-trace -d %h.%p.%env{OMPI_COMM_WORLD_RANK}% --output-format csv -- <application_path>
The preceding command runs the application with rocprofv3 and generates the trace file for each rank. The trace files are prefixed with hostname, process ID, and MPI rank.
Assuming the hostname as ubuntu-latest and the process IDs as 3000020 and 3000019, the output file names are:
ubuntu-latest.3000020.1/ubuntu-latest/3000020_agent_info.csv
ubuntu-latest.3000019.0/ubuntu-latest/3000019_agent_info.csv
ubuntu-latest.3000020.1/ubuntu-latest/3000020_hip_api_trace.csv
ubuntu-latest.3000019.0/ubuntu-latest/3000019_hip_api_trace.csv
Output file#
To specify the output file name, use --output-file or -o option. If not specified, the output file is prefixed with the process ID by default.
rocprofv3 --hip-trace --output-file output --output-format csv -- <application_path>
The preceding command generates an output_hip_api_trace.csv file.
The output file name can also include placeholders such as %hostname% and %pid%. For example:
rocprofv3 --hip-trace --output-file %hostname%/%pid%_hip_api_trace --output-format csv -- <application_path>
The preceding command generates an %hostname%/%pid%_hip_api_trace.csv file.
Collection period#
The collection period is the time interval during which the profiling data is collected. You can specify the collection period using the --collection-period or -P option.
You can also specify multiple configurations, each defined by a triplet in the format start_delay:collection_time:repeat.
The triplet is defined as follows:
Start delay time: The time after which the profiling data collection starts.
Collection time: The time period during which the profiling data is collected.
Repeat: The number of times the cycle is repeated. A repeat value of 0 indicates that the cycle will repeat indefinitely.
rocprofv3 --collection-period 5:1:1 --hip-trace -- <application_path>
The preceding command collects the profiling data for 1 second, starting 5 seconds after the application starts, and this cycle will be repeated once.
The collection period can be specified in different units, such as seconds, milliseconds, microseconds, and nanoseconds. The default unit is “seconds”. You can change the unit using the --collection-period-unit option.
The available time units are:
–collection-period-unit: hour, min, sec, msec, usec, nsec
To specify the time unit as milliseconds, use:
rocprofv3 --collection-period 5:1:0 --collection-period-unit msec --hip-trace -- <application_path>
Perfetto-specific options#
The following options are specific to Perfetto tracing and are used to control the Perfetto data collection behavior:
–perfetto-buffer-fill-policy {discard,ring_buffer}: Policy for handling new records when Perfetto reaches the buffer limit.
RING_BUFFER (default): The buffer behaves like a ring buffer. Once full, writes wrap over and replace the oldest trace data in the buffer.
DISCARD: The buffer stops accepting data once full. Further write attempts are dropped.
–perfetto-buffer-size KB: The buffer size for Perfetto output in KB. Default: 1 GB. If set, stops the tracing session after N bytes have been written. Used to cap the trace size.
–perfetto-backend {inprocess,system}: Perfetto data collection backend.
systemmode requires starting traced and perfetto daemons. By default Perfetto keeps the full trace buffers in memory.–perfetto-shmem-size-hint KB: Perfetto shared memory size hint in KB. Default: 64 KB. This option gives you control over shared memory buffer sizing. You can tweak this option to avoid data losses when data is produced at a higher rate.
Output file fields#
The following table lists the various fields or the columns in the output CSV files generated for application tracing and kernel counter collection:
Field |
Description |
|---|---|
Agent_Id |
GPU identifier to which the kernel was submitted. |
Correlation_Id |
Unique identifier for correlation between HIP and HSA async calls during activity tracing. |
Start_Timestamp |
Begin time in nanoseconds (ns) when the kernel begins execution. |
End_Timestamp |
End time in ns when the kernel finishes execution. |
Queue_Id |
ROCm queue unique identifier to which the kernel was submitted. |
Stream_Id |
Identifies HIP stream ID to which kernel or memory copy operation was submitted. Defaults to 0 if the hip-stream-display option is not enabled |
Private_Segment_Size |
The amount of memory required in bytes for the combined private, spill, and arg segments for a work item. |
Group_Segment_Size |
The group segment memory required by a workgroup in bytes. This does not include any dynamically allocated group segment memory that may be added when the kernel is dispatched. |
Workgroup_Size |
Size of the workgroup as declared by the compute shader. |
Workgroup_Size_n |
Size of the workgroup in the nth dimension as declared by the compute shader, where n = X, Y, or Z. |
Grid_Size |
Number of thread blocks required to launch the kernel. |
Grid_Size_n |
Number of thread blocks in the nth dimension required to launch the kernel, where n = X, Y, or Z. |
LDS_Block_Size |
Thread block size for the kernel’s Local Data Share (LDS) memory. |
Scratch_Size |
Kernel’s scratch memory size. |
SGPR_Count |
Kernel’s Scalar General Purpose Register (SGPR) count. |
VGPR_Count |
Kernel’s Architected Vector General Purpose Register (VGPR) count. |
Accum_VGPR_Count |
Kernel’s Accumulation Vector General Purpose Register (Accum_VGPR/AGPR) count. |
Output formats#
rocpd (SQLite3 Database (Default))
CSV
JSON (Custom format for programmatic analysis only)
PFTrace (Perfetto trace for visualization with Perfetto)
OTF2 (Open Trace Format for visualization with compatible third-party tools)
The default output format is rocpd. To know more about the rocpd format, see Using rocpd Output Format.
To specify the particular output format, use the --output-format option followed by the desired format.
rocprofv3 -i input.txt --output-format json -- <application_path>
Format selection is case-insensitive and multiple output formats are supported. While --output-format json exclusively enables JSON output, --output-format csv json pftrace otf2, rocpd enables all four output formats for the run.
For PFTrace trace visualization, use the PFTrace format and open the trace in ui.perfetto.dev.
For OTF2 trace visualization, open the trace in vampir.eu or any supported visualizer.
Note
For large trace files (> 10GB), it’s recommended to use OTF2 format.
JSON output schema#
rocprofv3 supports a custom JSON output format designed for programmatic analysis and NOT for visualization.
The schema is optimized for size while factoring in usability.
Note
Perfetto UI doesn’t accept this JSON output format.
To generate the JSON output, use --output-format json command-line option.
Properties#
Here are the properties of the JSON output schema:
- rocprofiler-sdk-tool (array): rocprofv3 data per process (each element represents a process).
- Items (object): Data for rocprofv3.
- metadata (object, required): Metadata related to the profiler session.
pid (integer, required): Process ID.
init_time (integer, required): Initialization time in nanoseconds.
fini_time (integer, required): Finalization time in nanoseconds.
- agents (array, required): List of agents.
- Items (object): Data for an agent.
size (integer, required): Size of the agent data.
- id (object, required): Identifier for the agent.
handle (integer, required): Handle for the agent.
type (integer, required): Type of the agent.
cpu_cores_count (integer): Number of CPU cores.
simd_count (integer): Number of SIMD units.
mem_banks_count (integer): Number of memory banks.
caches_count (integer): Number of caches.
io_links_count (integer): Number of I/O links.
cpu_core_id_base (integer): Base ID for CPU cores.
simd_id_base (integer): Base ID for SIMD units.
max_waves_per_simd (integer): Maximum waves per SIMD.
lds_size_in_kb (integer): Size of LDS in KB.
gds_size_in_kb (integer): Size of GDS in KB.
num_gws (integer): Number of GWS (global work size).
wave_front_size (integer): Size of the wave front.
num_xcc (integer): Number of XCC (execution compute units).
cu_count (integer): Number of compute units (CUs).
array_count (integer): Number of arrays.
num_shader_banks (integer): Number of shader banks.
simd_arrays_per_engine (integer): SIMD arrays per engine.
cu_per_simd_array (integer): CUs per SIMD array.
simd_per_cu (integer): SIMDs per CU.
max_slots_scratch_cu (integer): Maximum slots for scratch CU.
gfx_target_version (integer): GFX target version.
vendor_id (integer): Vendor ID.
device_id (integer): Device ID.
location_id (integer): Location ID.
domain (integer): Domain identifier.
drm_render_minor (integer): DRM render minor version.
num_sdma_engines (integer): Number of SDMA engines.
num_sdma_xgmi_engines (integer): Number of SDMA XGMI engines.
num_sdma_queues_per_engine (integer): Number of SDMA queues per engine.
num_cp_queues (integer): Number of CP queues.
max_engine_clk_ccompute (integer): Maximum engine clock for compute.
max_engine_clk_fcompute (integer): Maximum engine clock for F compute.
- sdma_fw_version (object): SDMA firmware version.
uCodeSDMA (integer, required): SDMA microcode version.
uCodeRes (integer, required): Reserved microcode version.
- fw_version (object): Firmware version.
uCode (integer, required): Microcode version.
Major (integer, required): Major version.
Minor (integer, required): Minor version.
Stepping (integer, required): Stepping version.
- capability (object, required): Agent capability flags.
HotPluggable (integer, required): Hot pluggable capability.
HSAMMUPresent (integer, required): HSAMMU present capability.
SharedWithGraphics (integer, required): Shared with graphics capability.
QueueSizePowerOfTwo (integer, required): Queue size is power of two.
QueueSize32bit (integer, required): Queue size is 32-bit.
QueueIdleEvent (integer, required): Queue idle event.
VALimit (integer, required): VA limit.
WatchPointsSupported (integer, required): Watch points supported.
WatchPointsTotalBits (integer, required): Total bits for watch points.
DoorbellType (integer, required): Doorbell type.
AQLQueueDoubleMap (integer, required): AQL queue double map.
DebugTrapSupported (integer, required): Debug trap supported.
WaveLaunchTrapOverrideSupported (integer, required): Wave launch trap override supported.
WaveLaunchModeSupported (integer, required): Wave launch mode supported.
PreciseMemoryOperationsSupported (integer, required): Precise memory operations supported.
DEPRECATED_SRAM_EDCSupport (integer, required): Deprecated SRAM EDC support.
Mem_EDCSupport (integer, required): Memory EDC support.
RASEventNotify (integer, required): RAS event notify.
ASICRevision (integer, required): ASIC revision.
SRAM_EDCSupport (integer, required): SRAM EDC support.
SVMAPISupported (integer, required): SVM API supported.
CoherentHostAccess (integer, required): Coherent host access.
DebugSupportedFirmware (integer, required): Debug supported firmware.
Reserved (integer, required): Reserved field.
- counters (array, required): Array of counter objects.
- Items (object)
- agent_id (object, required): Agent ID information.
handle (integer, required): Handle of the agent.
- id (object, required): Counter ID information.
handle (integer, required): Handle of the counter.
is_constant (integer, required): Indicator if the counter value is constant.
is_derived (integer, required): Indicator if the counter value is derived.
name (string, required): Name of the counter.
description (string, required): Description of the counter.
block (string, required): Block information of the counter.
expression (string, required): Expression of the counter.
- dimension_ids (array, required): Array of dimension IDs.
Items (integer): Dimension ID.
- strings (object, required): String records.
- callback_records (array): Callback records.
- Items (object)
kind (string, required): Kind of the record.
- operations (array, required): Array of operations.
Items (string): Operation.
- buffer_records (array): Buffer records.
- Items (object)
kind (string, required): Kind of the record.
- operations (array, required): Array of operations.
Items (string): Operation.
- marker_api (array): Marker API records.
- Items (object)
key (integer, required): Key of the record.
value (string, required): Value of the record.
- counters (object): Counter records.
- dimension_ids (array, required): Array of dimension IDs.
- Items (object)
id (integer, required): Dimension ID.
instance_size (integer, required): Size of the instance.
name (string, required): Name of the dimension.
pc_sample_instructions (array): Array of decoded instructions matching sampled PCs from pc_sample_host_trap section.
pc_sample_comments (array): Comments matching assembly instructions from pc_sample_instructions array. If debug symbols are available, comments provide instructions to source-line mapping. Otherwise, a comment is an empty string.
- code_objects (array, required): Code object records.
- Items (object)
size (integer, required): Size of the code object.
code_object_id (integer, required): ID of the code object.
- rocp_agent (object, required): ROCP agent information.
handle (integer, required): Handle of the ROCP agent.
- hsa_agent (object, required): HSA agent information.
handle (integer, required): Handle of the HSA agent.
uri (string, required): URI of the code object.
load_base (integer, required): Base address for loading.
load_size (integer, required): Size for loading.
load_delta (integer, required): Delta for loading.
storage_type (integer, required): Type of storage.
memory_base (integer, required): Base address for memory.
memory_size (integer, required): Size of memory.
- kernel_symbols (array, required): Kernel symbol records.
- Items (object)
size (integer, required): Size of the kernel symbol.
kernel_id (integer, required): ID of the kernel.
code_object_id (integer, required): ID of the code object.
kernel_name (string, required): Name of the kernel.
kernel_object (integer, required): Object of the kernel.
kernarg_segment_size (integer, required): Size of the kernarg segment.
kernarg_segment_alignment (integer, required): Alignment of the kernarg segment.
group_segment_size (integer, required): Size of the group segment.
private_segment_size (integer, required): Size of the private segment.
formatted_kernel_name (string, required): Formatted name of the kernel.
demangled_kernel_name (string, required): Demangled name of the kernel.
truncated_kernel_name (string, required): Truncated name of the kernel.
- callback_records (object, required): Callback record details.
- counter_collection (array): Counter collection records.
- Items (object)
- dispatch_data (object, required): Dispatch data details.
size (integer, required): Size of the dispatch data.
- correlation_id (object, required): Correlation ID information.
internal (integer, required): Internal correlation ID.
external (integer, required): External correlation ID.
- dispatch_info (object, required): Dispatch information details.
size (integer, required): Size of the dispatch information.
- agent_id (object, required): Agent ID information.
handle (integer, required): Handle of the agent.
- queue_id (object, required): Queue ID information.
handle (integer, required): Handle of the queue.
kernel_id (integer, required): ID of the kernel.
dispatch_id (integer, required): ID of the dispatch.
private_segment_size (integer, required): Size of the private segment.
group_segment_size (integer, required): Size of the group segment.
- workgroup_size (object, required): Workgroup size information.
x (integer, required): X dimension.
y (integer, required): Y dimension.
z (integer, required): Z dimension.
- grid_size (object, required): Grid size information.
x (integer, required): X dimension.
y (integer, required): Y dimension.
z (integer, required): Z dimension.
- records (array, required): Records.
- Items (object)
- counter_id (object, required): Counter ID information.
handle (integer, required): Handle of the counter.
value (number, required): Value of the counter.
thread_id (integer, required): Thread ID.
arch_vgpr_count (integer, required): Count of Architected VGPRs.
accum_vgpr_count (integer, required): Count of Accumulation VGPRs.
sgpr_count (integer, required): Count of SGPRs.
lds_block_size_v (integer, required): Size of LDS block.
- pc_sample_host_trap (array): Host Trap PC Sampling records.
- Items (object)
- hw_id (object): Describes hardware part on which sampled wave was running.
chiplet (integer): Chiplet index.
wave_id (integer): Wave slot index.
simd_id (integer): SIMD index.
pipe_id (integer): Pipe index.
cu_or_wgp_id (integer): Index of compute unit or workgroup processer.
shader_array_id (integer): Shader array index.
shader_engine_id (integer): Shader engine index.
workgroup_id (integer): Workgroup position in the 3D.
vm_id (integer): Virtual memory ID.
queue_id (integer): Queue id.
microengine_id (integer): ACE (microengine) index.
pc (object): Encapsulates information about sampled PC. - code_object_id (integer): Code object id. - code_object_offset (integer): Offset within the object if the latter is known. Otherwise, virtual address of the PC.
exec_mask (integer): Execution mask indicating active SIMD lanes of sampled wave.
timestamp (integer): Timestamp.
dispatch_id (integer): Dispatch id.
correlation_id (object): Correlation ID information. - internal (integer): Internal correlation ID. - external (integer): External correlation ID.
- rocprofiler_dim3_t (object): Position of the workgroup in 3D grid.
x (integer): Dimension x.
y (integer): Dimension y.
z (integer): Dimension z.
wave_in_group (integer): Wave position within the workgroup (0-31).
- buffer_records (object, required): Buffer record details.
- kernel_dispatch (array): Kernel dispatch records.
- Items (object)
size (integer, required): Size of the dispatch.
kind (integer, required): Kind of the dispatch.
operation (integer, required): Operation of the dispatch.
thread_id (integer, required): Thread ID.
- correlation_id (object, required): Correlation ID information.
internal (integer, required): Internal correlation ID.
external (integer, required): External correlation ID.
start_timestamp (integer, required): Start timestamp.
end_timestamp (integer, required): End timestamp.
- dispatch_info (object, required): Dispatch information details.
size (integer, required): Size of the dispatch information.
- agent_id (object, required): Agent ID information.
handle (integer, required): Handle of the agent.
- queue_id (object, required): Queue ID information.
handle (integer, required): Handle of the queue.
kernel_id (integer, required): ID of the kernel.
dispatch_id (integer, required): ID of the dispatch.
private_segment_size (integer, required): Size of the private segment.
group_segment_size (integer, required): Size of the group segment.
- workgroup_size (object, required): Workgroup size information.
x (integer, required): X dimension.
y (integer, required): Y dimension.
z (integer, required): Z dimension.
- grid_size (object, required): Grid size information.
x (integer, required): X dimension.
y (integer, required): Y dimension.
z (integer, required): Z dimension.
- hip_api (array): HIP API records.
- Items (object)
size (integer, required): Size of the HIP API record.
kind (integer, required): Kind of the HIP API.
operation (integer, required): Operation of the HIP API.
- correlation_id (object, required): Correlation ID information.
internal (integer, required): Internal correlation ID.
external (integer, required): External correlation ID.
start_timestamp (integer, required): Start timestamp.
end_timestamp (integer, required): End timestamp.
thread_id (integer, required): Thread ID.
- hsa_api (array): HSA API records.
- Items (object)
size (integer, required): Size of the HSA API record.
kind (integer, required): Kind of the HSA API.
operation (integer, required): Operation of the HSA API.
- correlation_id (object, required): Correlation ID information.
internal (integer, required): Internal correlation ID.
external (integer, required): External correlation ID.
start_timestamp (integer, required): Start timestamp.
end_timestamp (integer, required): End timestamp.
thread_id (integer, required): Thread ID.
- marker_api (array): Marker (ROCTx) API records.
- Items (object)
size (integer, required): Size of the Marker API record.
kind (integer, required): Kind of the Marker API.
operation (integer, required): Operation of the Marker API.
- correlation_id (object, required): Correlation ID information.
internal (integer, required): Internal correlation ID.
external (integer, required): External correlation ID.
start_timestamp (integer, required): Start timestamp.
end_timestamp (integer, required): End timestamp.
thread_id (integer, required): Thread ID.
- memory_copy (array): Async memory copy records.
- Items (object)
size (integer, required): Size of the Marker API record.
kind (integer, required): Kind of the Marker API.
operation (integer, required): Operation of the Marker API.
- correlation_id (object, required): Correlation ID information.
internal (integer, required): Internal correlation ID.
external (integer, required): External correlation ID.
start_timestamp (integer, required): Start timestamp.
end_timestamp (integer, required): End timestamp.
thread_id (integer, required): Thread ID.
- dst_agent_id (object, required): Destination Agent ID.
handle (integer, required): Handle of the agent.
- src_agent_id (object, required): Source Agent ID.
handle (integer, required): Handle of the agent.
bytes (integer, required): Bytes copied.
- memory_allocation (array): Memory allocation records.
- Items (object)
size (integer, required): Size of the Marker API record.
kind (integer, required): Kind of the Marker API.
operation (integer, required): Operation of the Marker API.
- correlation_id (object, required): Correlation ID information.
internal (integer, required): Internal correlation ID.
external (integer, required): External correlation ID.
start_timestamp (integer, required): Start timestamp.
end_timestamp (integer, required): End timestamp.
thread_id (integer, required): Thread ID.
- agent_id (object, required): Agent ID.
handle (integer, required): Handle of the agent.
address (string, required): Starting address of allocation.
allocation_size (integer, required): Size of allocation.
- rocDecode_api (array): rocDecode API records.
- Items (object)
size (integer, required): Size of the rocDecode API record.
kind (integer, required): Kind of the rocDecode API.
operation (integer, required): Operation of the rocDecode API.
- correlation_id (object, required): Correlation ID information.
internal (integer, required): Internal correlation ID.
external (integer, required): External correlation ID.
start_timestamp (integer, required): Start timestamp.
end_timestamp (integer, required): End timestamp.
thread_id (integer, required): Thread ID.