Text-based User Interface (TUI) analysis#
ROCm Compute Profiler’s analyze mode now supports a lightweight Text-based User Interface (TUI) that provides an interactive terminal experience for enhanced usability. You can use the TUI interface as a more visually engaging and interactive alternative to explore individual kernel analysis results compared to the standard CLI analysis. It provides enhanced visual feedback and easy navigation without needing the extra setup of a full graphical interface. This analysis option is implemented as a terminal-based interface that offers real-time visual feedback, keyboard shortcuts for common actions, and improved readability with formatted output.
Note
TUI is currently in an early access state. While functional, you may encounter minor issues or limitations. For the limitations identified, see Current limitations Running production workloads is not recommended.
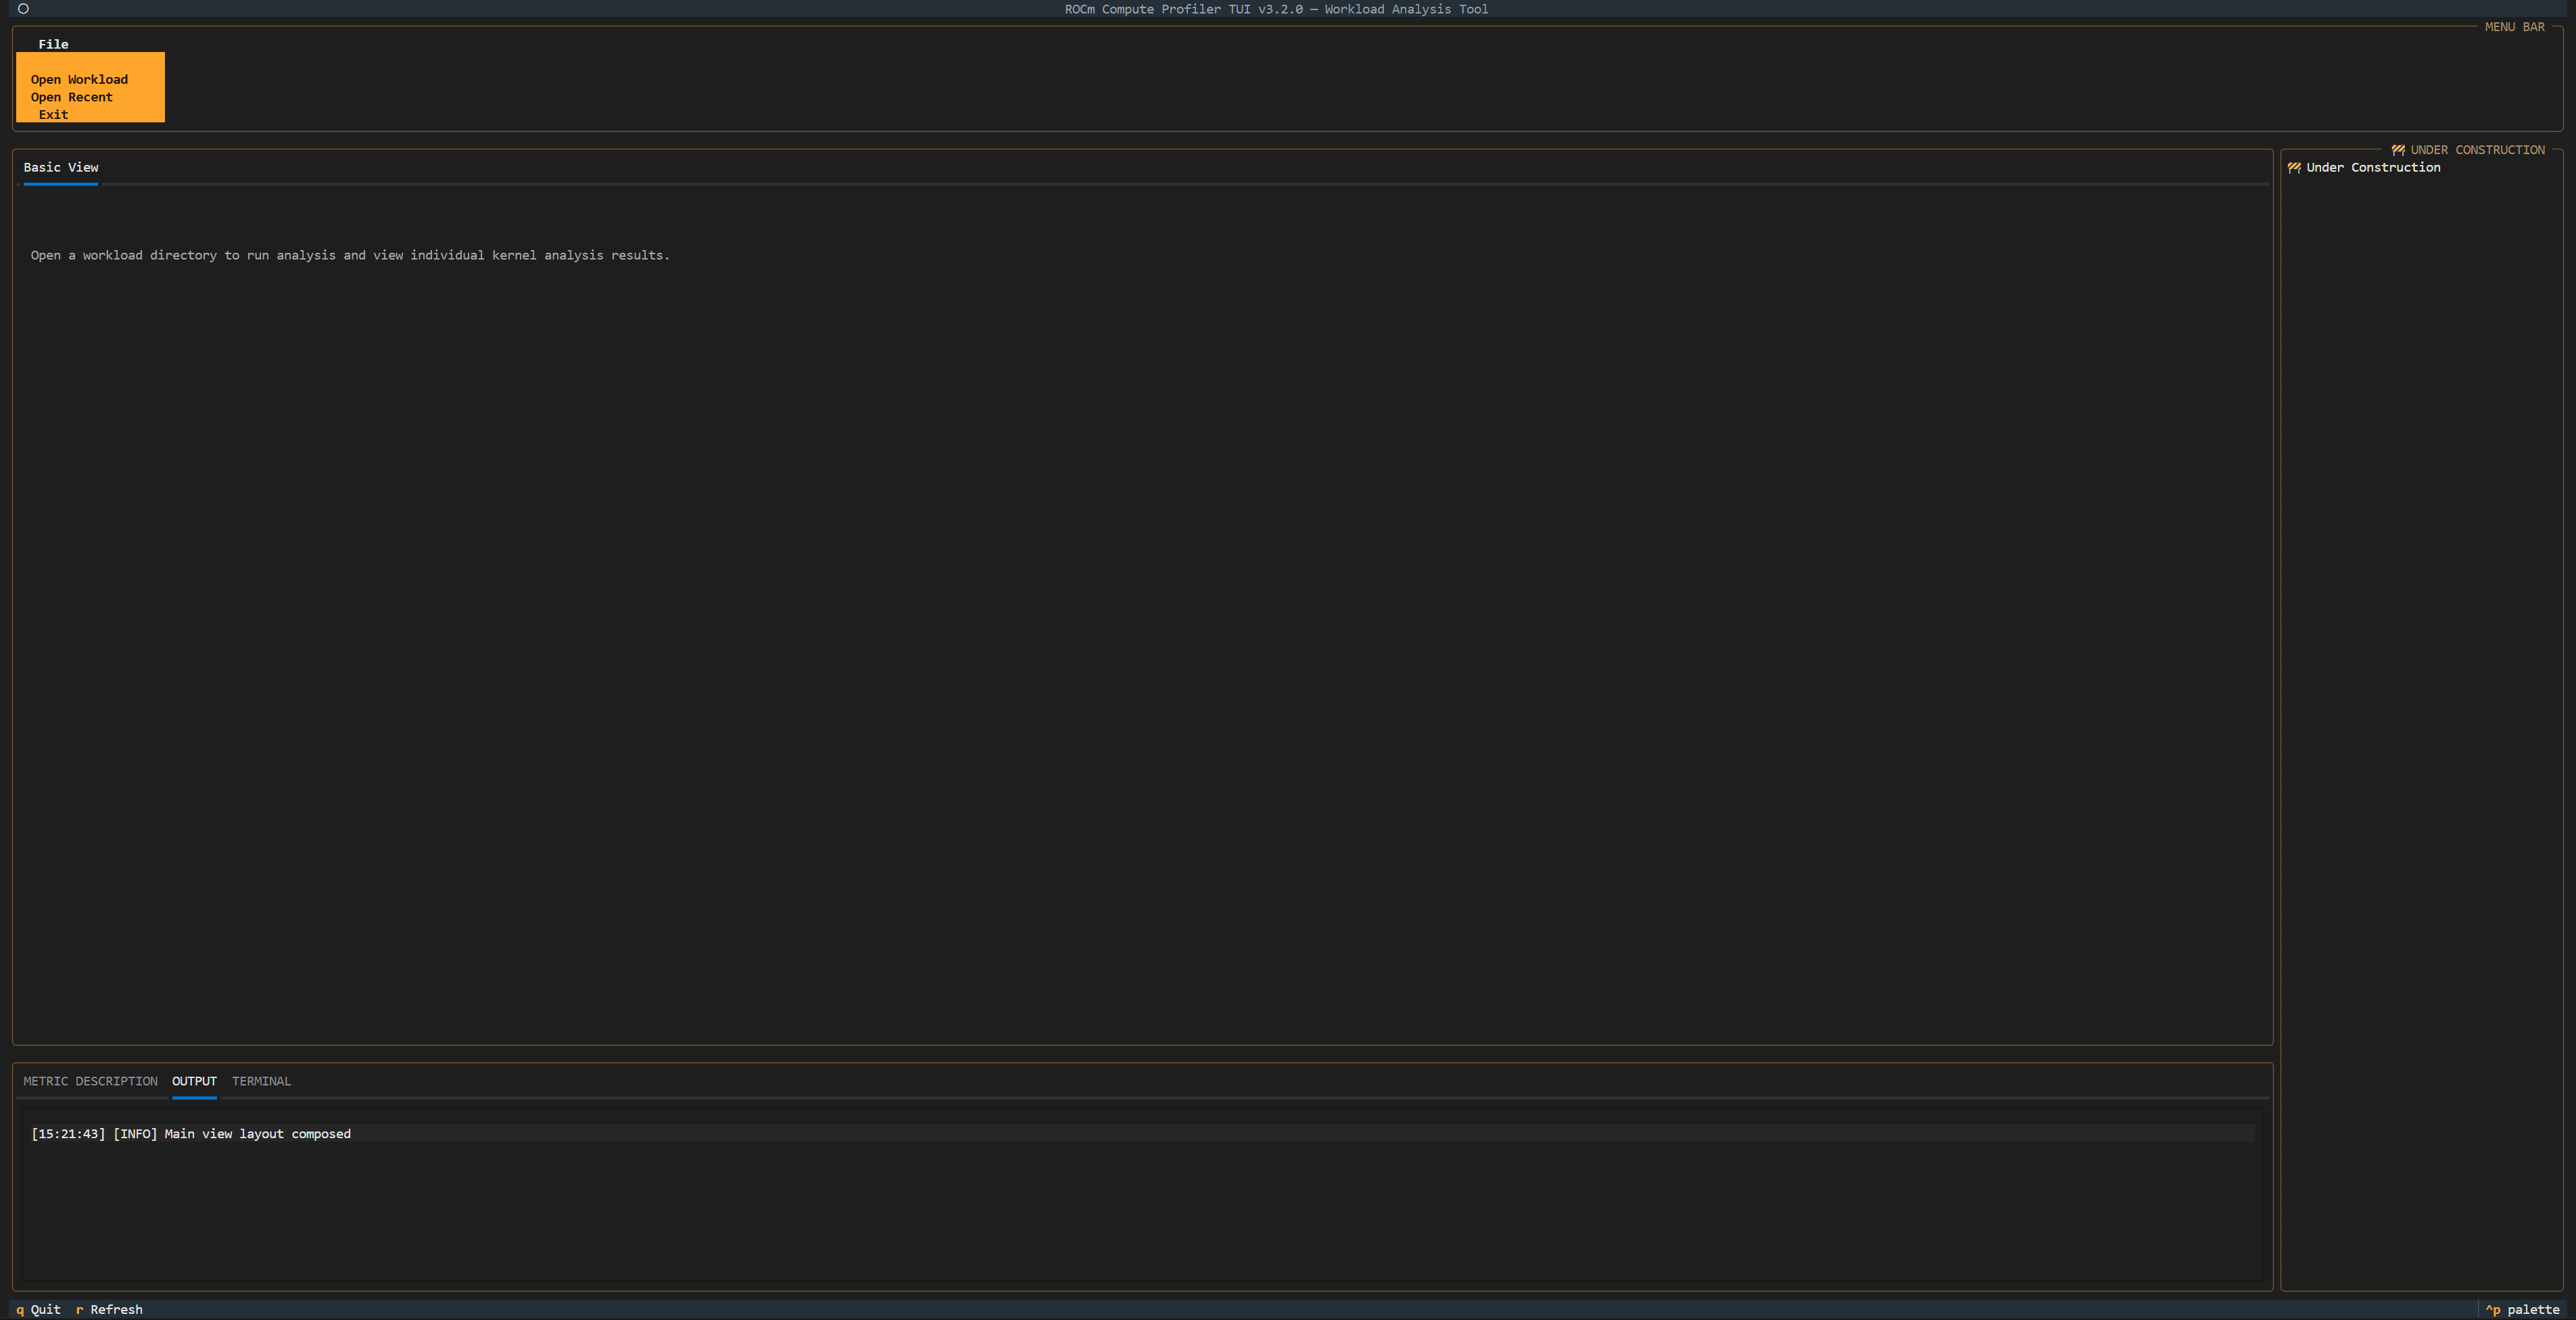
Launch the TUI analyzer#
1. Use the --tui flag with the analysis command to launch the ROCm Compute Profiler TUI analyzer.
For example:
$ rocprof-compute analyze --tui
2. To start the individual kernel analysis, use the drop-down menu at the top left of the screen to select
a single workload from rocprof-compute profile generated output directories.
3. You can see the center window update with a top header for kernel selection and collapsed contents beneath. Select a kernel of interest to load the corresponding analysis results. The top kernel is selected by default.
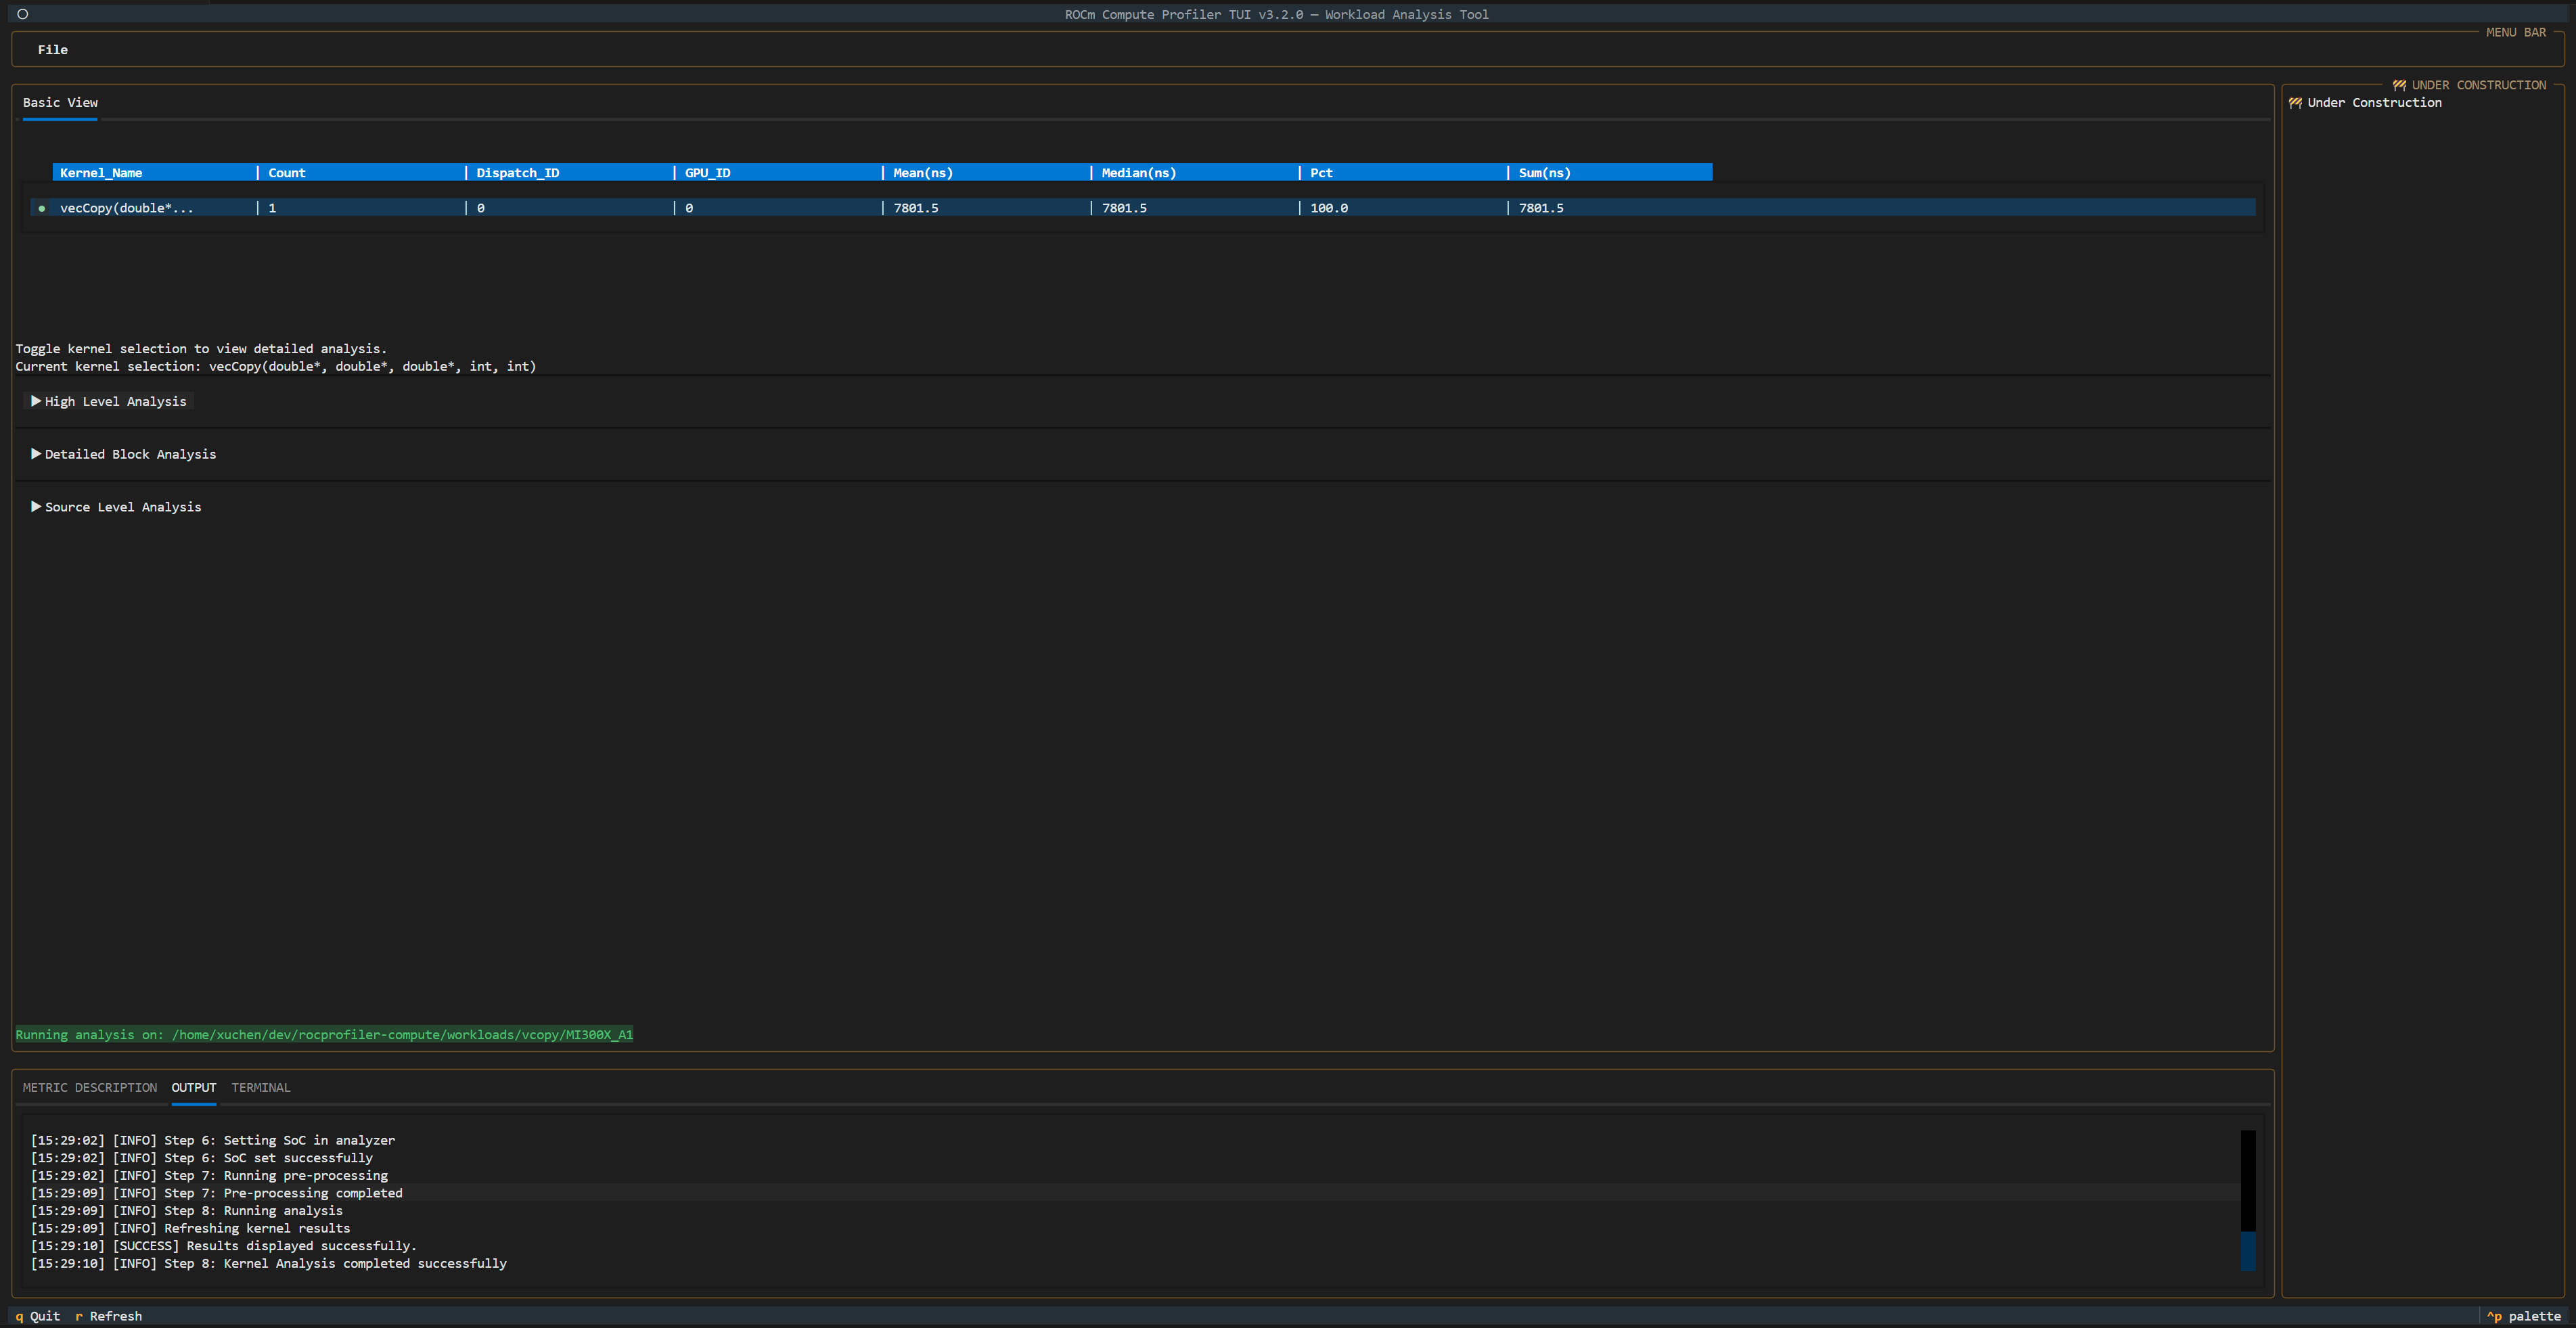
4. After the analysis results are loaded, you can start interactive analysis with the detailed metrics by expanding the collapsed contents to view tables, charts, and graphs, and visualizing the analysis data. The TUI supports basic keyboard shortcuts, including quit application commands for easy navigation.
TUI analysis structure#
Unlike the CLI analysis plain style interfaces, the TUI restructures the analysis workflow into four hierarchical categories to provide a more organized, top-down analysis approach:
Kernel Selection Header with Top Stats:
Supports interactive kernel selection to toggle between kernel(s) to view individual kernel analysis results.
High Level Analysis:
Experimental performance metrics layout, reorganized performance metrics grouping to display the new GPU Speed-of-Light section, Compute Throughput section, and Memory Throughput section.
Detailed Block Analysis
Displays analysis results grouped by metric blocks, similar to the CLI output. When applicable, performance metrics are shown as charts instead of only tables, providing a more visual representation.
Source Level analysis
Displays the PC Sampling section. Source Level analysis does not have PC sampling enabled by default during the profiling stage. Refer to Using PC sampling in ROCm Compute Profiler for details on how to build and enable PC sampling manually.
You are recommended to follow this top-down hierarchical structure to conduct a thorough performance analysis, starting with the broad overview and progressively drilling down to specific details.
Current limitations#
The TUI implementation has several limitations that will be addressed in future releases:
PC sampling: Source Level analysis does not have PC sampling enabled by default during the profiling stage. Refer to Using PC sampling in ROCm Compute Profiler for details on how to build and enable PC sampling manually.
Filtering capabilities: Advanced filtering options such as kernel filtering and dispatch filtering are currently not supported. These features will be available in upcoming releases.