CLI analysis#
This section provides an overview of ROCm Compute Profiler’s CLI analysis features.
Derived metrics: All of ROCm Compute Profiler’s built-in metrics.
Baseline comparison: Compare multiple runs in a side-by-side manner.
Metric customization: Isolate a subset of built-in metrics or build your own profiling configuration.
Filtering: Hone in on a particular kernel, GPU ID, or dispatch ID via post-process filtering.
Run rocprof-compute analyze -h for more details.
Walkthrough#
To begin, generate a high-level analysis report using ROCm Compute Profiler’s
-b(or--block) flag.
There are three high-level GPU analysis views:
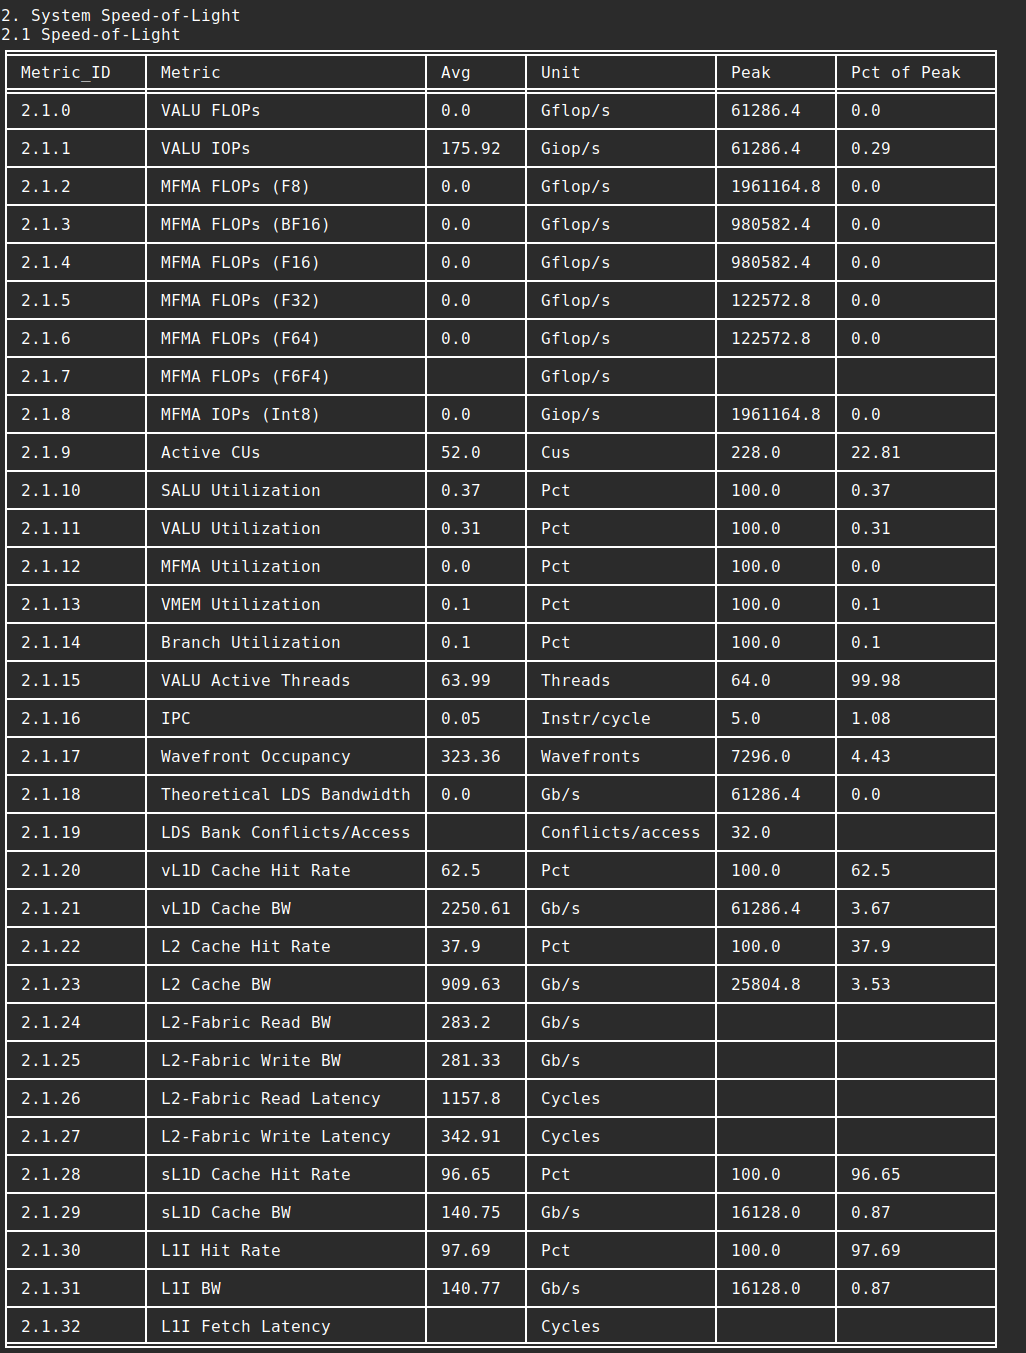
System Speed-of-Light: Key GPU performance metrics to show overall GPU performance and utilization.
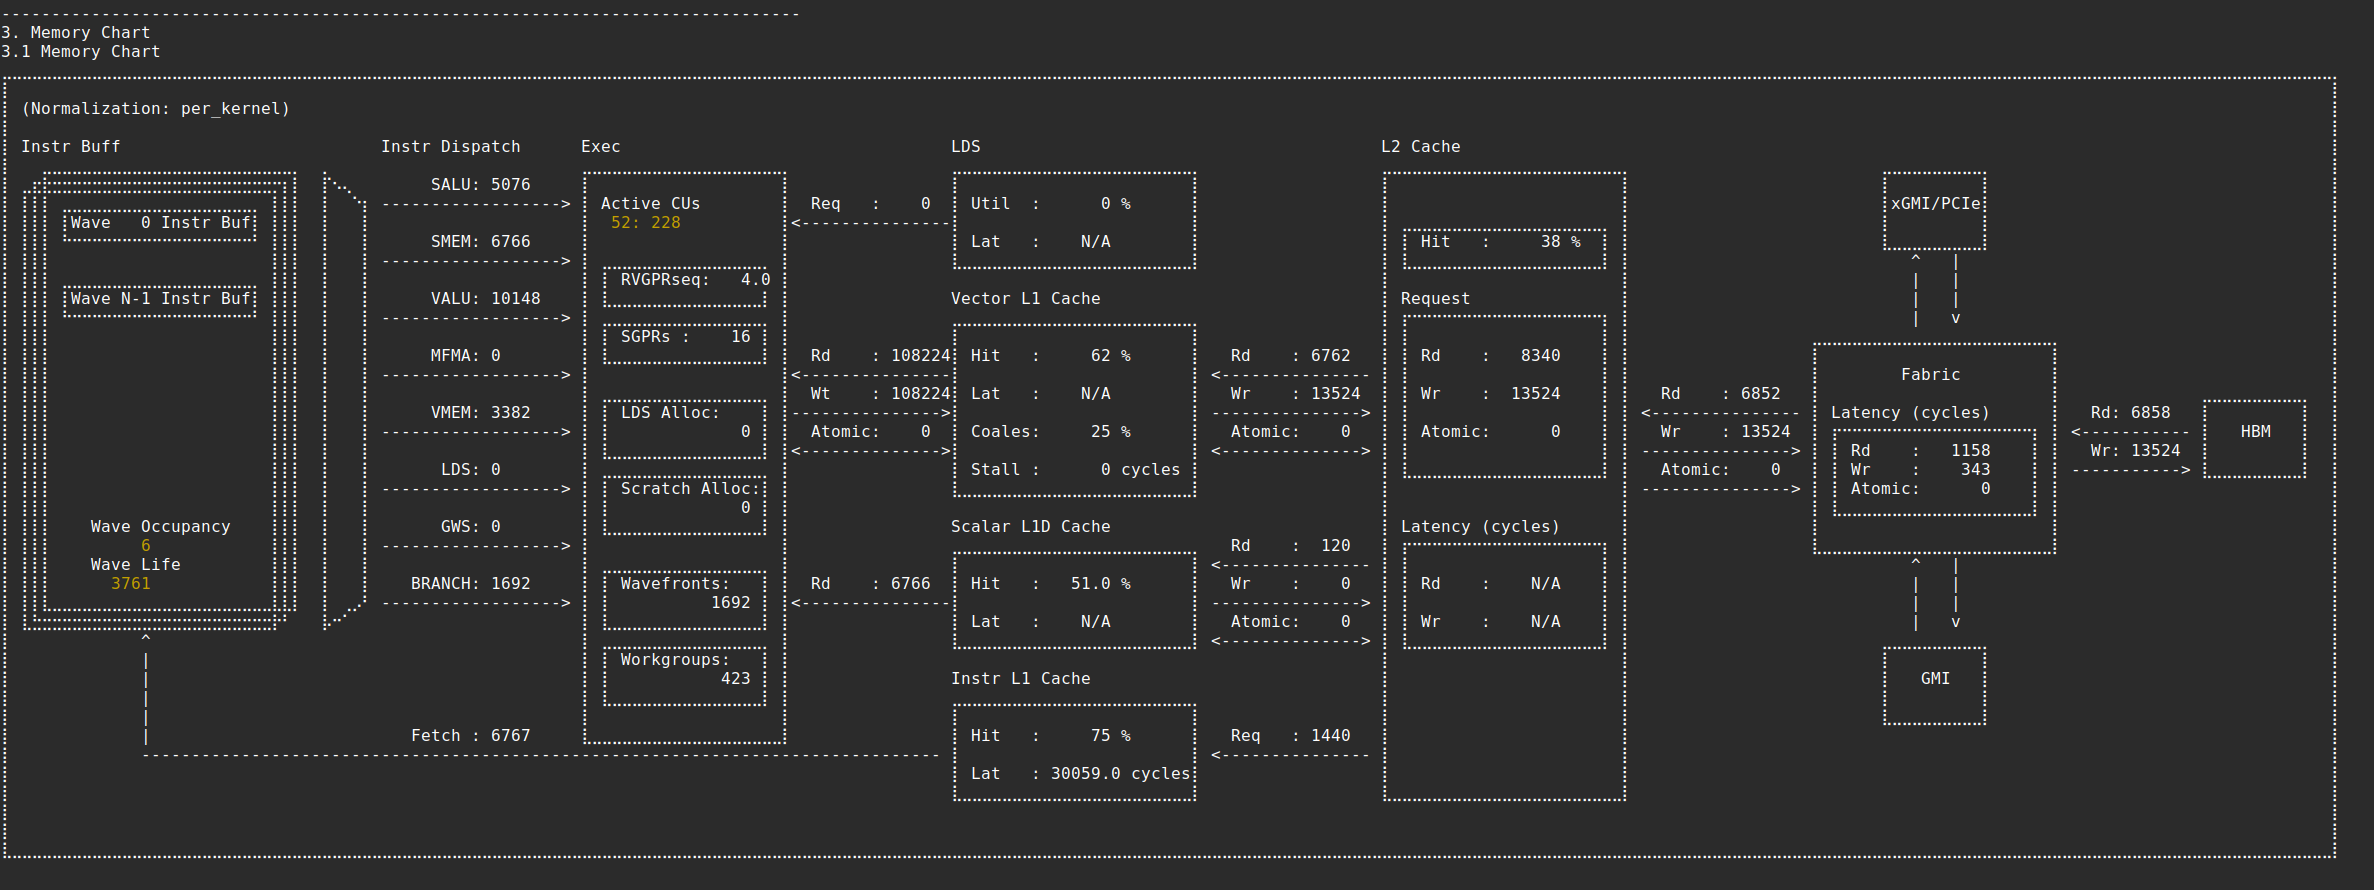
Memory chart: Shows memory transactions and throughput on each cache hierarchical level.
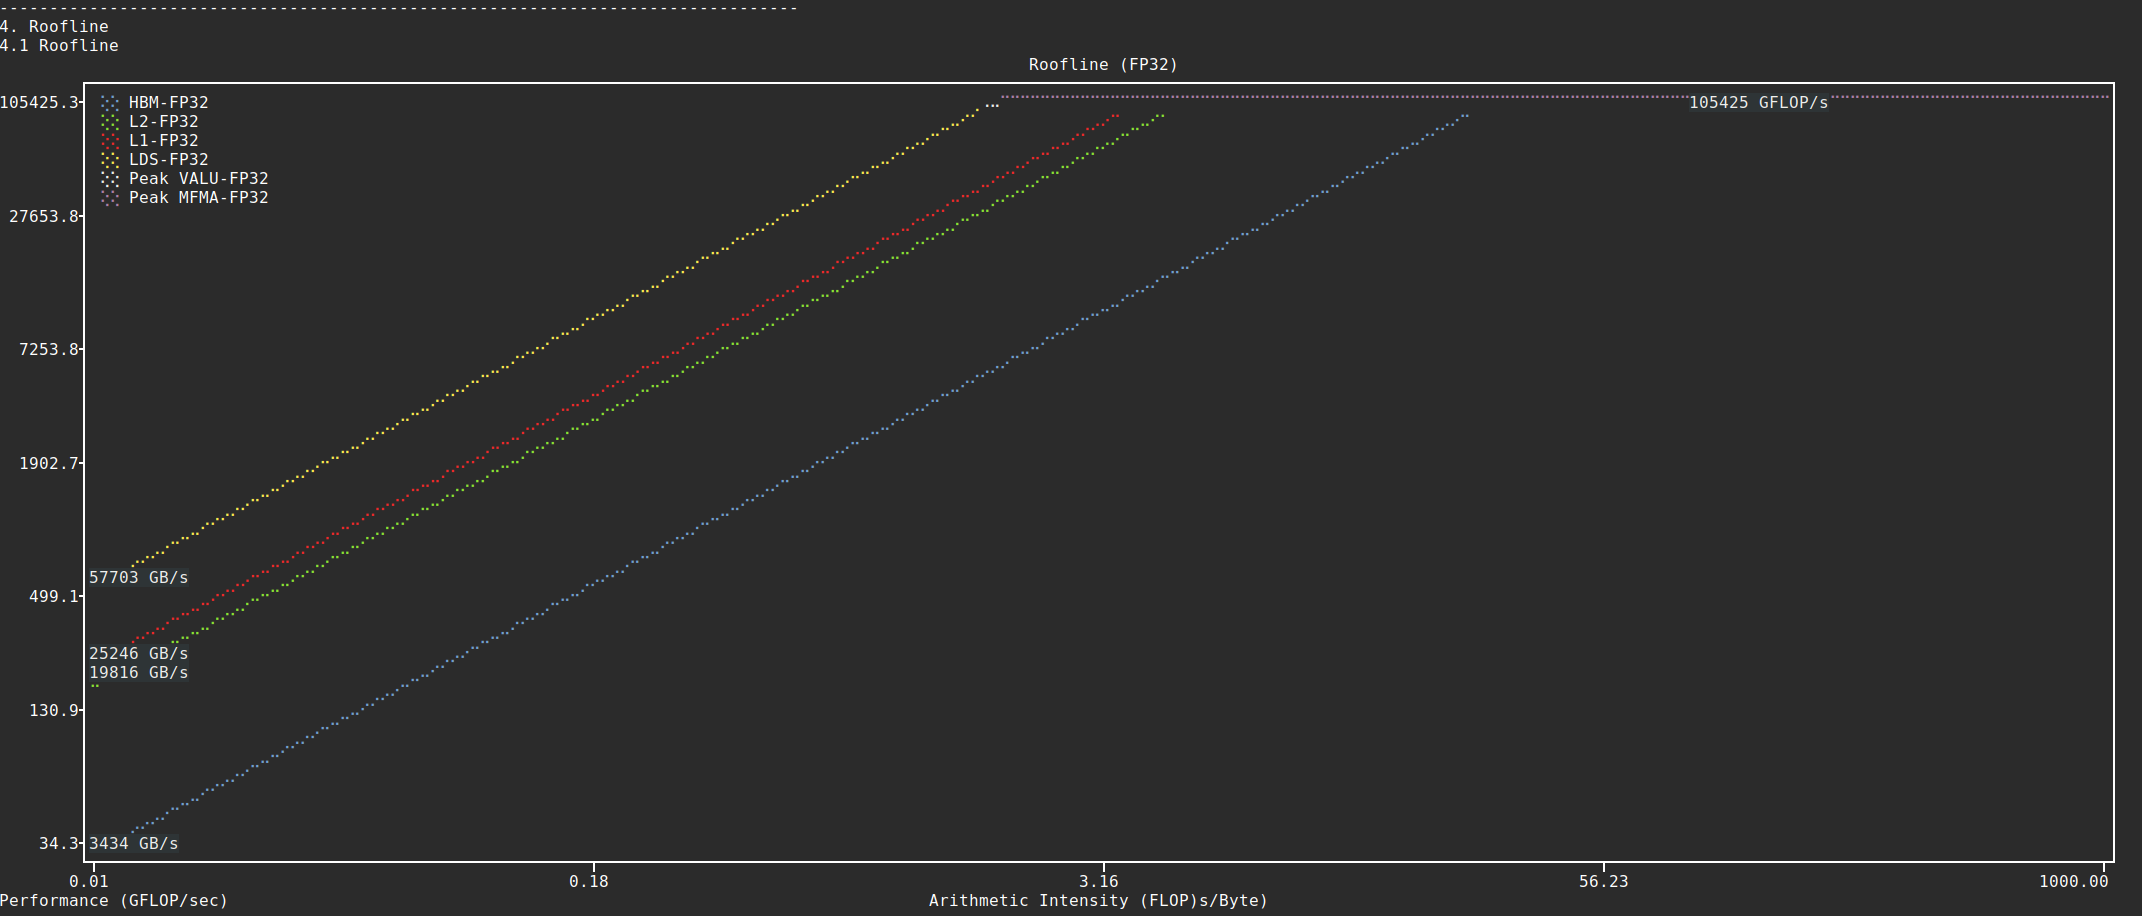
Empirical hierarchical roofline: Roofline model that compares achieved throughput with attainable peak hardware limits, more specifically peak compute throughput and memory bandwidth (on L1/LDS/L2/HBM).
System Speed-of-Light:
$ rocprof-compute analyze -p workloads/vcopy/MI200/ -b 2
Memory chart:
$ rocprof-compute analyze -p workloads/vcopy/MI200/ -b 3
Empirical hierarchical roofline:
$ rocprof-compute analyze -p workloads/vcopy/MI200/ -b 4
Note
Visualized memory chart and Roofline chart are only supported in single run analysis. In multiple runs comparison mode, both are switched back to basic table view.
Visualized memory chart requires the width of the terminal output to be greater than or equal to 234 to display the whole chart properly.
Visualized Roofline chart is adapted to the initial terminal size only. If it is not clear, you may need to adjust the terminal size and regenerate it to check the display effect.
Use
--list-metricsto generate a list of available metrics for inspection.$ rocprof-compute analyze -p workloads/vcopy/MI200/ --list-metrics gfx90a __ _ _ __ ___ ___ _ __ _ __ ___ / _| ___ ___ _ __ ___ _ __ _ _| |_ ___ | '__/ _ \ / __| '_ \| '__/ _ \| |_ _____ / __/ _ \| '_ ` _ \| '_ \| | | | __/ _ \ | | | (_) | (__| |_) | | | (_) | _|_____| (_| (_) | | | | | | |_) | |_| | || __/ |_| \___/ \___| .__/|_| \___/|_| \___\___/|_| |_| |_| .__/ \__,_|\__\___| |_| |_| Analysis mode = cli [analysis] deriving rocprofiler-compute metrics... 0 -> Top Stats 1 -> System Info 2 -> System Speed-of-Light 2.1 -> Speed-of-Light 2.1.0 -> VALU FLOPs 2.1.1 -> VALU IOPs 2.1.2 -> MFMA FLOPs (BF16) 2.1.3 -> MFMA FLOPs (F16) 2.1.4 -> MFMA FLOPs (F32) 2.1.5 -> MFMA FLOPs (F64) 2.1.6 -> MFMA IOPs (Int8) 2.1.7 -> Active CUs 2.1.8 -> SALU Utilization 2.1.9 -> VALU Utilization 2.1.10 -> MFMA Utilization 2.1.11 -> VMEM Utilization 2.1.12 -> Branch Utilization 2.1.13 -> VALU Active Threads 2.1.14 -> IPC 2.1.15 -> Wavefront Occupancy 2.1.16 -> Theoretical LDS Bandwidth 2.1.17 -> LDS Bank Conflicts/Access 2.1.18 -> vL1D Cache Hit Rate 2.1.19 -> vL1D Cache BW 2.1.20 -> L2 Cache Hit Rate 2.1.21 -> L2 Cache BW 2.1.22 -> L2-Fabric Read BW 2.1.23 -> L2-Fabric Write BW 2.1.24 -> L2-Fabric Read Latency 2.1.25 -> L2-Fabric Write Latency 2.1.26 -> sL1D Cache Hit Rate 2.1.27 -> sL1D Cache BW 2.1.28 -> L1I Hit Rate 2.1.29 -> L1I BW 2.1.30 -> L1I Fetch Latency ...
Choose your own customized subset of metrics with the
-b(or--block) option. Or, build your own configuration following config_template. The following snippet shows how to generate a report containing only metric 2 (System Speed-of-Light).$ rocprof-compute analyze -p workloads/vcopy/MI200/ -b 2 -------- Analyze -------- -------------------------------------------------------------------------------- 1. Top Stat ╒════╤══════════════════════════════════════════╤═════════╤═══════════╤════════════╤══════════════╤════════╕ │ │ KernelName │ Count │ Sum(ns) │ Mean(ns) │ Median(ns) │ Pct │ ╞════╪══════════════════════════════════════════╪═════════╪═══════════╪════════════╪══════════════╪════════╡ │ 0 │ vecCopy(double*, double*, double*, int, │ 1 │ 20000.00 │ 20000.00 │ 20000.00 │ 100.00 │ │ │ int) [clone .kd] │ │ │ │ │ │ ╘════╧══════════════════════════════════════════╧═════════╧═══════════╧════════════╧══════════════╧════════╛ -------------------------------------------------------------------------------- 2. System Speed-of-Light ╒═════════╤═══════════════════════════╤═══════════════════════╤══════════════════╤════════════════════╤════════════════════════╕ │ Index │ Metric │ Value │ Unit │ Peak │ PoP │ ╞═════════╪═══════════════════════════╪═══════════════════════╪══════════════════╪════════════════════╪════════════════════════╡ │ 2.1.0 │ VALU FLOPs │ 0.0 │ Gflop │ 22630.4 │ 0.0 │ ├─────────┼───────────────────────────┼───────────────────────┼──────────────────┼────────────────────┼────────────────────────┤ │ 2.1.1 │ VALU IOPs │ 367.0016 │ Giop │ 22630.4 │ 1.6217194570135745 │ ├─────────┼───────────────────────────┼───────────────────────┼──────────────────┼────────────────────┼────────────────────────┤ │ 2.1.2 │ MFMA FLOPs (BF16) │ 0.0 │ Gflop │ 90521.6 │ 0.0 │ ├─────────┼───────────────────────────┼───────────────────────┼──────────────────┼────────────────────┼────────────────────────┤ │ 2.1.3 │ MFMA FLOPs (F16) │ 0.0 │ Gflop │ 181043.2 │ 0.0 │ ├─────────┼───────────────────────────┼───────────────────────┼──────────────────┼────────────────────┼────────────────────────┤ │ 2.1.4 │ MFMA FLOPs (F32) │ 0.0 │ Gflop │ 45260.8 │ 0.0 │ ├─────────┼───────────────────────────┼───────────────────────┼──────────────────┼────────────────────┼────────────────────────┤ │ 2.1.5 │ MFMA FLOPs (F64) │ 0.0 │ Gflop │ 45260.8 │ 0.0 │ ├─────────┼───────────────────────────┼───────────────────────┼──────────────────┼────────────────────┼────────────────────────┤ │ 2.1.6 │ MFMA IOPs (Int8) │ 0.0 │ Giop │ 181043.2 │ 0.0 │ ├─────────┼───────────────────────────┼───────────────────────┼──────────────────┼────────────────────┼────────────────────────┤ │ 2.1.7 │ Active CUs │ 74 │ Cus │ 104 │ 71.15384615384616 │ ├─────────┼───────────────────────────┼───────────────────────┼──────────────────┼────────────────────┼────────────────────────┤ │ 2.1.8 │ SALU Util │ 4.016057506716307 │ Pct │ 100 │ 4.016057506716307 │ ├─────────┼───────────────────────────┼───────────────────────┼──────────────────┼────────────────────┼────────────────────────┤ │ 2.1.9 │ VALU Util │ 5.737225009594725 │ Pct │ 100 │ 5.737225009594725 │ ├─────────┼───────────────────────────┼───────────────────────┼──────────────────┼────────────────────┼────────────────────────┤ │ 2.1.10 │ MFMA Util │ 0.0 │ Pct │ 100 │ 0.0 │ ├─────────┼───────────────────────────┼───────────────────────┼──────────────────┼────────────────────┼────────────────────────┤ │ 2.1.11 │ VALU Active Threads/Wave │ 64.0 │ Threads │ 64 │ 100.0 │ ├─────────┼───────────────────────────┼───────────────────────┼──────────────────┼────────────────────┼────────────────────────┤ │ 2.1.12 │ IPC - Issue │ 1.0 │ Instr/cycle │ 5 │ 20.0 │ ├─────────┼───────────────────────────┼───────────────────────┼──────────────────┼────────────────────┼────────────────────────┤ │ 2.1.13 │ LDS BW │ 0.0 │ Gb/sec │ 22630.4 │ 0.0 │ ├─────────┼───────────────────────────┼───────────────────────┼──────────────────┼────────────────────┼────────────────────────┤ │ 2.1.14 │ LDS Bank Conflict │ │ Conflicts/access │ 32 │ │ ├─────────┼───────────────────────────┼───────────────────────┼──────────────────┼────────────────────┼────────────────────────┤ │ 2.1.15 │ Instr Cache Hit Rate │ 99.91306912556854 │ Pct │ 100 │ 99.91306912556854 │ ├─────────┼───────────────────────────┼───────────────────────┼──────────────────┼────────────────────┼────────────────────────┤ │ 2.1.16 │ Instr Cache BW │ 209.7152 │ Gb/s │ 6092.8 │ 3.442016806722689 │ ├─────────┼───────────────────────────┼───────────────────────┼──────────────────┼────────────────────┼────────────────────────┤ │ 2.1.17 │ Scalar L1D Cache Hit Rate │ 99.81986908342313 │ Pct │ 100 │ 99.81986908342313 │ ├─────────┼───────────────────────────┼───────────────────────┼──────────────────┼────────────────────┼────────────────────────┤ │ 2.1.18 │ Scalar L1D Cache BW │ 209.7152 │ Gb/s │ 6092.8 │ 3.442016806722689 │ ├─────────┼───────────────────────────┼───────────────────────┼──────────────────┼────────────────────┼────────────────────────┤ │ 2.1.19 │ Vector L1D Cache Hit Rate │ 50.0 │ Pct │ 100 │ 50.0 │ ├─────────┼───────────────────────────┼───────────────────────┼──────────────────┼────────────────────┼────────────────────────┤ │ 2.1.20 │ Vector L1D Cache BW │ 1677.7216 │ Gb/s │ 11315.199999999999 │ 14.82714932126697 │ ├─────────┼───────────────────────────┼───────────────────────┼──────────────────┼────────────────────┼────────────────────────┤ │ 2.1.21 │ L2 Cache Hit Rate │ 35.55067615693325 │ Pct │ 100 │ 35.55067615693325 │ ├─────────┼───────────────────────────┼───────────────────────┼──────────────────┼────────────────────┼────────────────────────┤ │ 2.1.22 │ L2-Fabric Read BW │ 419.8496 │ Gb/s │ 1638.4 │ 25.6255859375 │ ├─────────┼───────────────────────────┼───────────────────────┼──────────────────┼────────────────────┼────────────────────────┤ │ 2.1.23 │ L2-Fabric Write BW │ 293.9456 │ Gb/s │ 1638.4 │ 17.941015625 │ ├─────────┼───────────────────────────┼───────────────────────┼──────────────────┼────────────────────┼────────────────────────┤ │ 2.1.24 │ L2-Fabric Read Latency │ 256.6482321288385 │ Cycles │ │ │ ├─────────┼───────────────────────────┼───────────────────────┼──────────────────┼────────────────────┼────────────────────────┤ │ 2.1.25 │ L2-Fabric Write Latency │ 317.2264255699014 │ Cycles │ │ │ ├─────────┼───────────────────────────┼───────────────────────┼──────────────────┼────────────────────┼────────────────────────┤ │ 2.1.26 │ Wave Occupancy │ 1821.723057333852 │ Wavefronts │ 3328 │ 54.73927455931046 │ ├─────────┼───────────────────────────┼───────────────────────┼──────────────────┼────────────────────┼────────────────────────┤ │ 2.1.27 │ Instr Fetch BW │ 4.174722306564298e-08 │ Gb/s │ 3046.4 │ 1.3703789084047721e-09 │ ├─────────┼───────────────────────────┼───────────────────────┼──────────────────┼────────────────────┼────────────────────────┤ │ 2.1.28 │ Instr Fetch Latency │ 21.729248046875 │ Cycles │ │ │ ╘═════════╧═══════════════════════════╧═══════════════════════╧══════════════════╧════════════════════╧════════════════════════╛
Note
Some cells may be blank indicating a missing or unavailable hardware counter or NULL value.
Optimize the application, iterate, and re-profile to inspect performance changes.
Redo a comprehensive analysis with ROCm Compute Profiler CLI at any optimization milestone.
More analysis options#
- Single run
$ rocprof-compute analyze -p workloads/vcopy/MI200/
- List top kernels and dispatches
$ rocprof-compute analyze -p workloads/vcopy/MI200/ --list-stats
- List metrics
$ rocprof-compute analyze -p workloads/vcopy/MI200/ --list-metrics gfx90a
- Show System Speed-of-Light and CS_Busy blocks only
$ rocprof-compute analyze -p workloads/vcopy/MI200/ -b 2 5.1.0
Note
You can filter a single metric or the whole hardware component by its ID. In
this case, 1 is the ID for System Speed-of-Light and 5.1.0 the ID for
GPU Busy Cycles metric.
- Filter kernels
First, list the top kernels in your application using –list-stats.
$ rocprof-compute analyze -p workloads/vcopy/MI200/ --list-stats

Analysis mode = cli
[analysis] deriving rocprofiler-compute metrics...

--------------------------------------------------------------------------------
Detected Kernels (sorted descending by duration)
╒════╤══════════════════════════════════════════════╕
│    │ Kernel_Name                                  │
╞════╪══════════════════════════════════════════════╡
│  0 │ vecCopy(double*, double*, double*, int, int) │
╘════╧══════════════════════════════════════════════╛

--------------------------------------------------------------------------------
Dispatch list
╒════╤═══════════════╤══════════════════════════════════════════════╤══════════╕
│    │   Dispatch_ID │ Kernel_Name                                  │   GPU_ID │
╞════╪═══════════════╪══════════════════════════════════════════════╪══════════╡
│  0 │             0 │ vecCopy(double*, double*, double*, int, int) │        0 │
╘════╧═══════════════╧══════════════════════════════════════════════╧══════════╛
Second, select the index of the kernel you would like to filter; for example,
vecCopy(double*, double*, double*, int, int) [clone .kd]at index0. Then, use this index to apply the filter via-kor--kernels.$ rocprof-compute analyze -p workloads/vcopy/MI200/ -k 0 Analysis mode = cli [analysis] deriving rocprofiler-compute metrics... -------------------------------------------------------------------------------- 0. Top Stats 0.1 Top Kernels ╒════╤══════════════════════════════════════════╤═════════╤═══════════╤════════════╤══════════════╤════════╤═════╕ │ │ Kernel_Name │ Count │ Sum(ns) │ Mean(ns) │ Median(ns) │ Pct │ S │ ╞════╪══════════════════════════════════════════╪═════════╪═══════════╪════════════╪══════════════╪════════╪═════╡ │ 0 │ vecCopy(double*, double*, double*, int, │ 1.00 │ 18560.00 │ 18560.00 │ 18560.00 │ 100.00 │ * │ │ │ int) │ │ │ │ │ │ │ ╘════╧══════════════════════════════════════════╧═════════╧═══════════╧════════════╧══════════════╧════════╧═════╛ ...
You should see your filtered kernels indicated by an asterisk in the Top Stats table.
- Baseline comparison
rocprof-compute analyze -p workload1/path/ -p workload2/path/
OR
rocprof-compute analyze -p workload1/path/ -k 0 -p workload2/path/ -k 1