What is ROCm Optiq?#
2026-03-26
2 min read time
ROCm Optiq is a unified visualization and analysis tool for performance data collected by ROCm profiling tools, specifically ROCm Systems Profiler and ROCm Compute Profiler.
Since ROCm Optiq doesn’t have any dependencies on the ROCm stack, trace files and profiling data files can be visualized with the ROCm Optiq GUI on any machine running a supported Microsoft Windows or Linux operating system (see System requirements for more information).
Visualize ROCm Systems Profiler traces#
Use ROCm Optiq to inspect CPU-GPU interactions, ROCm API calls, kernel execution timelines, memory usage, and system telemetry data for applications running on the ROCm stack.
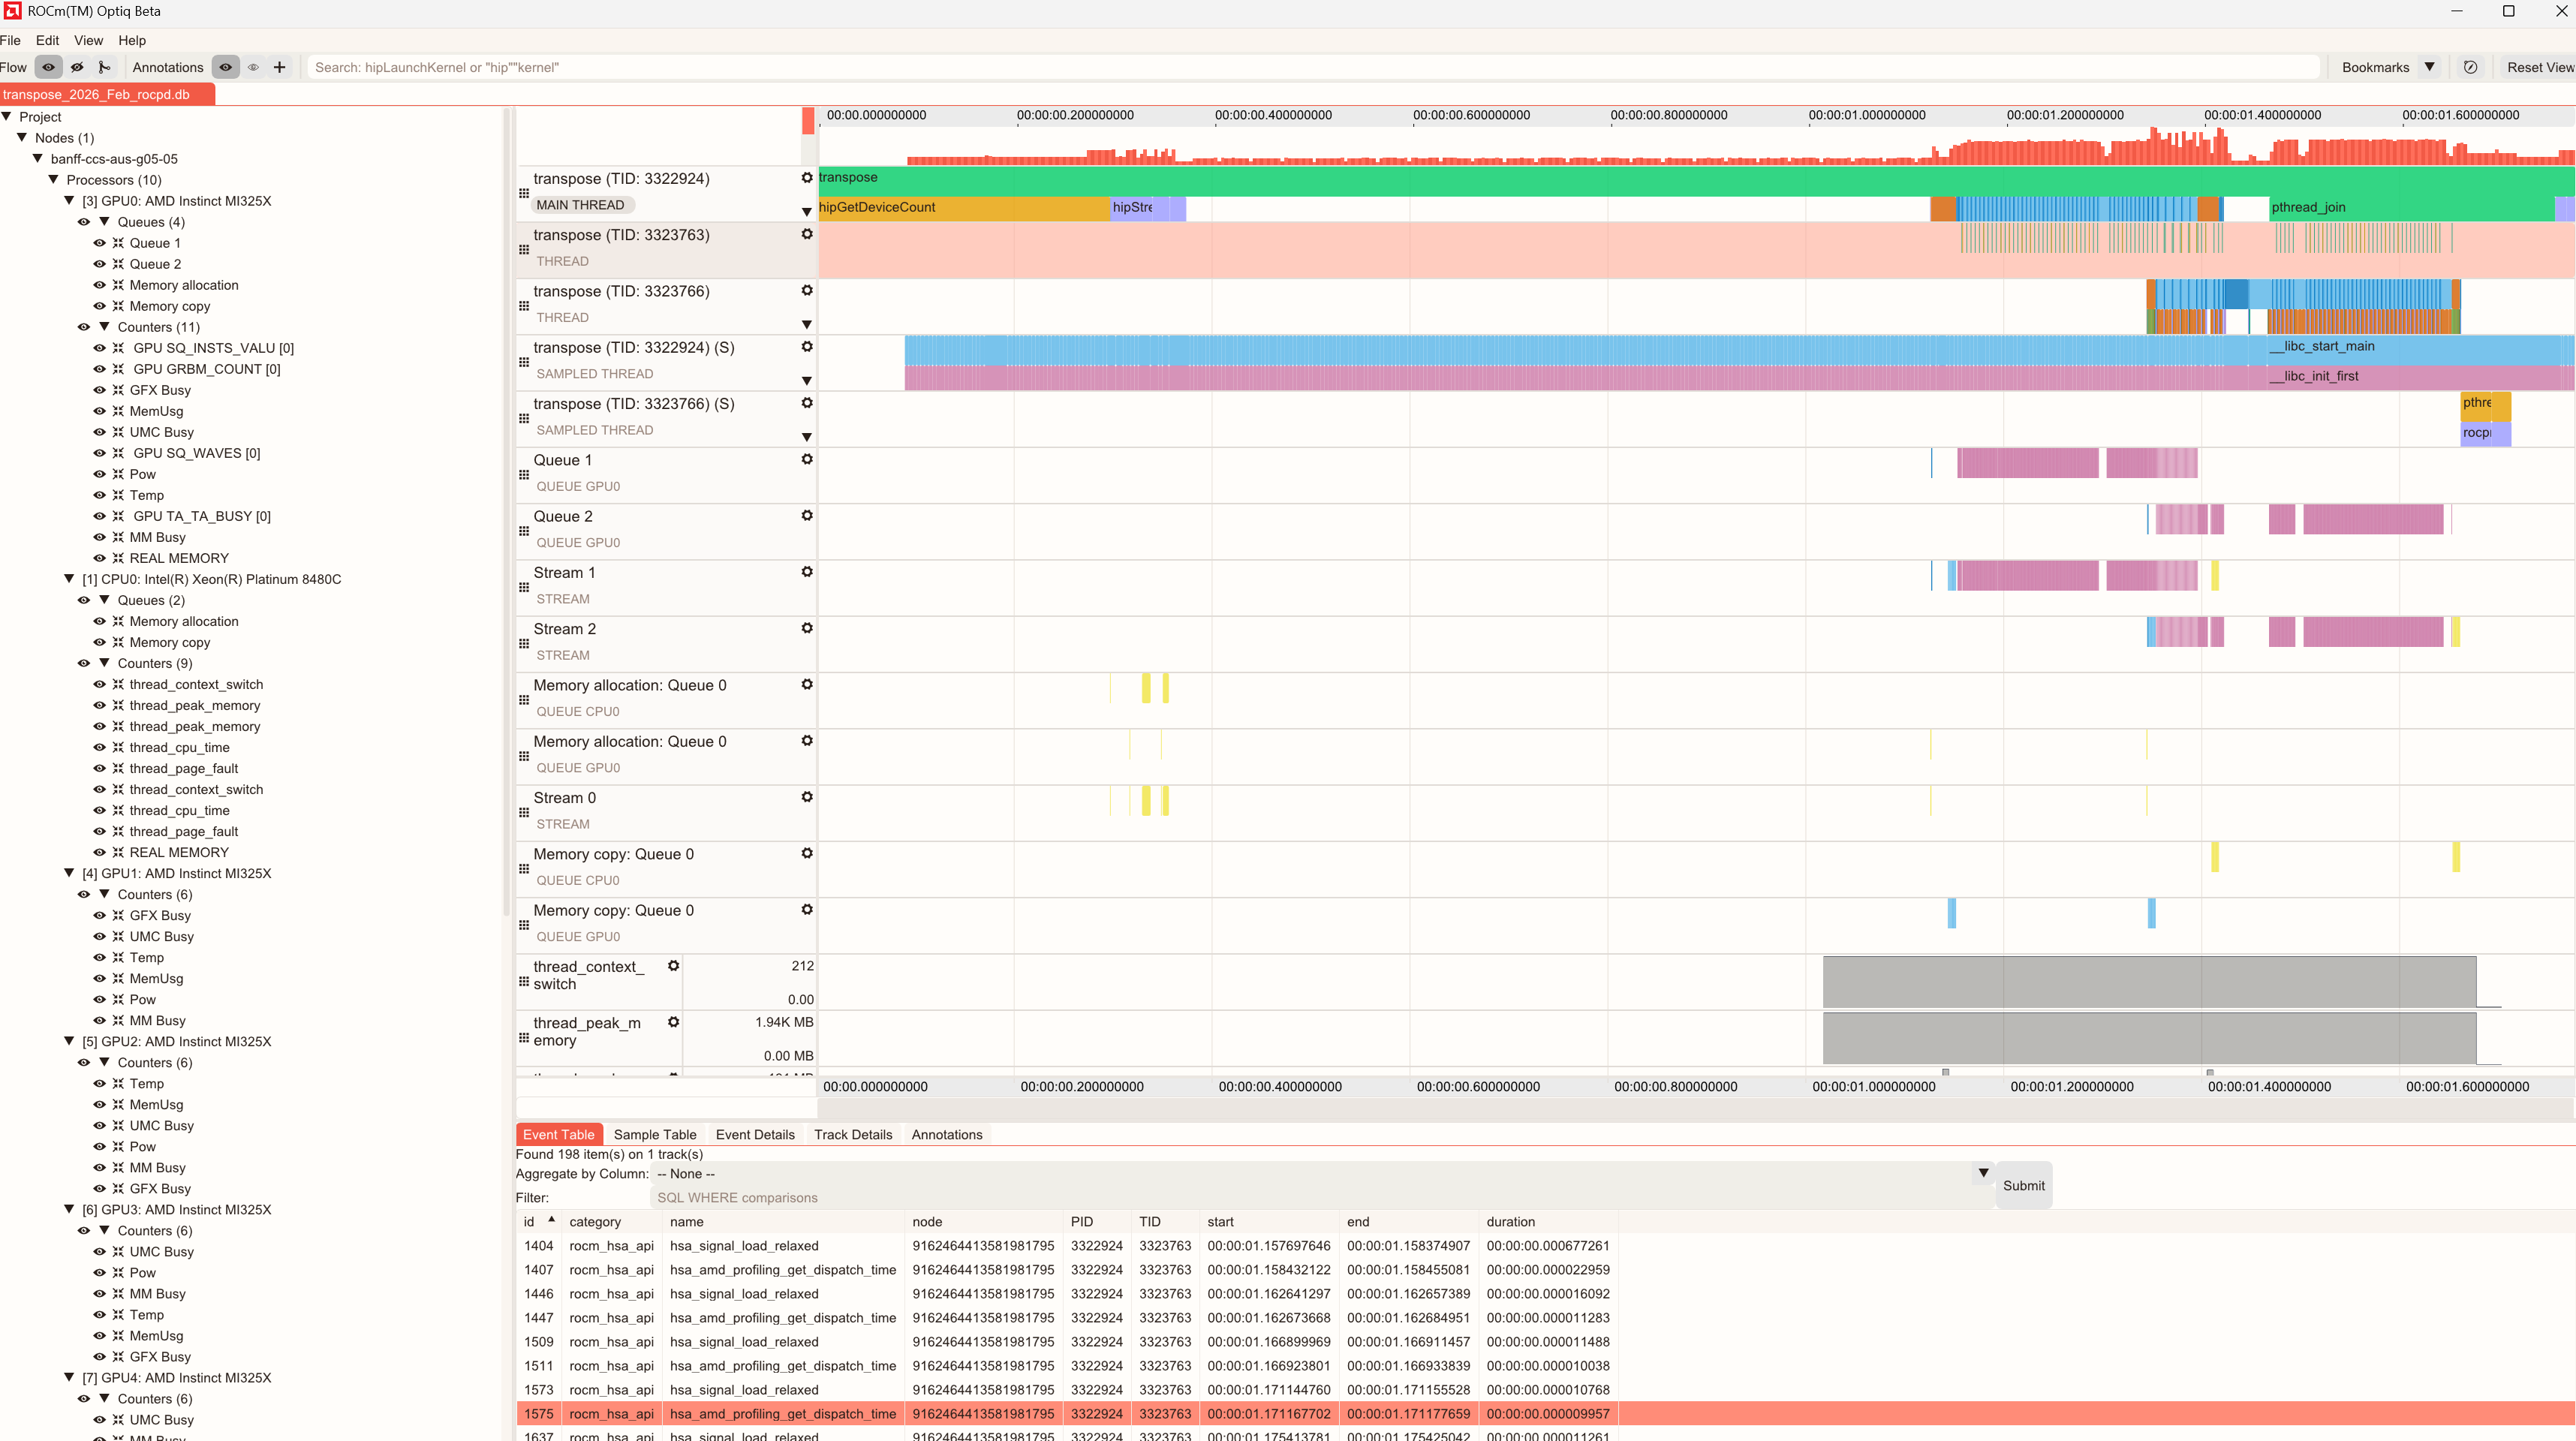
ROCm Optiq helps you identify stalls, memory bandwidth issues, and inefficient kernel launches. It correlates GPU workloads with in-application CPU events and performance with hardware resource usage, providing a holistic view for optimization.
Key views include:
System Topology View: Displays hardware (processors, queues, counters) and software hierarchy (processes, streams, threads, sampled threads), enabling clear navigation and correlation between application execution and hardware resources.
Timeline View: Displays chronological CPU and GPU activities, events, and performance metrics. It supports tools for zooming, filtering, and bookmarking for detailed analysis.
Advanced Details: Provides an in-depth view of profiling data, enabling you to analyze performance metrics and event-specific information. This section provides a unified interface for multiple data perspectives, offering granular insights.
Summary View: Displays the top 10 kernels by execution time using pie charts, bar charts, or tables.
Minimap: Provides a compact overview of event density and counter values across the entire trace, enabling rapid navigation of large datasets.
Analyze ROCm Compute Profiler data#
Use ROCm Optiq to visualize profiling analysis data to rapidly identify performance bottlenecks and explore kernel-level metrics for a profiled workload.
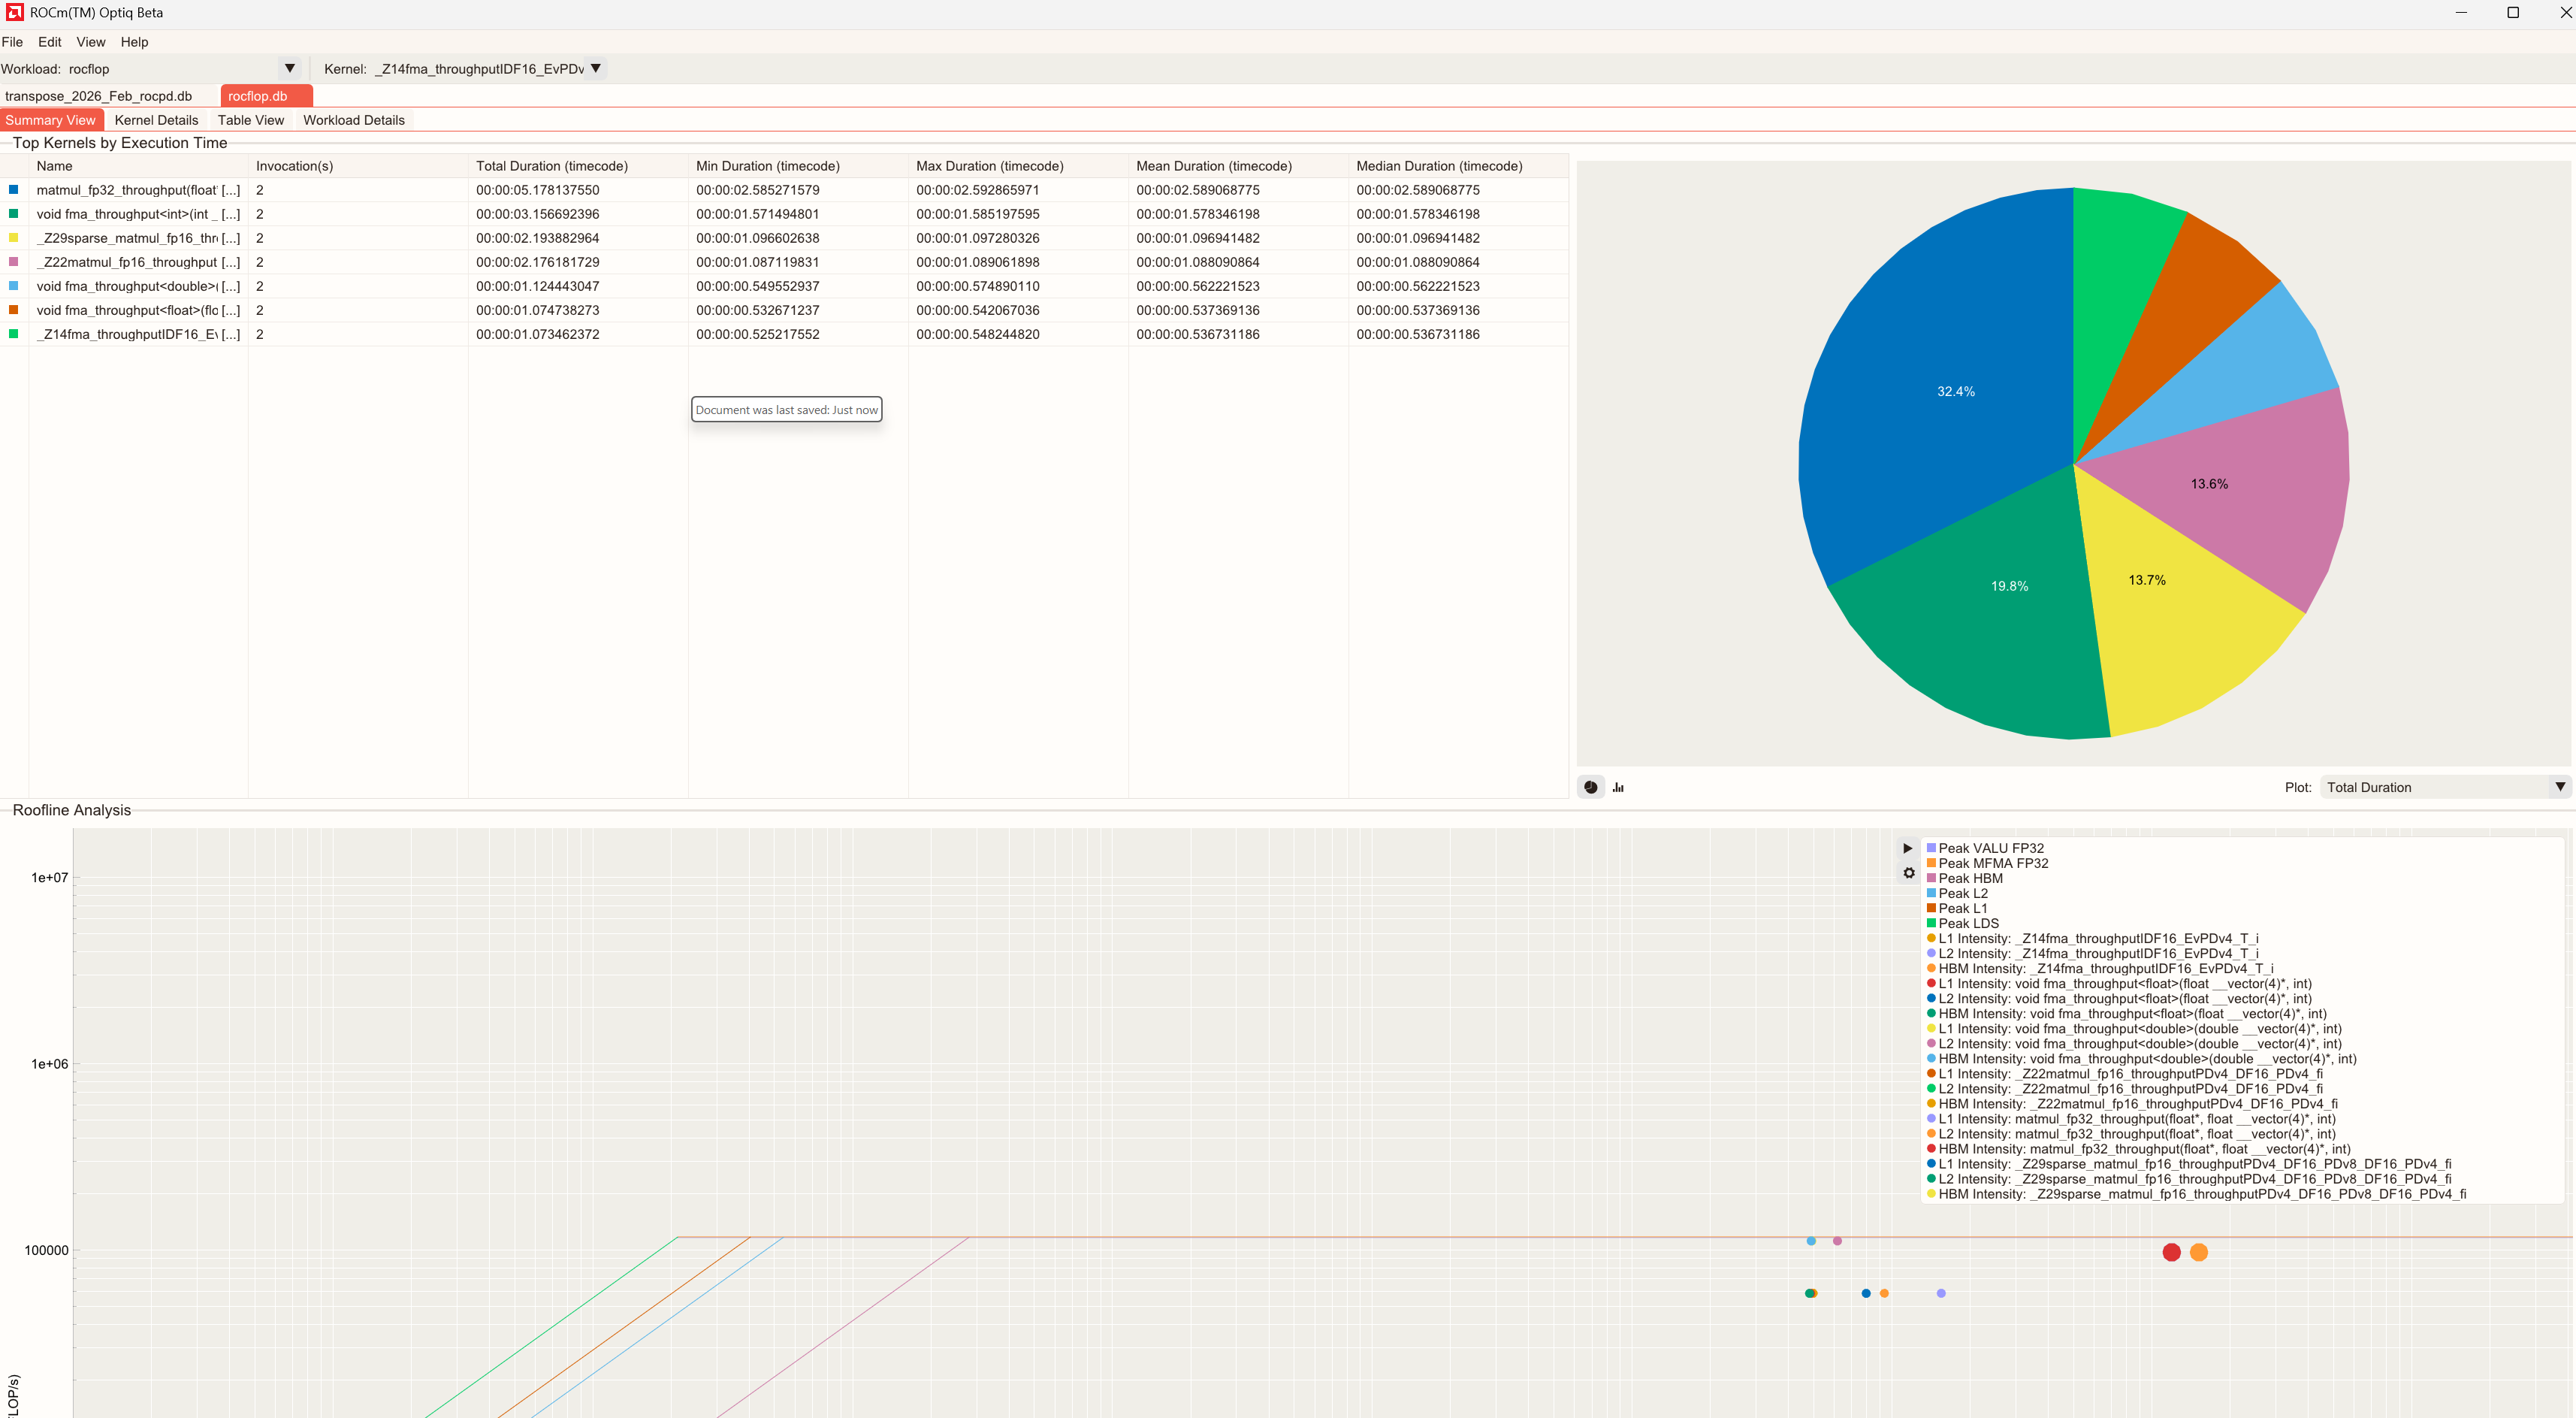
Key features include:
Summary View: High-level overview of the captured compute profiling data.
Kernel Details: Focuses on individual kernels.
Table View: Complete list of available metrics for the selected kernel. Metrics are grouped by category.
Workload Details: Contextual information about the profiled workload, including system information and profiling configuration.