Using RDC features#
This topic provides information related to the features of the RDC tool.
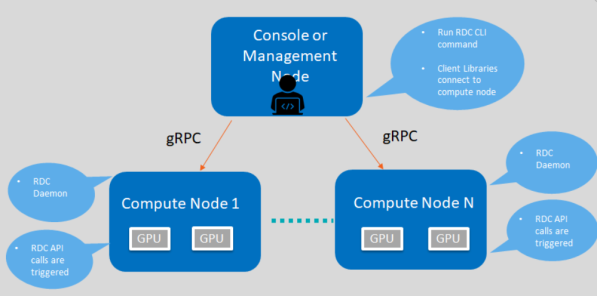
Fig. 2 RDC components and framework for describing features#
Discovery#
The discovery feature is used to locate and display information of GPUs present in the compute node.
Example:
$ rdci discovery <host_name> -l
2 GPUs found
GPU index |
Device information |
0 |
Name: AMD Radeon Instinct MI50 accelerator |
1 |
Name: AMD Radeon Instinct MI50 accelerator |
To list available GPUs, use:
$ rdci -l : list available GPUs
Groups#
This section explains the GPU and field groups features.
GPU groups#
With the GPU groups feature, you can create, delete, and list logical groups of GPU.
To create a group, use:
$ rdci group -c GPU_GROUP
Successfully created a group with a group ID 1
To add GPUs to a group, use:
$ rdci group -g 1 -a 0,1
Successfully added the GPU 0,1 to group 1
To delete a group, use:
$ rdci group -d 1
Successfully removed group 1
To list groups, use:
$ rdci group –l
1 group found
Group ID
Group name
GPU index
1
GPU_GROUP
0, 1
Field groups#
The field groups feature provides you the options to create, delete, list field groups, and monitor specific GPU metrics.
To create a field group, use:
$ rdci fieldgroup -c <fgroup> -f 150,155
Successfully created a field group with a group ID 1
To list field groups, use:
$ rdci fieldgroup -l
1 group found
Group ID
Group Name
Field IDs
1
Fgroup
150, 155
To delete a field group, use:
$ rdci fieldgroup -d 1
Successfully removed field group 1
Monitor errors#
To get the Reliability, Availability, and Serviceability (RAS) Error-Correcting Code (ECC) counter, define the following fields:
Correctable ECC errors:
312 ``RDC_FI_ECC_CORRECT_TOTAL``
Uncorrectable ECC errors:
313 ``RDC_FI_ECC_UNCORRECT_TOTAL``
Device monitoring#
The device monitoring feature is used to monitor the GPU fields such as temperature, power usage, and utilization.
$ rdci dmon -f <field_group> -g <gpu_group> -c 5 -d 1000
1 group found
GPU index |
TEMP (m°C) |
POWER (µW) |
0 |
25000 |
520500 |
Job stats#
The job stats is used to display GPU statistics for any given workload.
To start recording stats, use:
$ rdci stats -s 2 -g 1
Successfully started recording job 2 with a group ID 1
To stop recording stats, use:
$ rdci stats -x 2
Successfully stopped recording job 2
To display job stats, use:
$ rdci stats -j 2
Summary
Executive status
Start time
1586795401
End time
1586795445
Total execution time
44
Energy consumed (Joules)
21682
Power usage (Watts)
Max: 49 Min: 13 Avg: 34
GPU clock (MHz)
Max: 1000 Min: 300 Avg: 903
GPU utilization (%)
Max: 69 Min: 0 Avg: 2
Max GPU memory used (bytes)
524320768
Memory utilization (%)
Max: 12 Min: 11 Avg: 12
Job stats use case#
A common job stats use case is to record GPU statistics associated with any job or workload. The following figure illustrates how all RDC features can be put together for this use case:
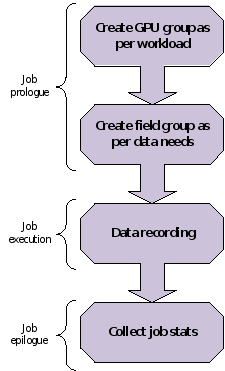
Fig. 3 An example showing how job statistics can be recorded#
Here are the rdci commands for this use case:
$ rdci group -c group1

successfully created a group with a group ID 1

$ rdci group -g 1 -a 0,1

GPU 0,1 is added to group 1 successfully.

rdci stats -s 123 -g 1

job 123 recorded successfully with the group ID

rdci stats -x 123

job 123 stops recording successfully

rdci stats -j 123

job stats printed
Error-correcting code output#
In the job output, this feature prints out the Error-Correcting Code (ECC) errors while running the job.
To see the ECC correctable and uncorrectable error counters, see this example.
Diagnostic#
The diagnostic feature when run on a GPU group provides the following details:
$ rdci diag -g <gpu_group>

No compute process:  Pass
Node topology check:  Pass
GPU parameters check:  Pass
Compute Queue ready:  Pass
System memory check:  Pass
=============== Diagnostic Details ==================
No compute process:  No processes running on any devices.
Node topology check:  No link detected.
GPU parameters check:  GPU 0 Critical Edge temperature in range.
Compute Queue ready:  Run binary search task on GPU 0 Pass.
System memory check:  Max Single Allocation Memory Test for GPU 0 Pass. CPUAccessToGPUMemoryTest for GPU 0 Pass. GPUAccessToCPUMemoryTest for GPU 0 Pass.