Setting up a Grafana server for Omniperf#
A Grafana server is not required to profile or analyze performance data from the CLI. It’s a supplementary mechanism to help you import performance data and examine it in a detailed Grafana dashboard GUI.
Learn about installing and configuring the main Omniperf tool in Core installation.
Setting up a Grafana instance for Omniperf requires the following basic software dependencies.
The recommended process for enabling the server-side of Omniperf is to use the
provided Dockerfile to build the Grafana and MongoDB instance.
Set up Grafana and MongoDB#
Once you’ve decided where to host the Grafana and MongoDB instance, complete the the following setup instructions.
Install MongoDB utilities#
Omniperf uses the mongoimport utility to upload data to your Grafana instance’s backend database.
Use the following commands to install MongoDB utilities for Ubuntu 20.04.
$ wget https://fastdl.mongodb.org/tools/db/mongodb-database-tools-ubuntu2004-x86_64-100.6.1.deb
$ sudo apt install ./mongodb-database-tools-ubuntu2004-x86_64-100.6.1.deb
Note
Find installation instructions for other distributions in MongoDB Database Tools Downloads.
Set up persistent storage#
Bind MongoDB to a directory on the host OS to create a local backup in case of a crash or reset. This is called creating a persistent volume.
$ sudo mkdir -p /usr/local/persist && cd /usr/local/persist/
$ sudo mkdir -p grafana-storage mongodb
$ sudo docker volume create --driver local --opt type=none --opt device=/usr/local/persist/grafana-storage --opt o=bind grafana-storage
$ sudo docker volume create --driver local --opt type=none --opt device=/usr/local/persist/mongodb --opt o=bind grafana-mongo-db
Build and launch the Docker container#
You’re now ready to build your Dockerfile. Navigate to your Omniperf install
directory to begin.
$ cd grafana
$ sudo docker-compose build
$ sudo docker-compose up -d
The TCP ports for Grafana (4000) and MongoDB (27017) in the Docker
container are mapped to 14000 and 27018, respectively, on the host side.
Tip
In the event that either your Grafana or MongoDB instance crashes fatally, just restart the server. Navigate to your install directory and run:
$ sudo docker-compose down
$ sudo docker-compose up -d
Set up the Grafana dashboard#
Once you’ve launched your Docker container you should be able to reach Grafana
at http://<host-ip>:14000. The default login credentials for your first-time
Grafana setup are:
Username:
adminPassword:
admin
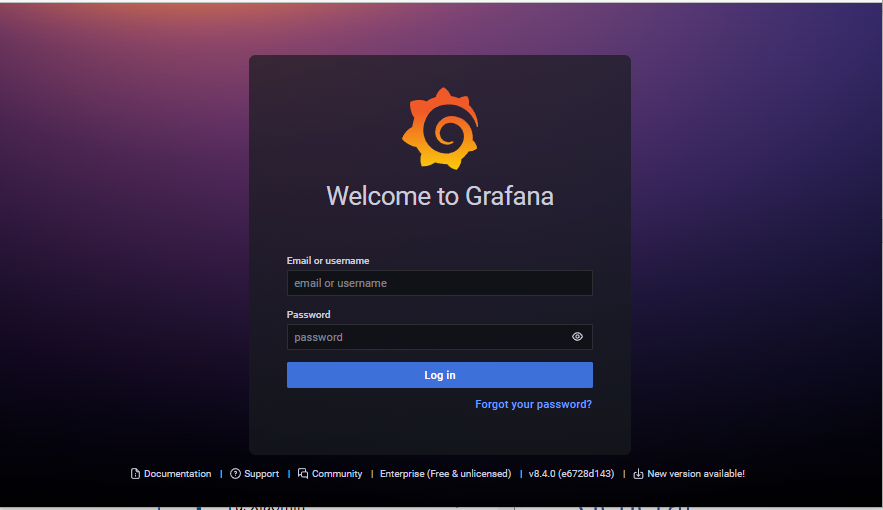
Fig. 1 Grafana’s welcome screen.#
Configure the MongoDB data source#
You must configure your MongoDB data source in Grafana before first-time use. Navigate to Grafana’s Configuration page to add the “Omniperf Data” connection.
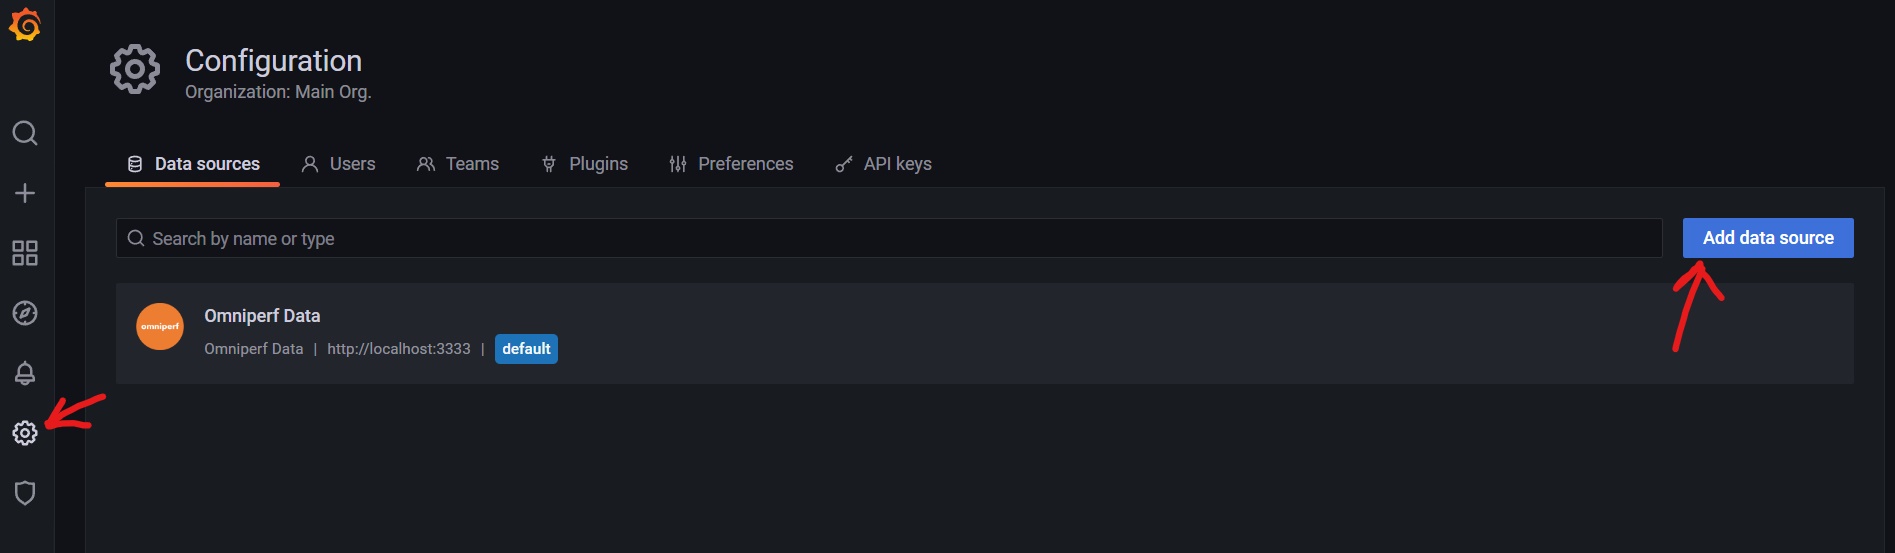
Fig. 2 Grafana’s Configuration page.#
Configure the following fields in the data source settings.
HTTP URL |
|
|---|---|
MongoDB URL |
|
Database Name |
|
After configuring these fields, click Save & test to make sure your connection is successful.
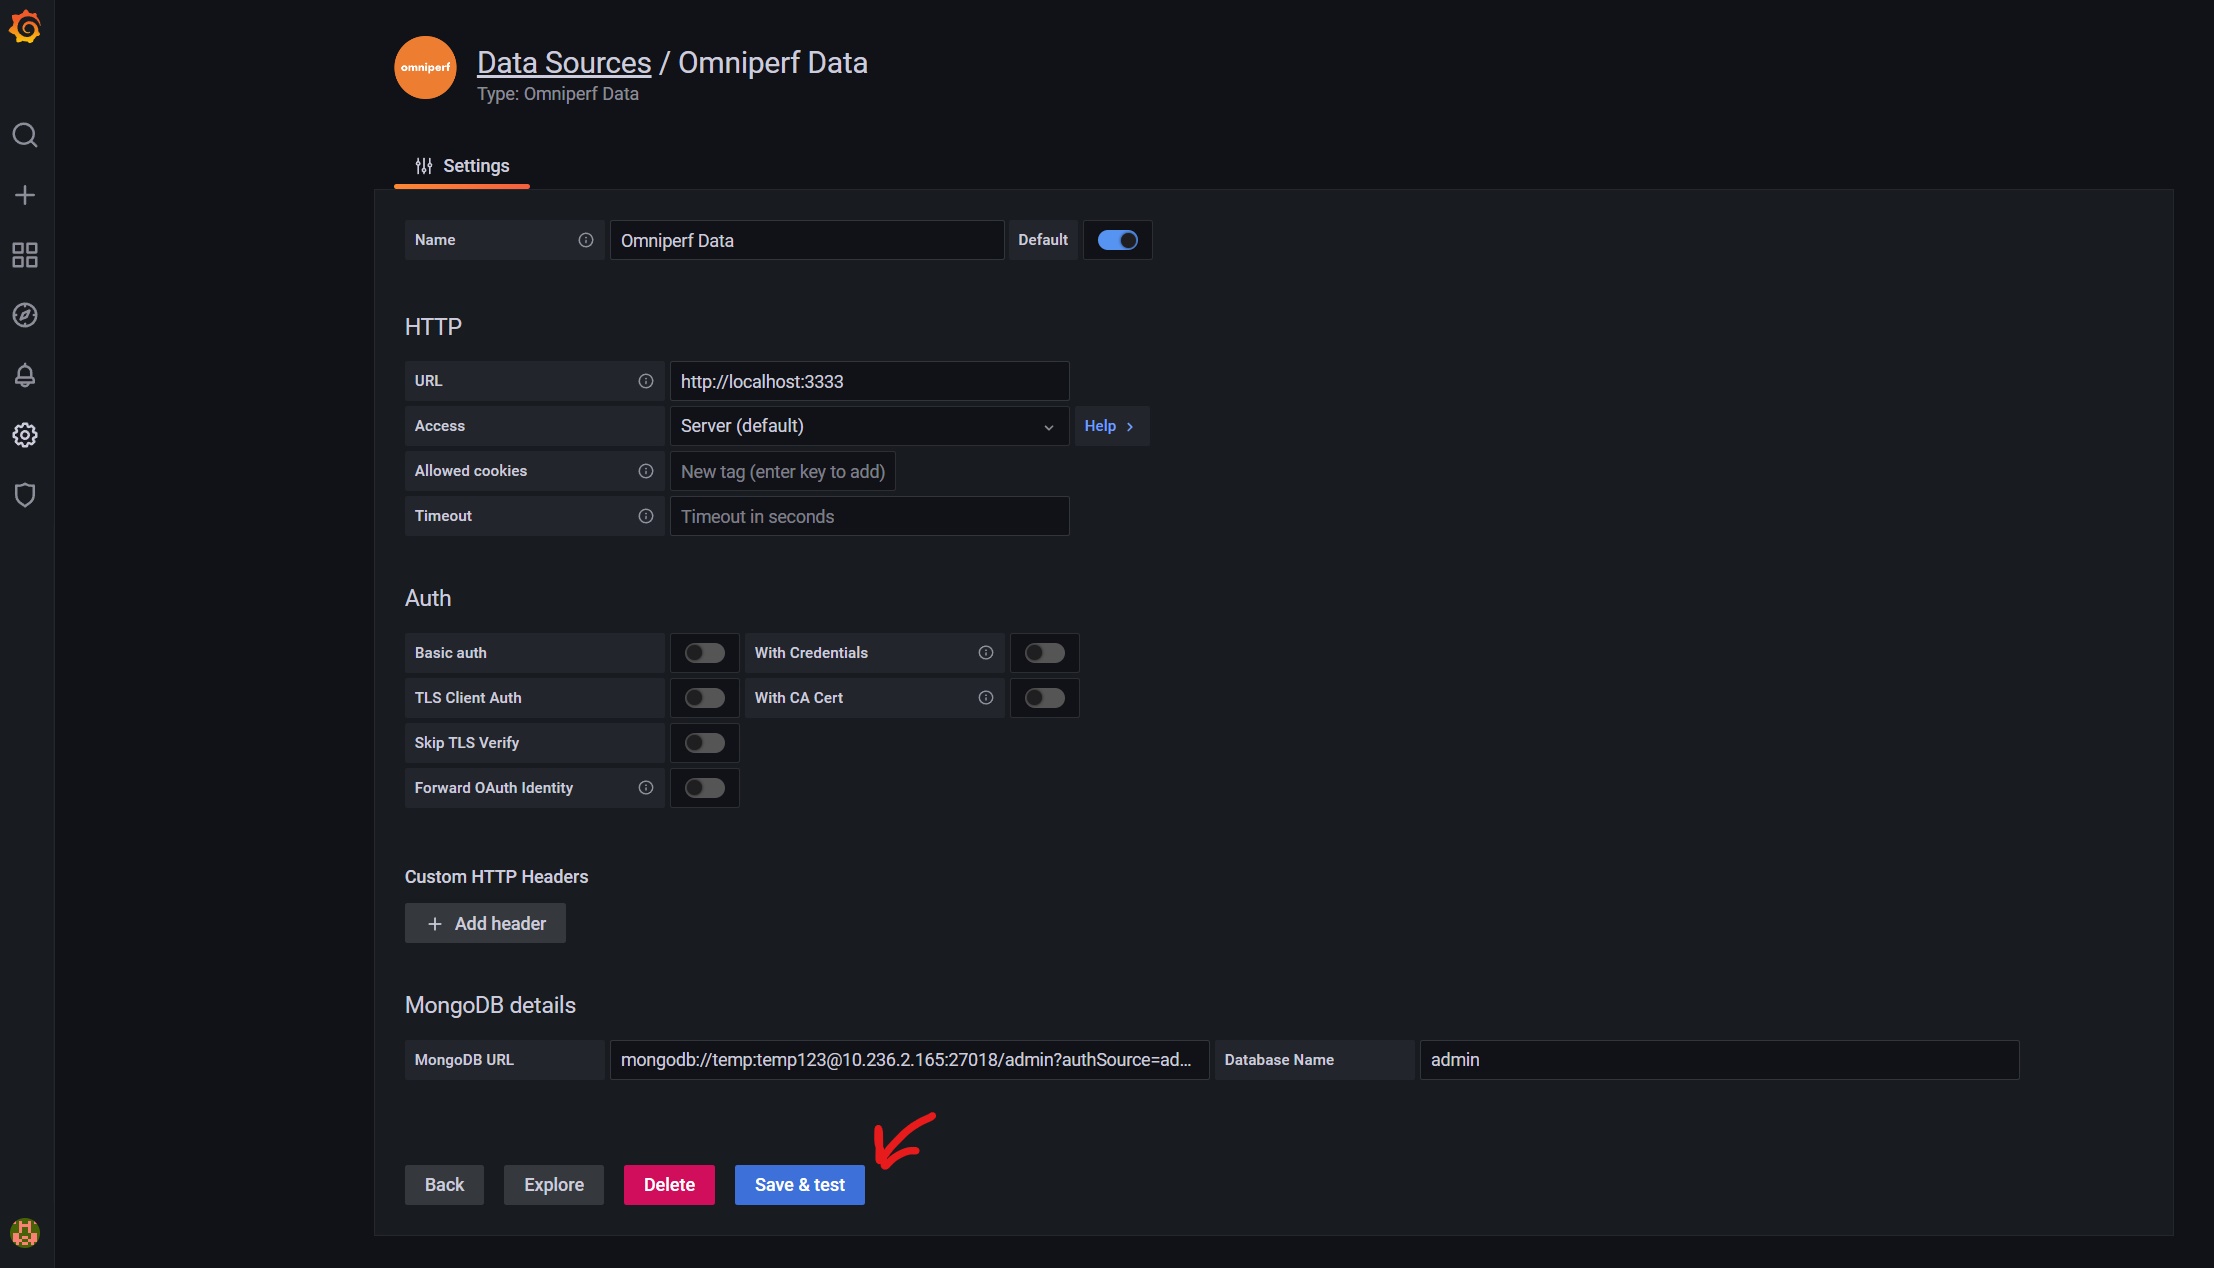
Fig. 3 Grafana data source settings.#
Note
To avoid potential DNS issues, you might need to use the actual IP address for the host node in the MongoDB URL.
Import the Omniperf dashboard file#
From the Create → Import page, upload the dashboard file,
/dashboards/Omniperf_v{__VERSION__}_pub.json from the
Omniperf tarball.
Edit both the dashboard Name and the Unique identifier (UID) fields to uniquely identify the dashboard. Click Import to complete the process.
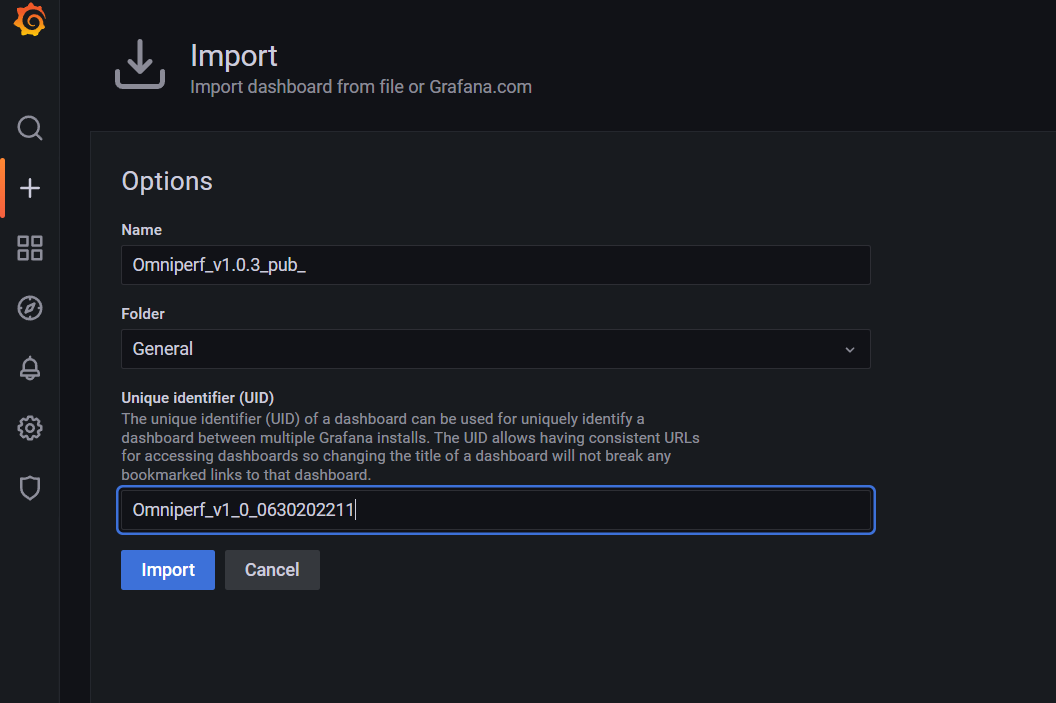
Fig. 4 Grafana’s Import dashboard.#
Select and load the Omniperf workload#
Once you have imported a dashboard you’re ready to begin. Start by browsing available dashboards and selecting the dashboard you have just imported.
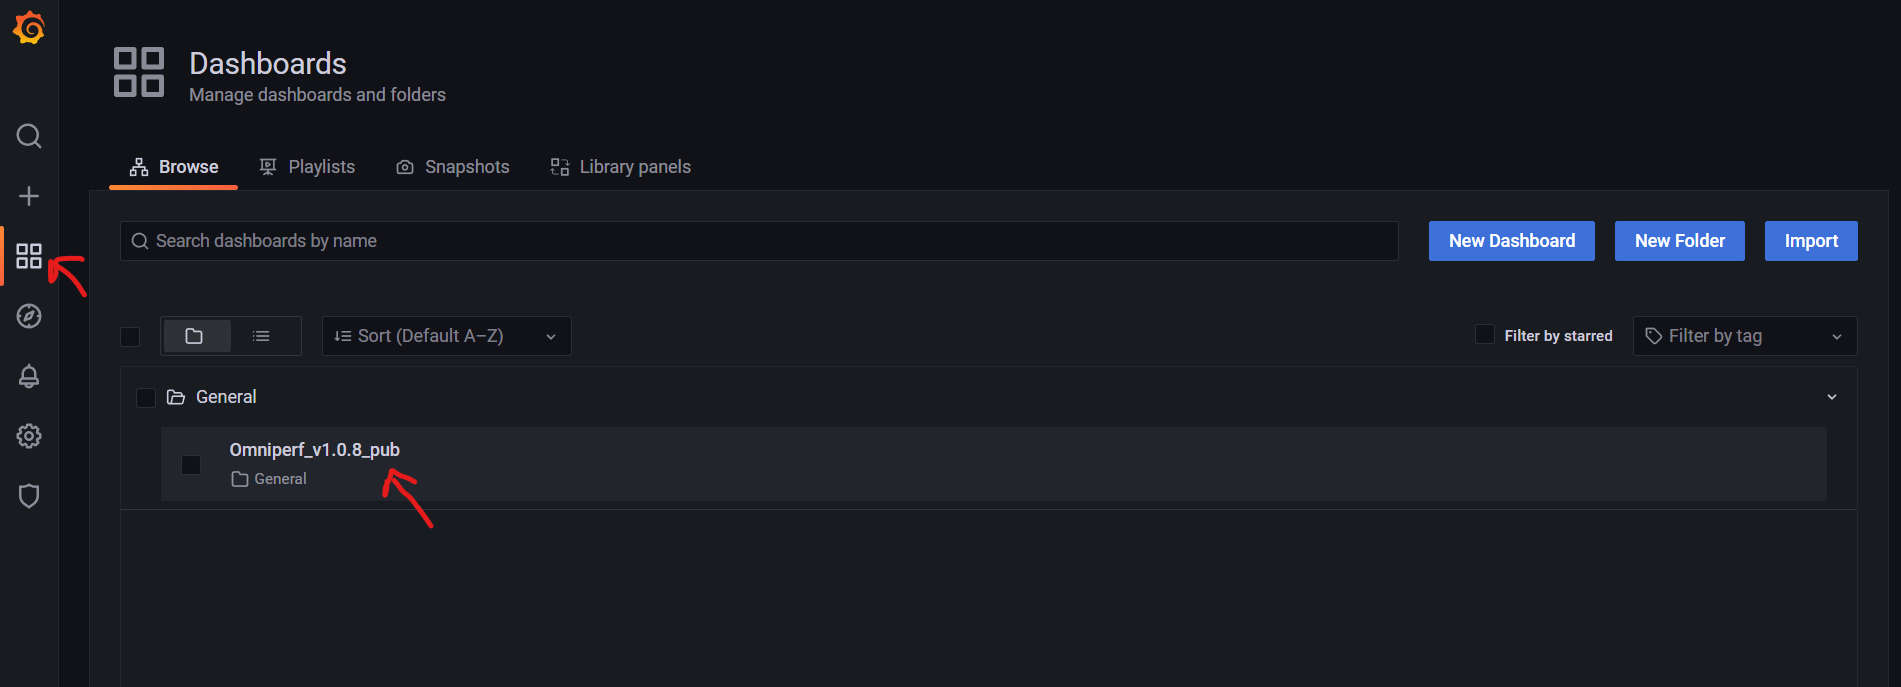
Fig. 5 Opening your Omniperf profiling dashboard in Grafana.#
Remember that you need to upload workload data to the MongoDB backend before analyzing in your Grafana interface. See a detailed example of this in Grafana GUI import.
After a workload has been successfully uploaded, you should be able to select it from the workload dropdown located at the top of your Grafana dashboard.
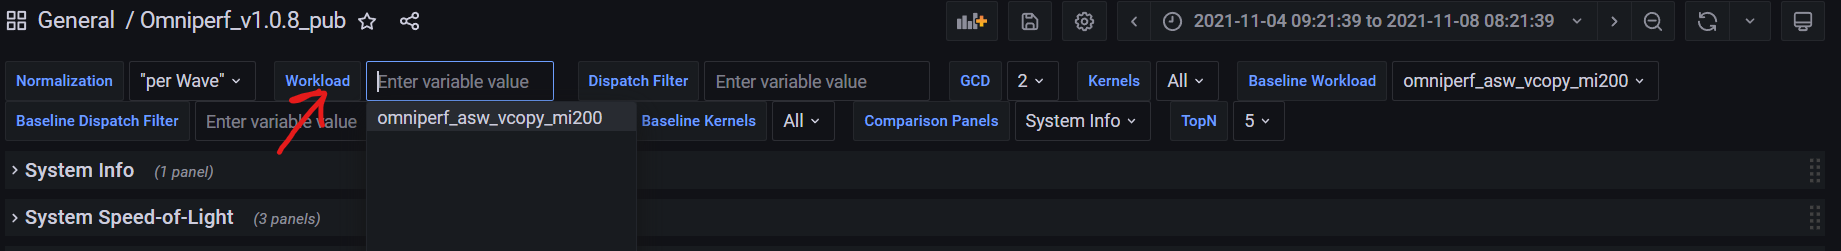
Fig. 6 Selecting your Omniperf workload in Grafana.#
For more information on how to use the Grafana interface for analysis see Grafana GUI analysis.